Sleep Apnea Devices Market Size and Share
Market Overview
| Study Period | 2020 - 2031 |
|---|---|
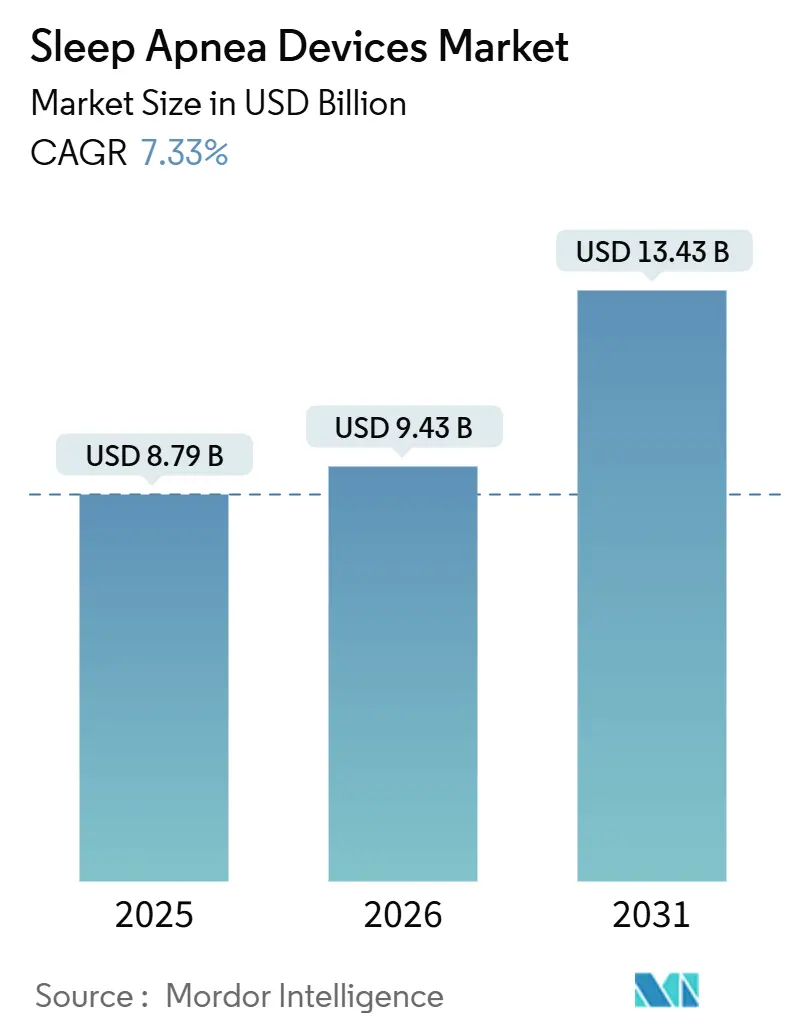
| Market Size (2026) | USD 9.43 Billion |
| Market Size (2031) | USD 13.43 Billion |
| Growth Rate (2026 - 2031) | 7.33% CAGR |
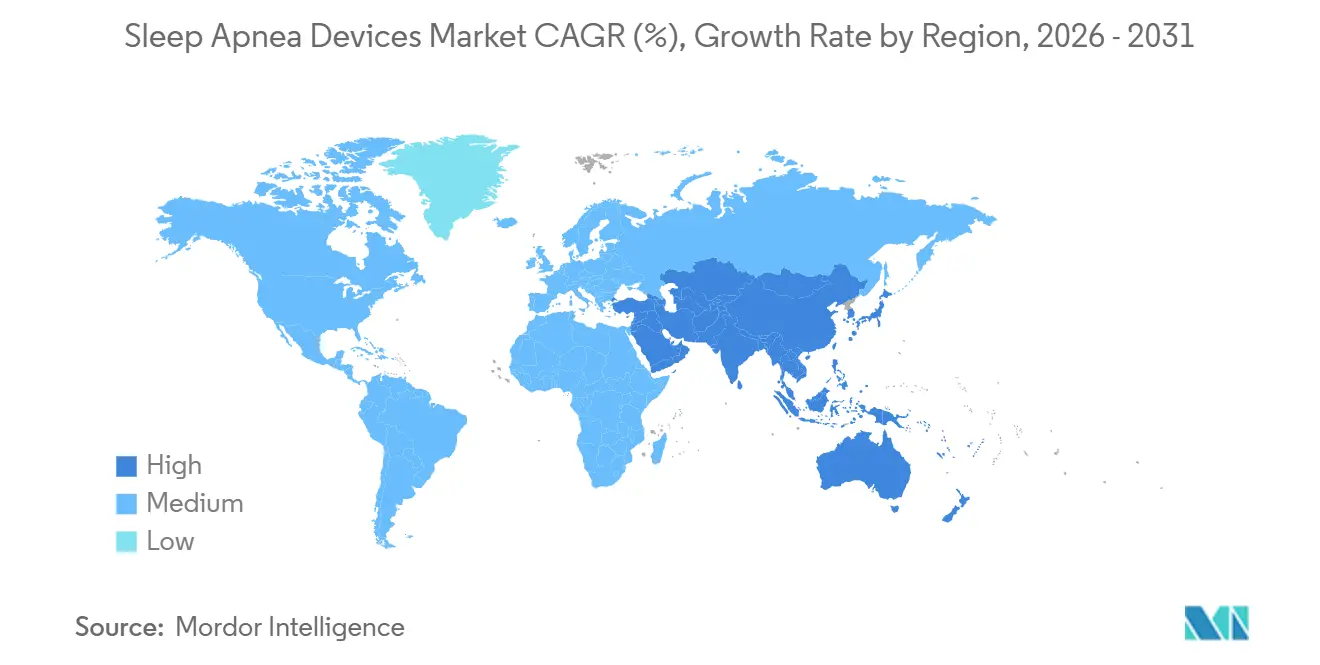
| Fastest Growing Market | Asia Pacific |
| Largest Market | North America |
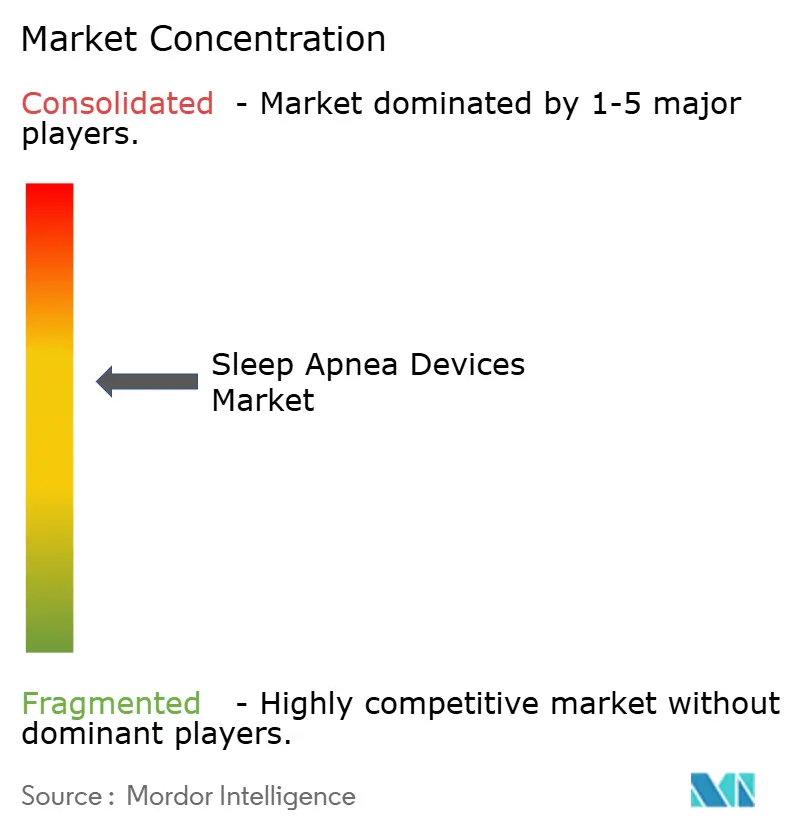
| Market Concentration | Medium |
Major Players *Disclaimer: Major Players sorted in no particular order Image © Mordor Intelligence. Reuse requires attribution under CC BY 4.0. | |
Sleep Apnea Devices Market Analysis by Mordor Intelligence
The Sleep Apnea Devices Market size is expected to increase from USD 8.79 billion in 2025 to USD 9.43 billion in 2026 and reach USD 13.43 billion by 2031, growing at a CAGR of 7.33% over 2026-2031.
Structural growth rests less on incremental unit volume and more on reimbursement reform, supplier diversification mandates that followed the Philips Respironics recall, and the shift toward cloud-connected hardware that converts one-time equipment sales into recurring software revenue. Regulatory scrutiny intensified after Philips booked a cumulative EUR 1.1 billion (USD 1.2 billion) recall charge and signed an FDA consent decree in April 2024, prompting hospitals and durable medical equipment (DME) distributors to dual-source devices and accelerate tender cycles. Hypoglossal-nerve stimulation, cleared for moderate-to-severe obstructive sleep apnea (OSA) in 2024, created a premium alternative to positive-airway-pressure therapy, while AI-driven adherence platforms began earning remote-patient-monitoring fees under United States Medicare. The United States Centers for Medicare & Medicaid Services (CMS) reported a 12.5% improper-payment rate for respiratory-assist devices in 2024, signaling tougher documentation audits that favor suppliers able to integrate electronic health record workflows.[1]Cigna, “Coverage Policy 057 Obstructive Sleep Apnea Treatment,” CIGNA.COM
Key drivers include record obesity-linked OSA prevalence, broader insurance coverage for cloud-connected positive-airway-pressure (PAP) and oral appliances, and the FDA’s clearance of machine-learning algorithms that auto-titrate pressure settings in real time.
Key Report Takeaways
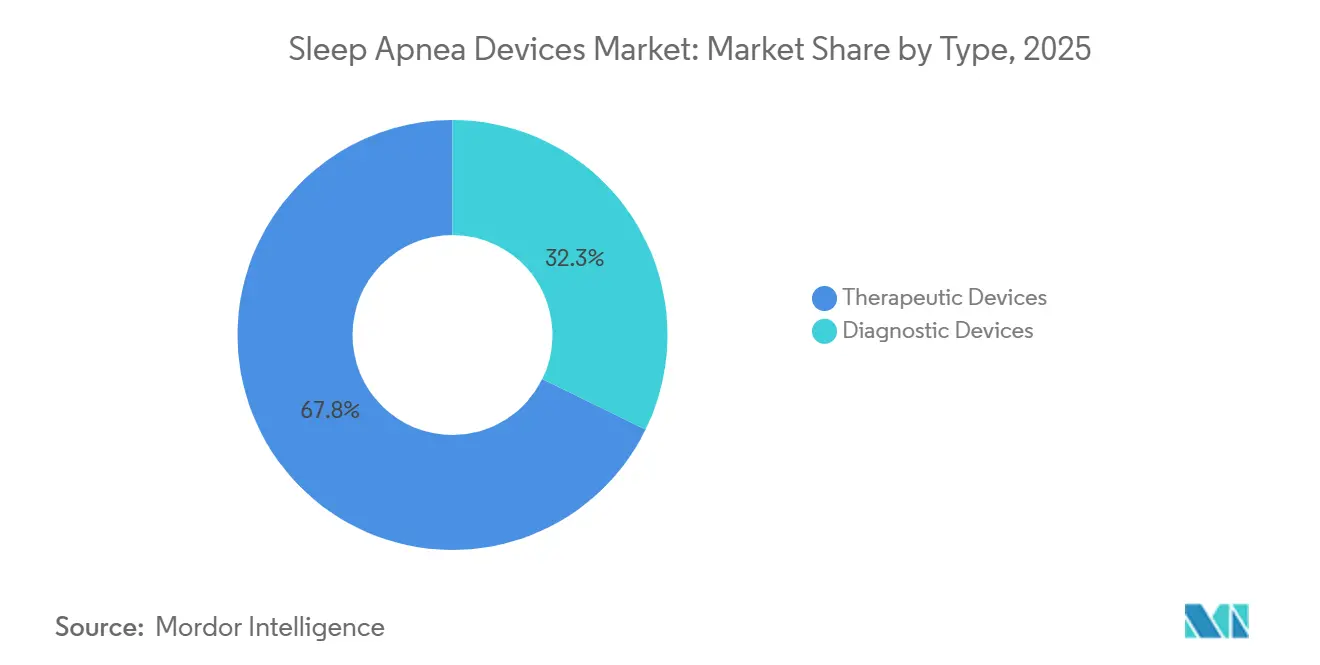
- By type, therapeutic devices captured 67.75% of % sleep apnea device market share in 2025.
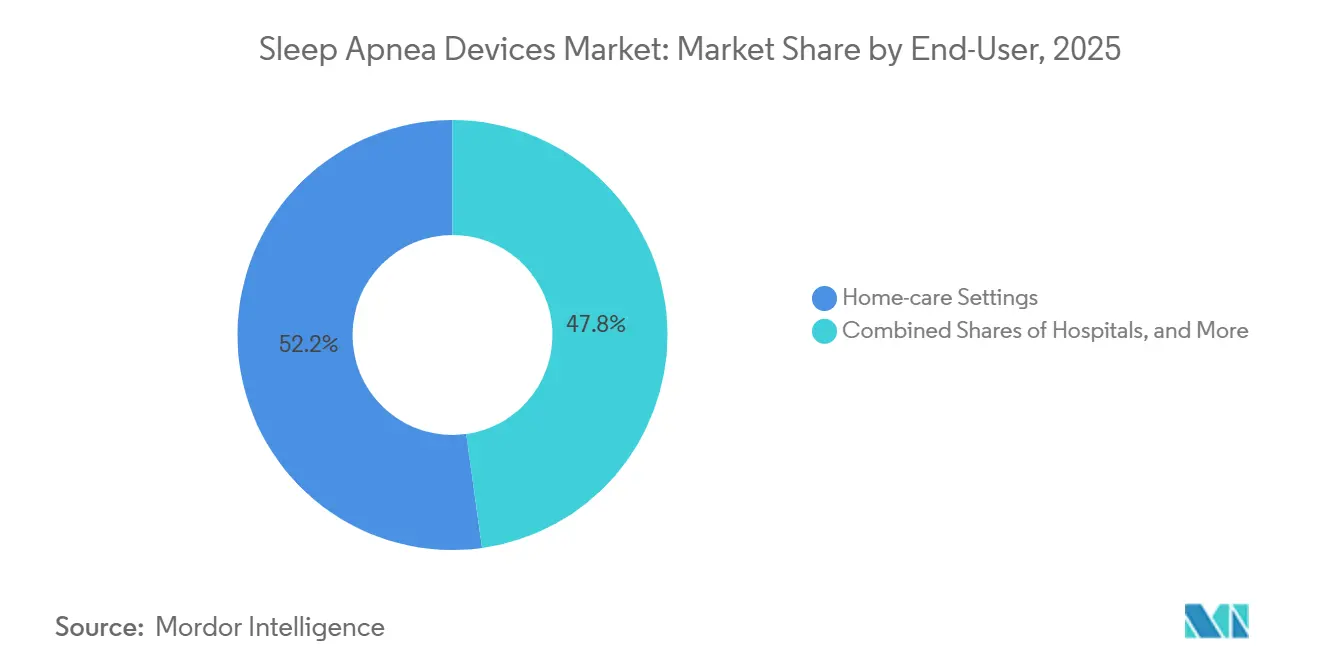
- By end user, home care settings accounted for 52.20% of 2025 revenue and are projected to grow at 7.20% through 2031.
- By geography, the Asia-Pacific region is forecast to exhibit the fastest regional CAGR of 8.90% to 2031.
Note: Market size and forecast figures in this report are generated using Mordor Intelligence’s proprietary estimation framework, updated with the latest available data and insights as of January 2026.
Market Trends and Insights
Drivers Impact Analysis of Sleep Apnea Devices Market*
| DRIVER | (~) % IMPACT ON CAGR FORECAST | GEOGRAPHIC RELEVANCE | IMPACT TIMELINE |
|---|---|---|---|
| Rising global OSAprevalence tied to obesity | 1.8% | Global, acute in North America & Middle East | Long term (≥ 4 years) |
| Expanded insurance coverage for PAP & oral appliances | 1.5% | North America & Europe, emerging in APAC | Medium term (2-4 years) |
| Technological advances in cloud-connected PAP & HST devices | 1.3% | Global, led by North America & Europe | Medium term (2-4 years) |
| Accelerated uptake of AI-driven adherence-coaching platforms | 1.0% | North America & Europe, pilot programs in APAC | Short term (≤ 2 years) |
| Corporate wellness programmes mandating workforce sleep apnea screening | 0.6% | North America, selective adoption in Europe | Medium term (2-4 years) |
| Post-recall supplier diversification accelerating emerging-brand adoption | 1.2% | Global, most pronounced in North America & Europe | Short term (≤ 2 years) |
| Source: Mordor Intelligence | |||
Rising Global OSA Prevalence Tied to Obesity
The United States counted about 61 million OSA cases in 2025 and is projected to reach 77 million by 2050, driven by population aging and better screening rather than obesity alone. Middle Eastern and North African nations display steeper curves as urban lifestyles and type 2 diabetes rates climb.[2]Source: U.S. Food and Drug Administration, “Medical Device Reports: Philips Respironics Recall,” fda.gov Obesity remains the strongest modifiable risk factor for obstructive sleep apnea (OSA), and epidemiologic curves for both conditions rise in tandem. In morbidly obese surgical candidates, OSA prevalence reaches 95% for body-mass-index levels above 60. Yet of the 30 million United States adults estimated to have sleep apnea, only 6 million carry a formal diagnosis. This latent clinical need underpins sustained demand for diagnostic devices, remote monitoring accessories, and long-term therapy solutions. Insurers increasingly acknowledge the downstream economic burden of untreated apnea, such as hypertension-related admissions, making coverage expansion politically and fiscally attractive.
Expanded Insurance Coverage for PAP & Oral Appliances
Reimbursement reforms now embrace a broader toolkit of treatments. In the United States, the Centers for Medicare & Medicaid Services reimburse continuous positive airway pressure (CPAP) initiated by either in-lab polysomnography or qualified home tests[3]Cigna, “Coverage Policy 057 Obstructive Sleep Apnea Treatment,” CIGNA.COM . Coverage further extends to oral appliances and hypoglossal-nerve stimulation when patients meet specific clinical criteria. Similar policy shifts in France, Germany, and Japan shorten payback periods for device purchases and elevate replacement cycles. Payers have also instituted adherence audits, tying continued rental payments to the upload of usage data, an arrangement that incentivizes connected hardware and software ecosystems.
Technological Advances in Cloud-Connected PAP & HST Devices
The FDA cleared ResMed’s Smart Comfort algorithm in December 2025, validating machine learning trained on 100 million therapy nights to auto-titrate in real time. Cloud telemetry converts devices into connected-health endpoints that drive software-as-a-service revenue through adherence dashboards and predictive maintenance. Device innovation has pivoted around three pillars: miniaturization, connectivity, and user comfort. ResMed reports more than 170 million cloud-connected patient profiles across its PAP fleet, enabling nightly data uploads and automated compliance coaching. Adaptive algorithms in advanced servo-ventilation units fine-tune pressure support breath by breath, reducing apnea-hypopnea indices by almost half compared with fixed-pressure CPAP. Home sleep-test sensors have shrunk to finger-tip form factors yet retain clinical-grade accuracy, as 2024 FDA clearances confirm. Together, these upgrades address historic adherence barriers and provide the objective metrics needed for value-based reimbursement.
Accelerated Uptake of AI-Driven Adherence-Coaching Platforms
Historical PAP abandonment exceeded 30 % in year 1, eroding DME returns under rental-to-purchase models. CMS added remote-patient-monitoring codes in 2024, allowing monthly billing for data review and virtual check-ins. Vendors embed behavioral-science nudges and gamified dashboards; the strategy both reduces churn and shifts adherence support from cost center to revenue stream. Inspire Medical Systems mirrored the approach by adding a companion app for its hypoglossal-nerve stimulator.
Restraints Impact Analysis of Sleep Apnea Devices Market*
| RESTRAINT | (~) % IMPACT ON CAGR FORECAST | GEOGRAPHIC RELEVANCE | IMPACT TIMELINE |
|---|---|---|---|
| Product recalls & safety concerns eroding patient trust | -1.2% | Global, most acute in North America | Short term (≤ 2 years) |
| Poor patient compliance & device abandonment | -0.9% | Global | Long term (≥ 4 years) |
| Tightened cybersecurity rules raising connected-device costs | -0.5% | North America & Europe | Medium term (2-4 years) |
| OTC wearable screeners cannibalising clinical device sales | -0.7% | North America, emerging in Europe & APAC | Medium term (2-4 years) |
| Source: Mordor Intelligence | |||
Product Recalls and Safety Concerns Undermining Patient Trust
The 2021-2024 Philips Respironics recall covering millions of CPAP, BiPAP, and ventilator units linked foam degradation to respiratory injuries and 560 deaths, according to FDA medical-device reports[4]FDA, “Medical Device Recall Database,” FDA.GOV. The Philips Respironics recall, initiated in June 2021 and escalating through 2024, removed millions of continuous positive-airway-pressure and bi-level positive-airway-pressure devices from service due to polyester-based polyurethane foam degradation that released particulates and volatile organic compounds into the airway, triggering the largest Class I recall in respiratory-device history. The recall's ripple effects extended beyond Philips; ResMed issued a voluntary recall of specific mask models in January 2024 due to magnet-related risks for patients with implanted cardiac devices, and heightened FDA scrutiny has lengthened premarket-review timelines for novel respiratory products. Patient advocacy groups report lingering anxiety about foam integrity and off-gassing, which has elevated demand for transparent material-sourcing disclosures and third-party testing certifications. Manufacturers are responding by migrating to silicone-based sound-attenuation materials and publishing detailed bills of materials, but rebuilding trust remains a multi-year endeavor that constrains premium pricing and complicates new-product launches.
Poor Patient Compliance & Device Abandonment
Continuous positive-airway-pressure therapy imposes a nightly ritual of donning a mask, tolerating pressurized air, and managing equipment maintenance that competes with ingrained sleep habits, and real-world adherence data consistently show that 25 to 35% of patients discontinue use within 12 months despite objective improvements in apnea-hypopnea index. Oral appliances offer a lower-burden alternative for mild-to-moderate obstructive sleep apnea. Yet, the American Academy of Sleep Medicine guidelines still position them as second-line therapy, limiting their uptake among patients who might tolerate them better than positive airway pressure devices.
*Our forecasts treat driver/restraint impacts as directional, not additive. The impact forecasts reflect baseline growth, mix effects, and variable interactions.
Sleep Apnea Devices Market Segment Analysis
By Type:
Diagnostic Surge Outpaces Therapeutic BaseDiagnostic devices are expanding at an 11.45% CAGR through 2031, nearly double the pace of the broader market, as payers tighten documentation requirements and home sleep-test kits displace costly in-lab polysomnography for uncomplicated obstructive sleep apnea cases. The American Academy of Sleep Medicine updated accreditation standards in January 2025 to recognize Type-3 and Type-4 devices that measure airflow, respiratory effort, oxygen saturation, and, in some cases, actigraphy as acceptable for moderate-to-high pretest-probability patients, thereby compressing diagnostic costs from approximately USD 2,000 per in-lab study to under USD 300 per home test. Polysomnography systems retain a role for complex cases involving central sleep apnea, periodic limb movement disorder, or suspected narcolepsy, but volume is migrating to ambulatory settings. Pulse oximeters and actigraphy wearables serve as screening tools rather than definitive diagnostics. Yet, their ubiquity in consumer wellness devices, Apple Watch Series 10 and Samsung Galaxy Watch, both received FDA clearance in 2024 for sleep-apnea notification, raises the prospect that millions of individuals will bypass clinical pathways entirely.
Therapeutic devices commanded 67.75% of market share in 2025, anchored by the installed base of continuous positive-airway-pressure, bi-level positive-airway-pressure, and automatic positive-airway-pressure systems that benefit from Medicare's 5-year replacement-useful-life standard. Positive-airway-pressure devices, subdivided into continuous, bi-level, and automatic variants, constitute the most significant therapeutic segment. Yet, differentiation has shifted from hardware ergonomics to cloud-connected personalization algorithms, such as ResMed's Smart Comfort, which received FDA clearance in December 2025 and leverages more than 100 million patient nights of data to auto-titrate pressure settings.


By End-User:
Home-Care Dominance Reflects Reimbursement and ConvenienceHome-care settings held 52.20% of the market share in 2025 and are forecast to grow at 7.20% annually through 2031, a trajectory shaped by Medicare's rental-to-purchase reimbursement structure, the proliferation of remote patient-monitoring codes, and patient preference for in-home therapy over facility-based care. Durable medical equipment providers have evolved from transactional device distributors into longitudinal care coordinators, embedding adherence-coaching platforms and Home sleep-test kits, which compress diagnostic costs from approximately USD 2,000 per in-lab study to under USD 300. These developments have accelerated the shift toward decentralized care pathways, enabling primary care physicians to order testing without a referral from a sleep specialist.
Hospitals retained a substantial share, driven by in-lab polysomnography for complex cases, surgical implantation of hypoglossal-nerve stimulation devices, and acute management of central sleep apnea in heart-failure populations.

Geography Analysis
North America Sleep Apnea Devices Market
North America commanded 41.56% of market share in 2025, anchored by entrenched Medicare and private-payer reimbursement pathways, a mature installed base exceeding 10 million active continuous positive-airway-pressure users, and the concentration of platform vendors ResMed, Philips, and Fisher & Paykel that dominate durable-medical-equipment supply chains. The FDA's consent decree against Philips in April 2024, which bars United States sales until the company demonstrates sustained compliance with quality-system regulations, accelerated market-share redistribution; Canada and Mexico exhibit slower growth due to smaller populations and less-developed home-care infrastructure, yet both markets are benefiting from cross-border durable-medical-equipment distribution and the expansion of private sleep clinics that bypass public-system wait times. The regulatory maturity of North America creates both stability and saturation; incremental growth hinges on replacement cycles, adherence improvements, and the penetration of high-margin alternatives such as hypoglossal-nerve stimulation, which expanded its addressable U.S. population to approximately 1.5 million after the FDA broadened indications to moderate obstructive sleep apnea in 2024.
APAC Sleep Apnea Devices Market
Asia Pacific is forecast to clock an 8.9% CAGR from 2025-2030, the fastest regional trajectory in the global Sleep Apnea Devices market. Prevalence data highlight substantial latent demand: systematic reviews peg adult OSA rates as high as 23.6% in China and suggest India may harbor more than 50 million affected adults. Diagnosis remains limited by physician awareness and the scarcity of sleep labs, but government insurance expansions in China and India are underwriting the adoption of portable HST kits. Multinational brands partner with respiratory-therapy chains and telehealth portals to deploy loaner CPAP programs that convert to household purchases once adherence is proven.

Competitive Landscape
The Sleep Apnea Devices market exhibits moderate concentration led by ResMed, Koninklijke Philips, and Fisher & Paykel Healthcare. Philips’ multi-year recall has propelled structural change: ResMed captured transitional demand by scaling production capacity and launching subsidies for replacement devices. Fisher & Paykel leveraged its humidification and interface expertise to win hospital tenders seeking safety-certified alternatives. Collectively, the top three firms account for an estimated 62% of 2025 revenue, while mid-tier contenders such as Inspire Medical Systems and Vivos Therapeutics carve specialized niches.
Strategic priorities have shifted from single-device sales to ecosystem control. ResMed’s Brightree and AirView platforms synchronize diagnostics, therapy, and billing workflows, earning recurring SaaS revenues and embedding the brand in provider operations. Fisher & Paykel accelerates interface innovation, evidenced by an August 2024 grant to develop a low-pressure nasal cannula optimized for night-time use. Inspire Medical Systems, meanwhile, commands the implantable neurostimulation segment after its next-generation device gained FDA approval in August 2024.
Competitive risk now also emanates from consumer-electronics firms. Samsung’s FDA-cleared sleep-apnea detection algorithm for its Galaxy Watch positions wearable screens as a first-touch diagnostic gateway. Although smartwatches do not replace confirmatory testing, they expand the referral pool and may divert data ownership away from legacy device manufacturers. Incumbents are therefore forging alliances with telehealth operators to lock in care-pathway integration, tie device financing to documented adherence, and secure de-identified datasets for machine-learning refinement.
Sleep Apnea Devices Industry Leaders
ResMed Inc.
Koninklijke Philips N.V.
Fisher & Paykel Healthcare Ltd.
Drive DeVilbiss Healthcare LLC
Inspire Medical Systems Inc.
- *Disclaimer: Major Players sorted in no particular order
Sleep Apnea Devices Market Companies Covered in this Report
- 3B Medical
- Apex Medical
- Asahi Kasei Corp. (ZOLL Medical)
- BMC Medical Co. Ltd.
- Braebon Medical Corp.
- Cadwell
- Compumedics Ltd.
- Drive DeVilbiss Healthcare
- Fisher & Paykel Healthcare
- Inspire Medical Systems
- Inspire Sleep (Hypoglossal Stim)
- Koninklijke Philips
- Lowenstein Medical GmbH
- Natus Medical
- Nihon Kohden
- Oventus Medical Ltd.
- React Health
- Resmed
- Samsung Electronics Co. Ltd. (Wearable Dx)
- SomnoMed Ltd.
- Teleflex
- Vivos Therapeutics Inc.
- Vyaire Medical
- Whole You Inc.

Recent Industry Developments in Sleep Apnea Devices Market
- April 2026: ProSomnus Sleep Technologies announced that it had received Class II 510(k) clearance from the U.S. Food and Drug Administration for its RPMO₂ OSA Device. The FDA clearance, under product codes DQA, LQZ, LRK, PLC, and OUG (FDA K252765), represented a key milestone. The device integrated oral appliance therapy for obstructive sleep apnea with advanced physiologic monitoring capabilities.
- December 2025: ResMed secured FDA 510(k) clearance for its Smart Comfort algorithm, trained on 100 million patient nights, to auto-adjust PAP settings, enabling remote optimization via myAir and AirView.
- August 2025: Nyxoah obtained FDA approval for its Genio bilateral neuro-stimulation system for moderate-to-severe OSA with AHI 15-65.
- April 2025: ResMed launched NightOwl, an FDA-cleared HST kit now available across the United States.


Sleep Apnea Devices Market Report Scope and Research Methodology
Market Definition and Coverage
According to Mordor Intelligence, the sleep apnea devices market encompasses regulated diagnostic equipment (polysomnography systems, home sleep test kits, oximeters) and therapeutic hardware such as positive airway pressure systems, adaptive servo-ventilation units, and related patient interfaces that are sold new for managing obstructive, central, or complex sleep apnea in hospitals, sleep laboratories, and home-care settings worldwide.
Scope Exclusions: The study omits retail dental oral appliances and consumer sleep-tracking mobile apps lacking regulatory approval.
Segments Covered in This Report
- By Type
- Diagnostic Devices
- Polysomnography Systems (In-Lab PSG)
- Home Sleep Test Kits (Type-3/4)
- Pulse Oximeters
- Actigraphy Wearables
- Others
- Therapeutic Devices
- Positive Airway Pressure (PAP) Devices
- Continuous PAP (CPAP)
- Bi-level PAP (BiPAP)
- Automatic PAP (Auto-PAP)
- Adaptive Servo-Ventilation (ASV)
- Oral Appliances
- Hypoglossal-Nerve Stimulation Implants
- Oxygen Therapy Devices
- Stationary Oxygen Concentrators
- Portable Oxygen Concentrators
- Airway-Clearance Systems
- Nasal & Full-face Masks
- Accessories & Consumables
- Positive Airway Pressure (PAP) Devices
- Diagnostic Devices
- By End-User
- Hospitals
- Home-care Settings
- Ambulatory Surgical & Specialty Clinics
- Others
- By Geography
- North America
- United States
- Canada
- Mexico
- Europe
- Germany
- United Kingdom
- France
- Italy
- Spain
- Rest of Europe
- Asia-Pacific
- China
- India
- Japan
- Australia
- South Korea
- Rest of Asia-Pacific
- Middle East and Africa
- GCC
- South Africa
- Rest of Middle East and Africa
- South America
- Brazil
- Argentina
- Rest of South America
- North America
Data Sources, Market Sizing, and Validation
Primary Research
Mordor analysts interviewed respiratory therapists, biomedical engineers, reimbursement specialists, and procurement managers across North America, Europe, and Asia Pacific. These conversations tested prevalence assumptions, PAP adherence rates, diagnostic wait times, and masked price discounts, helping us reconcile secondary inputs and fine-tune regional growth drivers.
Desk Research
We began with publicly available datasets from the World Health Organization, the American Academy of Sleep Medicine, the European Respiratory Society, and national health ministries to map diagnosed prevalence, procedure volumes, and reimbursement policies across 17 key countries. Trade flows and import duties were traced through UN Comtrade, while device recall and approval histories were pulled from the US FDA 510(k) database and the EU MDR portal to time-stamp market inflection points.
Company filings, investor presentations, and curated news archives on Dow Jones Factiva enriched pricing and competitive intelligence, and D&B Hoovers supplied revenue splits that grounded average selling price (ASP) assumptions. Questel patent analytics flagged emerging sub-technologies, signaling future demand pockets. This list is illustrative; many additional open-source and subscription references informed data gathering, validation, and clarifications.
Market-Sizing & Forecasting
A top-down model starts with country-level obstructive sleep apnea prevalence, diagnosis rates, and therapy penetration; these pools are converted to unit demand through sleep lab capacity, PAP replacement cycles, and mask reorder ratios. Supplier roll-ups and channel checks act as selective bottom-up approximations to validate totals and adjust outliers. Key variables like obesity incidence, per-capita healthcare spend, reimbursement coverage for HST, and new sleep lab openings drive volume forecasts, while ASP trajectories reflect recall-driven supply shifts and component cost trends. Multivariate regression projects 2026-2030 values, with scenario analysis stress-testing reimbursement and adherence swings. Gaps in bottom-up inputs are bridged by triangulating proxy metrics, for instance, ventilator shipments or CPAP import data.
Data Validation & Update Cycle
Before sign-off, our model passes variance checks against independent prevalence studies and shipment trackers; anomalies trigger re-contact of subject-matter experts. Reports refresh annually, and interim updates are issued when recalls, regulatory rulings, or reimbursement changes materially alter the outlook.
How Mordor Intelligence's Sleep Apnea Devices Market Size Compares to Other Published Estimates
Published estimates often diverge; differences in product scope, patient cohorts, and forecast cadence typically explain the gap. We anchor our baseline on device-only revenues, a balanced prevalence scenario, and yearly refreshes that capture recalls and reimbursement shifts.
Key gap drivers include rival studies adding dental appliances or service contracts, using aggressive prevalence multipliers, freezing exchange rates, or projecting with unvalidated linear growth. Mordor's definition, variable mix, and yearly audits narrow these variances.
Benchmark comparison
| Market Size | Anonymized source | Primary gap driver |
|---|---|---|
| USD 8.79 billion (2025) | Mordor Intelligence | |
| USD 9.70 billion (2024) | Global Consultancy A | Includes service revenues and oral appliances alongside core devices |
| USD 6.90 billion (2025) | Industry Association B | Omits diagnostic PSG systems and applies conservative prevalence rates |
| USD 7.60 billion (2025) | Trade Journal C | Relies on historical shipment data without adjusting recent recall-driven inventory swings |
Our comparison shows that when scope and variables are aligned, our balanced, transparent approach offers decision-makers the most dependable global baseline.


Key Questions Answered in the Report
How big is the Sleep Apnea Devices Market?
The Sleep Apnea Devices Market size is expected to reach USD 9.43 billion in 2026 and grow at a CAGR of 7.33% to reach USD 13.43 billion by 2031.
What is the current Sleep Apnea Devices Market size?
In 2025, the Sleep Apnea Devices Market size is expected to reach USD 8.79 billion.
Who are the key players in Sleep Apnea Devices Market?
Fisher & Paykel Healthcare Limited, Koninklijke Philips NV, Invacare Corporation, Resmed and Natus Medical Incorporated are the major companies operating in the Sleep Apnea Devices Market.
Which is the fastest growing region in Sleep Apnea Devices Market?
Asia Pacific is estimated to grow at the highest CAGR over the forecast period (2026-2031).
Which region has the biggest share in Sleep Apnea Devices Market?
In 2025, the North America accounts for the largest market share in Sleep Apnea Devices Market.
Page last updated on:


