
Production Monitoring Market Size and Share
Market Overview
| Study Period | 2020 - 2031 |
|---|---|
| Market Size (2026) | USD 7.03 Billion |
| Market Size (2031) | USD 10.63 Billion |
| Growth Rate (2026 - 2031) | 8.62 % |
| Fastest Growing Market | Middle East and Africa |
| Largest Market | Asia Pacific |
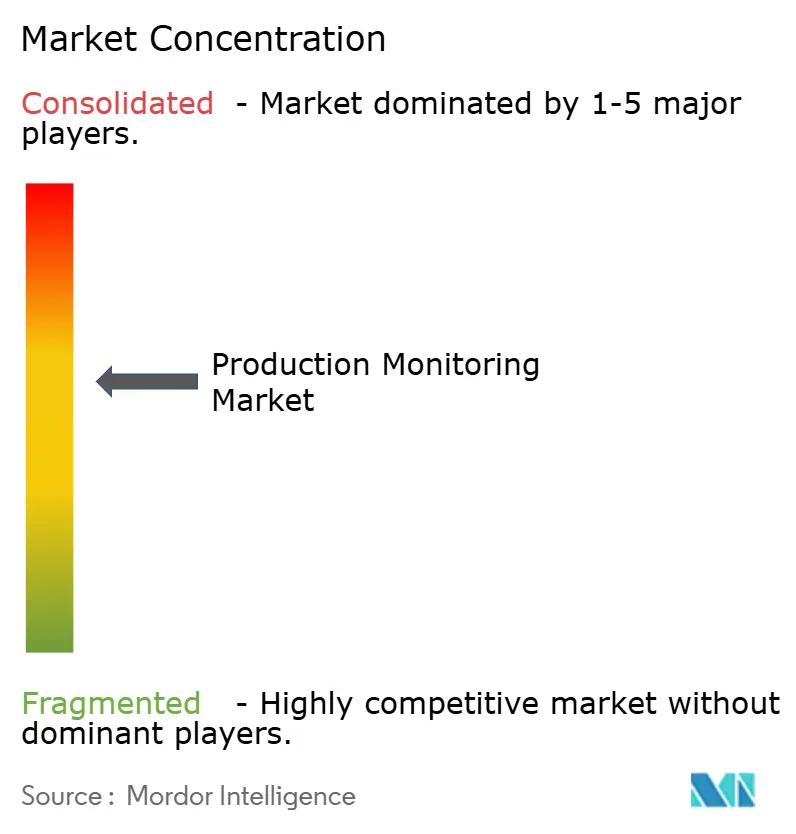
| Market Concentration | Medium |
Major Players
*Disclaimer: Major Players sorted in no particular order Image © Mordor Intelligence. Reuse requires attribution under CC BY 4.0. |
|
Production Monitoring Market Analysis by Mordor Intelligence
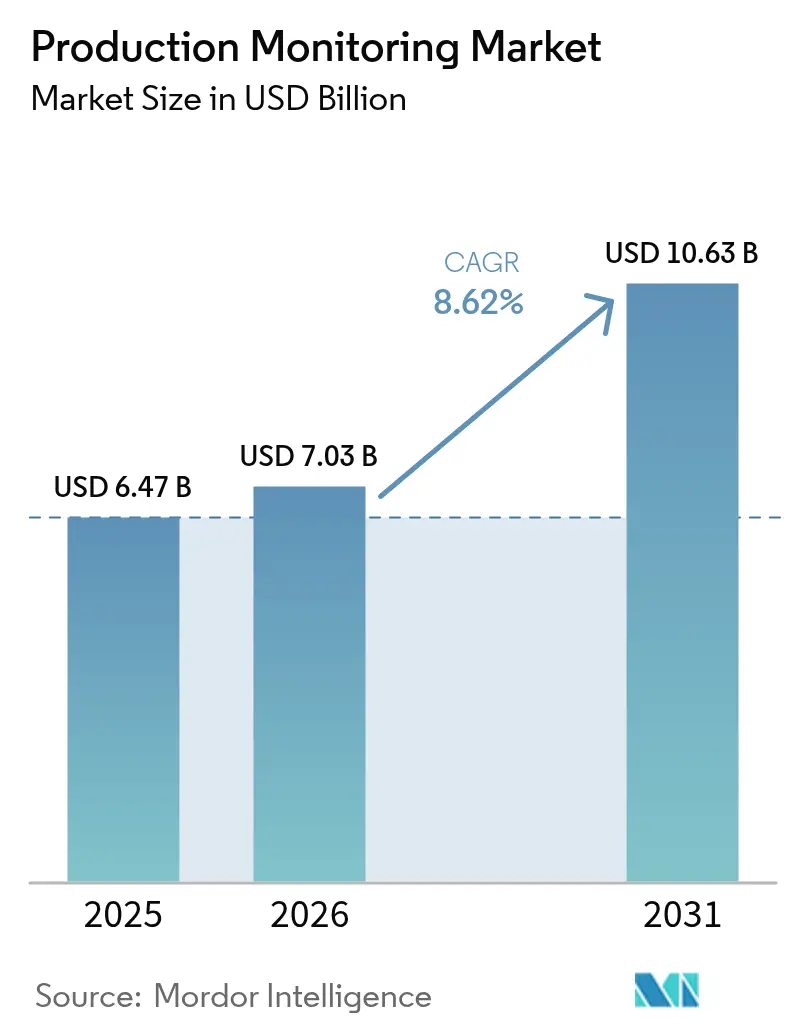
The Production monitoring market size was valued at USD 6.47 billion in 2025 and estimated to grow from USD 7.03 billion in 2026 to reach USD 10.63 billion by 2031, at a CAGR of 8.62% during the forecast period (2026-2031). The Production monitoring market is expanding because manufacturers are aligning Industry 4.0 roadmaps with corporate productivity goals, rolling out IIoT architectures, and prioritizing predictive maintenance over reactive repairs. Cloud-first deployments continue to attract investment because they scale analytics and lower upfront hardware costs, while edge-AI installations give plant managers instant insights at the machine level. Automotive and high-compliance verticals such as pharmaceuticals remain early adopters, but food, energy, and discrete electronics plants are fast closing the gap as regulatory reporting and traceability mandates tighten. Competitive intensity is rising as incumbent automation vendors pivot from hardware bundles to software-centric service models and specialized AI companies enter with anomaly-detection algorithms that reduce downtime.
Key Report Takeaways
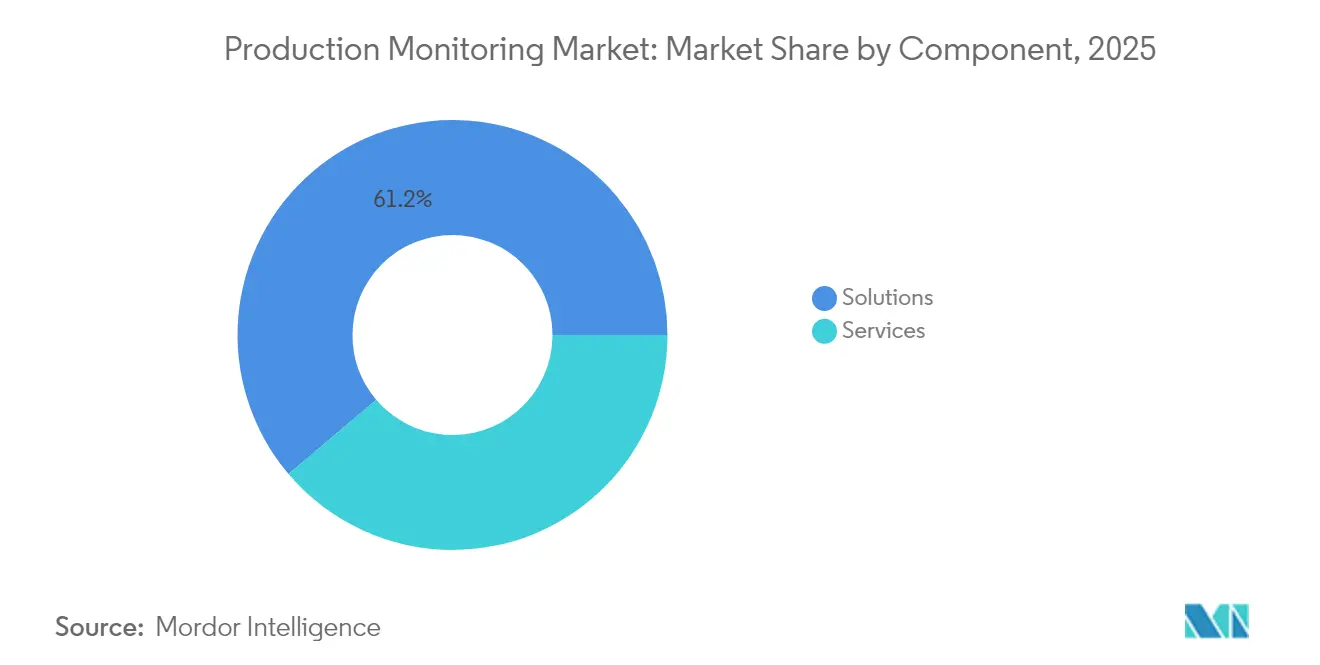
- By component, Solutions held 61.20% of the Production monitoring market share in 2025; Services is projected to compound at a 9.62% CAGR to 2031.
- By deployment, cloud models accounted for 57.40% of the Production monitoring market size in 2025 and are expanding at a 9.31% CAGR through 2031.
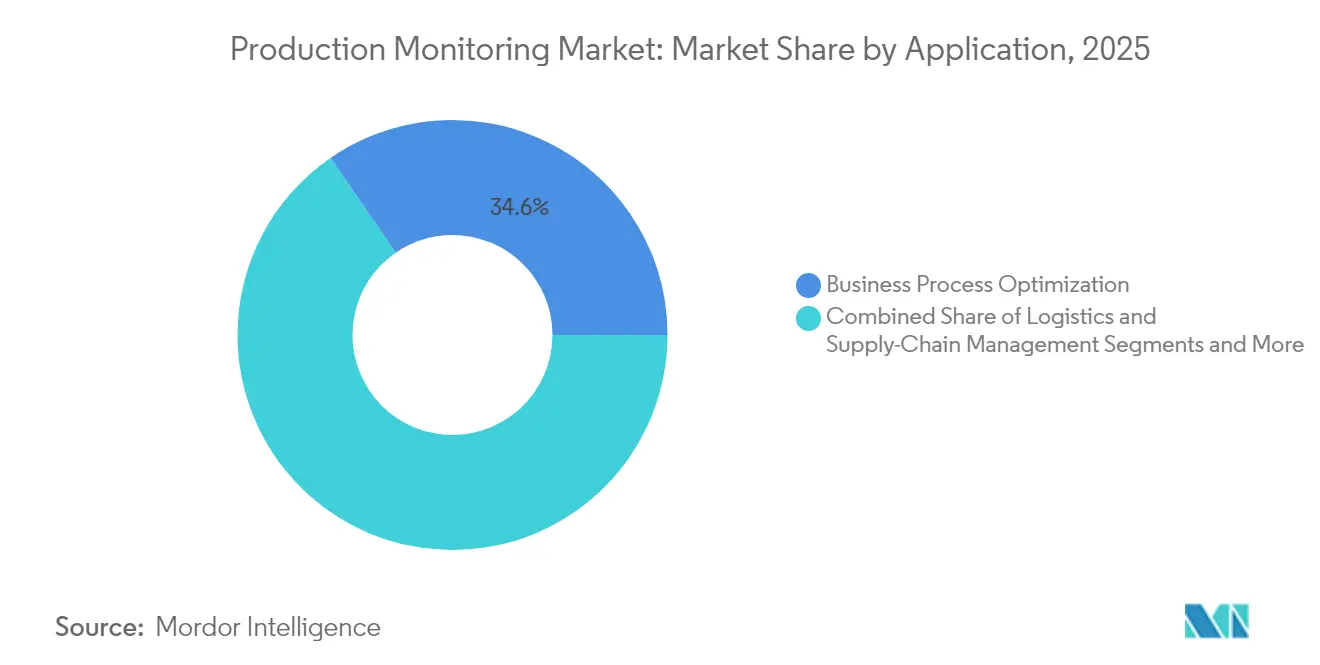
- By application, business process optimization accounted for 34.60% of the Production monitoring market size in 2025; edge-AI anomaly detection leads growth at 9.01% CAGR to 2031.
- By end user, the automotive sector led with a 21.70% Production monitoring market share in 2025, while healthcare and life sciences is advancing at a 9.78% CAGR to 2031.
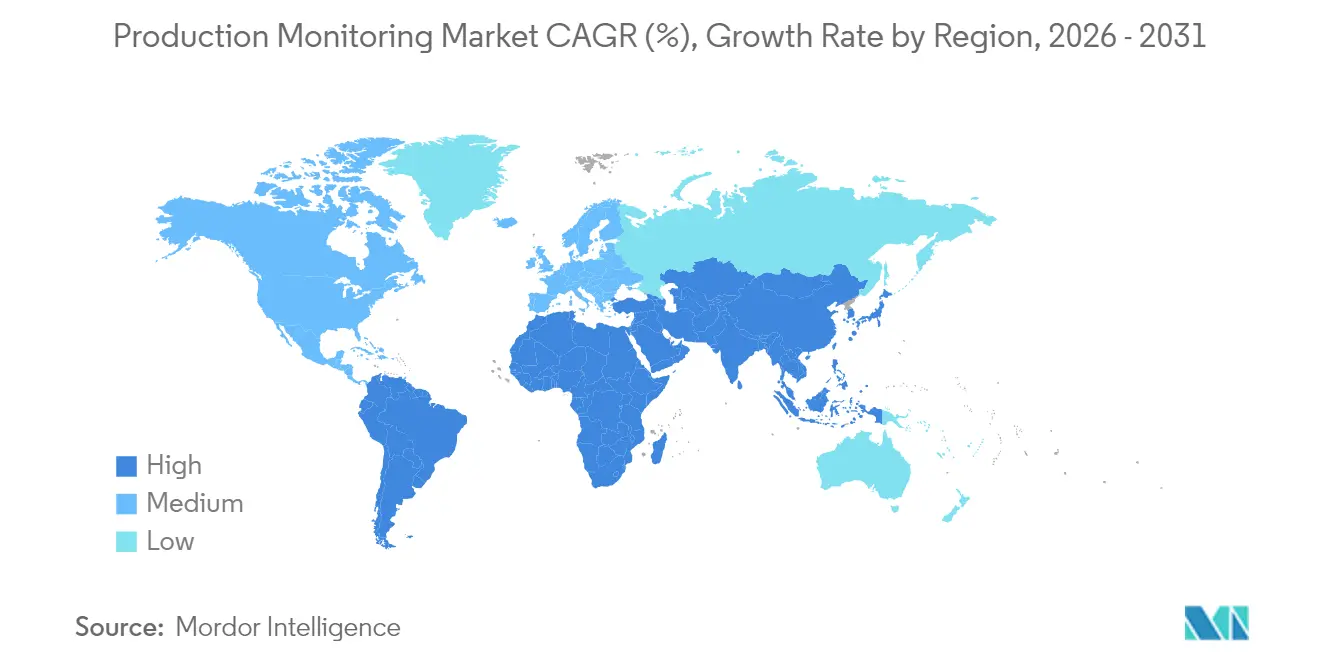
- By geography, Asia-Pacific commanded 33.70% of the Production monitoring market in 2025; the Middle East and Africa region is forecast to grow at a 10.34% CAGR between 2026 and 2031.
Note: Market size and forecast figures in this report are generated using Mordor Intelligence’s proprietary estimation framework, updated with the latest available data and insights as of 2026.
Global Production Monitoring Market Trends and Insights
Drivers Impact Analysis*
| Driver | (~) % Impact on CAGR Forecast | Geographic Relevance | Impact Timeline |
|---|---|---|---|
| Demand for centralized monitoring and predictive maintenance | +2.8% | Global, early gains in Asia-Pacific hubs | Medium term (2-4 years) |
| Adoption of IIoT platforms for real-time visibility | +2.1% | North America & EU leading, Asia-Pacific rapid uptake | Short term (≤ 2 years) |
| Expansion of Industry 4.0 smart-factory initiatives | +1.9% | Asia-Pacific core, spill-over to Middle East & Africa | Medium term (2-4 years) |
| Edge-AI deployment for anomaly detection | +1.6% | Global, concentrated in automotive and oil & gas | Long term (≥ 4 years) |
| Regulatory push for energy-efficiency disclosures | +1.2% | EU and North America, expanding to Asia-Pacific | Medium term (2-4 years) |
| Growth of green-production certification tracking | +0.8% | Global, emphasis on developed markets | Long term (≥ 4 years) |
| Source: Mordor Intelligence | |||
Demand for Centralized Monitoring and Predictive Maintenance
Manufacturers are consolidating asset data across plants to create single sources of truth that feed AI maintenance models. Zebra Technologies reported that only 16% of producers had real-time shop-floor visibility in 2024, exposing a sizeable performance gap. Automotive groups adopting predictive analytics reduced unplanned breakdowns by up to 70% and unlocked USD 100 million in lifetime equipment value by optimizing edge infrastructure. Production managers therefore view predictive maintenance as a profit lever, not merely a cost-avoidance tool, elevating demand for platforms that integrate vibration, temperature, and pressure data into actionable health scores.
Adoption of IIoT Platforms for Real-Time Visibility
IIoT suites now orchestrate machines, workers, and logistics streams in a single digital fabric. A 5G rollout at Midea Thailand delivered 15–20% productivity gains by unifying robotics and AI inspection flows. Sensor modules such as TDK’s i3 Micro integrate multi-modal data in a postage-stamp form factor, enabling brownfield sites to join data lakes without heavy retrofits. Tier-two suppliers benefit because cloud edge gateways compress deployment costs, lowering barriers to entry in the Production monitoring market.
Expansion of Industry 4.0 Smart-Factory Initiatives
Smart-factory programmes have moved beyond pilots into strategic portfolio investments. Siemens’ MACHINUM platform links machine-tool controls with adaptive feed-rate algorithms that trim downtime and energy waste. Precision manufacturers in Japan improved machine utilisation by 20% and cut scrap by 25% after linking IoT devices to digital twins, demonstrating tangible ROI that encourages further adoption. [1]Manufacturing Tomorrow, "IoT in Manufacturing: Advanced Precision as a Promising Trend for 2025," manufacturingtomorrow.com
Edge-AI Deployment for Anomaly Detection
Edge-AI pushes inferencing to microcontrollers embedded on the line, reducing latency and bandwidth needs. STMicroelectronics and SMRI used on-chip models to predict bearing failures before catastrophic damage, safeguarding uptime while keeping data on-premise for security. [2]STMicroelectronics, "AI Solution for Failure Prediction," st.comRockwell Automation’s GuardianAI updates existing drives with analytics overlays, proving that performance lifts are attainable without bolt-on sensors.
Restraints Impact Analysis*
| Restraint | (~) % Impact on CAGR Forecast | Geographic Relevance | Impact Timeline |
|---|---|---|---|
| Data-security and privacy concerns | −1.8% | Global, heightened in EU & North America | Short term (≤ 2 years) |
| High upfront integration costs | −1.5% | Global, impacting SMEs in developing markets | Medium term (2-4 years) |
| OT-protocol heterogeneity in legacy assets | −1.2% | Global, established plants | Long term (≥ 4 years) |
| Shortage of OT-cybersecurity talent | −0.9% | Global, acute in Asia-Pacific & MEA | Medium term (2-4 years) |
| Source: Mordor Intelligence | |||
Data-Security and Privacy Concerns
Connected factories widen the attack surface. The 2024 VOID Report showed that automated systems can amplify incidents when mis-configured, forcing operators to intervene manually.[3]VOID Community, "2024 VOID Report VOID Community," thevoid.communityEU manufacturers must now comply with stringent data-governance rules, driving interest in blockchain-based traceability that preserves transparency while hardening privacy.
High Upfront Integration Costs
Full-scale roll-outs strain capital budgets, especially for SMEs that still rely on analogue controls. Cloud subscriptions alleviate hardware expenditures, yet integration services remain essential to harmonise proprietary protocols. Siemens’ Simatic Automation Workstation displaces hardware PLCs with software images, creating a migration path that spreads spend over time. Financing bottlenecks persist in emerging markets where energy costs and credit access deter quick payback cycles.
*Our forecasts treat driver/restraint impacts as directional, not additive. The impact forecasts reflect baseline growth, mix effects, and variable interactions.
Segment Analysis
By Component: Services Gain Momentum Amid OT-IT Complexity
Solutions captured 61.20% of the Production monitoring market in 2025, reflecting entrenched hardware and platform sales. Services, however, will expand faster at 9.62% CAGR to 2031 as organisations confront protocol heterogeneity and workforce skill gaps. Emerson’s DeltaV update illustrates why: the feature pack lets utilities migrate from third-party controls while retaining legacy I/O, yet successful adoption hinges on specialist integrators who re-map tags and validate safety logic. Managed analytics and continuous optimisation contracts therefore secure recurring revenue streams for vendors and enable plant teams to scale expertise without large hiring drives.
At the same time, advisory partners now bundle change-management playbooks with technical deployments. Clients realise that organisational workflows must evolve to exploit AI insights, not simply display dashboards. This services-first mind-set reinforces a virtuous circle where solution providers embed deeper in customer operations, enlarging lifetime value in the Production monitoring market.



By Deployment: Cloud Extends Lead While Hybrid Models Balance Control
Cloud options held 57.40% of the Production monitoring market in 2025, advancing at a 9.31% CAGR as manufacturers favour elastic compute and rapid model updates. Microsoft showcases how cloud analytics decodes energy patterns to lower carbon footprints and sharpen regulatory reporting microsoft.com. Yet data-sovereignty and latency‐critical tasks keep on-premise estates relevant, especially in defense and utilities where command-and-control must function under air-gapped conditions. Hybrid frameworks emerge as the governance compromise: sensitive control loops stay local, while AI-heavy workloads offload to hyperscale resources. Emerson’s Ovation 4.0 wraps generative AI inside such an architecture, giving operators cloud-grade insights without sacrificing cybersecurity standards.
Enterprises also exploit pay-as-you-go OPEX models to prototype niche use cases, then scale proven blueprints across plants. That agility accelerates digital-transformation timelines and cements cloud’s role as the default innovation sandbox for the Production monitoring market.
By Application: Process Optimization Anchors Spend; Edge Anomaly Detection Scales Fast
Business process optimisation commanded 34.60% of the Production monitoring market size in 2025, underlining management’s focus on throughput and inventory turns. Real-time dashboards link takt-time deviations to scheduling engines, exposing bottlenecks that planners can rectify before they snowball into backlogs. Emergency and incident management solutions win board-level attention after high-profile industrial fires. The US Homeland Security roadmap identified 13 AI technologies primed to modernise crisis response, positioning production-monitoring vendors for cross-domain expansion.
Edge-AI anomaly detection represents the fastest-rising application at 9.01% CAGR. Early adopters see immediate ROI by catching bearing wear or motor imbalance during micro-second windows that traditional SCADA polling misses. Logistics-tracking modules round out demand because pandemic disruptions proved that visibility gaps directly threaten service levels. Half of food-and-beverage companies plan to fit supply-chain tracking systems by 2025, inserting new endpoints into the Production monitoring market.
By End User: Automotive Sets the Pace; Healthcare Outpaces Growth
Automotive plants accounted for 21.70% Production monitoring market share in 2025. EV production lines deploy AI vision to validate battery welds and barcode systems to authenticate components, reducing recall. Predictive maintenance platforms trim downtime on paint lines where every minute lost equates to high scrap costs.
Healthcare and life sciences exhibit the steepest trajectory at 9.78% CAGR. Stringent validation rules demand traceable batch histories that production-monitoring suites generate automatically. Digital pill tracking and real-time environmental monitoring support compliance as Healthcare 4.0 moves from concept to standard practice mdpi.com. Oil and gas operators apply autonomous distillation controls, while chemical, power, food, and aerospace users adopt digital twins to hedge against volatility and regulatory audits. These vertical expansions reinforce the addressable base for the Production monitoring market.
Geography Analysis
Asia-Pacific held 33.70% of the Production monitoring market in 2025. China scales Industry 4.0 statewide, and India’s incentive programmes underwrite smart-factory deployments despite infrastructure gaps. LG Electronics’ vision for multi-trillion KRW enterprise value by 2030 exemplifies corporate ambition to embed AI across assembly cells. ASEAN plants leverage 5G private networks to automate material flow, gaining double-digit yield lifts.
The Middle East and Africa lead growth prospects at 10.34% CAGR. Saudi Arabia’s SAR 90 billion (USD 24 billion) manufacturing push includes smart food-processing clusters that rely on continuous monitoring to certify output quality. South Africa’s digitalisation events promote transparent and flexible production, but power constraints and financing hurdles moderate rollout speed.
North America and Europe remain technology bellwethers. The EU Corporate Sustainability Reporting Directive obliges automated energy metering, prompting investments in carbon-tracking dashboards. North American executives prioritise workforce reskilling; 73% plan upskilling programmes to turn data into decisions. These dynamics ensure a steady baseline of demand even as emerging economies surge.

Regulatory Landscape
Production monitoring deployments face tighter horizontal rules on AI governance, cybersecurity, and data handling that shape how shop-floor telemetry is collected, processed, and audited across jurisdictions. In Europe, the European Commission proposed the Digital Networks Act in 2026 to harmonize connectivity rules across the EU, while standards bodies such as ETSI published TS 104 008 in 2026, defining Continuous Auditing-Based Conformity Assessment (CABCA) for AI-enabled systems. This framework aligns with always-on monitoring, model updates, and lifecycle compliance needs in industrial analytics stacks.
Regulatory approaches also remain fragmented by region and sector, which raises compliance work for global manufacturers running mixed cloud and edge architectures. Thailand's National Broadcasting and Telecommunications Commission (NBTC) issued AI guidelines for telecommunications services in July 2026 using a risk-based governance lens, and China issued R&D ethics guidance in 2026 through its Ministry of Science and Technology, focused on ethical review mechanisms and algorithmic transparency for automation-related systems. Separately, national implementation measures continue to emerge, including Hungary's Act LXXV of 2025 tied to EU AI Act enforcement with a sandbox mechanism effective through August 2026, and the United Kingdom's Data (Use and Access) Act 2025 affecting automated decision-making practices that can extend to AI-enabled production oversight workflows.
Value Chain Analysis
The value chain spans sensing and instrumentation (vibration, temperature, pressure, vision, and power-quality), edge compute and industrial PCs, connectivity and gateways, and the software layer (SCADA/MES connectors, IIoT platforms, analytics, digital twins, and APM/predictive maintenance), followed by systems integration and managed services. Automation majors and platform vendors monetize the installed base via subscriptions, model tuning, and continuous optimization contracts, while integrators and OT cybersecurity specialists de-risk deployments by mapping legacy tags, hardening networks, and validating safety logic across heterogeneous protocols.
Recent partnerships also point to stronger convergence between engineering data, operations data, and supply-chain context, moving beyond isolated dashboards toward closed-loop decisions. Siemens announced partnerships in 2026 that connect industrial AI and digital-twin capabilities to execution layers, including its June 2026 strategic partnership with IFS to link engineering intelligence with operational reality and its April 2026 strategic partnership with KION to digitalize intralogistics using AI and digital twin simulation (including KION as a first European user of Siemens Digital Twin Composer). Upstream ecosystems are similarly pushing unified operational visibility: Cognite launched an Integrated Supply Chain offering in June 2026 with partners such as Deloitte and FourKites, while T-Systems and SupplyOn announced a June 2026 collaboration to link the SupplyOn platform with the T-Systems Industrial AI Cloud to support sovereign European supply chain automation, reinforcing data-sovereignty as a design constraint for production-monitoring architectures.
Competitive Landscape
The Production monitoring market shows moderate concentration. Global automation majors retain scale advantages through installed bases and lifecycle services, yet software-native entrants capture share in AI niches. Siemens pivots toward platform economics with MACHINUM and the software-only Simatic Workstation, cutting hardware lock-in and accelerating changeovers. Emerson layers generative AI onto Ovation 4.0, using data federation to differentiate in power and water markets.
Strategic alliances proliferate as vendors partner with hyperscalers to embed analytics at the edge while leveraging cloud compute for model training. M&A deals target data-ops and cybersecurity startups to patch capability gaps. White-space remains in emergency-management overlays where incumbents lack domain depth, inviting specialists to stake positions. Price competition shifts from hardware margins to value-based service contracts, reshaping profitability drivers across the Production monitoring market.
Production Monitoring Industry Leaders
-
Capgemini SE
-
Siemens AG
-
Emerson Electric Co.
-
Rockwell Automation Inc.
-
New Relic Inc.
- *Disclaimer: Major Players sorted in no particular order

Market Opportunities and Future Outlook
A major opportunity is in production monitoring stacks that operationalize continuous compliance and auditability alongside performance KPIs, especially where AI is embedded into decision loops. ETSI TS 104 008 (2026) formalizes continuous auditing-based conformity assessment for AI-enabled systems, which aligns with automated evidence capture (data lineage, model changes, and control actions) inside production monitoring platforms. Vendors that bundle monitoring with governance tooling and ready-to-implement templates for regulated operations (for example, batch traceability in life sciences and energy-efficiency disclosures in Europe) can improve enterprise adoption as plants standardize across sites.
Another whitespace is closed-loop, edge-to-cloud execution that keeps operating during connectivity loss while still feeding centralized analytics and optimization. Rockwell Automation's June 2026 launch of FactoryTalk ResilientEdge and Emerson's May 2026 partnership with SiMa.ai for Physical AI intelligence on the industrial edge reflect active investment in autonomous, real-time analysis patterns that support predictive maintenance and anomaly detection. As manufacturers keep expanding cloud-first deployments for scalable analytics while preserving on-premise control for latency and sovereignty, hybrid reference architectures, edge AI overlays on legacy assets, and service-led rollouts (integration, OT security, and managed optimization) provide concrete commercialization paths for both incumbents and specialists.
Recent Industry Developments
- June 2026: Rockwell Automation introduced FactoryTalk ResilientEdge to unify edge and cloud execution for autonomous, scalable manufacturing operations. The platform focus on resilient operations supports continuous production monitoring even when connectivity is intermittent, reinforcing hybrid deployments that keep control logic local while synchronizing analytics to the cloud.
- May 2026: Emerson partnered with SiMa.ai to deliver Physical AI intelligence for real-time edge analysis on industrial PCs. The collaboration targets low-latency inference and on-premises analytics, strengthening production monitoring use cases such as anomaly detection and predictive maintenance while addressing data-sovereignty and security constraints.
- April 2026: Siemens expanded its Industrial Edge ecosystem to support decentralized SCADA applications and bidirectional data flow between edge and central systems. The move broadens how production monitoring can be deployed across distributed plants and lines, enabling faster rollouts of machine-level insights without relying solely on centralized architectures.


Research Methodology Framework and Report Scope
Market Definition and Coverage
For this methodology, the production monitoring market covers solutions and related services used to track, visualize, and improve manufacturing and industrial production performance in near real time, across on-premise and cloud deployments. Revenues are counted as vendor income from these offerings, across relevant end users.
Scope exclusions: We do not count general-purpose enterprise software that is not used for production monitoring use cases, nor stand-alone factory hardware unless it is bundled with, or required for, the monitoring solution delivery.
Segmentation Overview
-
By Component
- Solutions
- Services
-
By Deployment
- Cloud
- On-Premise
-
By Application
- Business Process Optimization
- Logistics and Supply-Chain Management
- Emergency and Incident Management
- Automation and Control Management
-
By End User
- Oil and Gas
- Chemical
- Automotive
- Energy and Power
- Food and Beverage
- Aerospace and Defense
- Healthcare and Life Sciences
- Others
-
By Geography
-
North America
- United States
- Canada
- Mexico
-
South America
- Brazil
- Argentina
- Rest of South America
-
Europe
- Germany
- United Kingdom
- France
- Italy
- Spain
- Russia
- Rest of Europe
-
Asia Pacific
- China
- India
- Japan
- South Korea
- Australia and New Zealand
- ASEAN-5
- Rest of Asia Pacific
-
Middle East and Africa
-
Middle East
- GCC Countries
- Turkey
- Rest of Middle East
-
Africa
- South Africa
- Nigeria
- Egypt
- Rest of Africa
-
Middle East
-
North America
Data Sources, Market Sizing, and Validation
Desk Research
Desk research was used to set the market boundaries, align terminology, and build a first view of demand by industry and region. We referred to public sources such as the US Census Bureau manufacturing data, Bureau of Labor Statistics productivity series, Eurostat industrial production indicators, UN Comtrade trade flows for relevant industrial automation categories, and NIST publications on smart manufacturing and interoperability.
To keep the model practical, we also reviewed public company filings, earnings transcripts, product documentation, and investor presentations to map solution and service revenue logic. Select paid subscriptions were used only for company financials and news screening, along with a patent database to identify where production analytics and monitoring capabilities are being developed. These sources are illustrative and not exhaustive, and many other public and paid references were used for data collection, validation, and clarification.
Primary Interviews and Surveys
Primary work helped test the desk-based assumptions and refine the model to what buyers and suppliers describe in practice. We spoke with solution providers, system integrators, and end-user operations and IT teams across APAC, EMEA, and the Americas to confirm adoption timing, typical deal structures, and how cloud versus on-premise rollouts are budgeted.
Distribution of primary research fieldwork respondents
| Company type | Respondent position | Region |
|---|---|---|
| Top tier: 38% | CXOs: 12% | APAC: 52% |
| Mid tier: 48% | Functional/Unit leaders: 29% | EMEA: 30% |
| Smaller Players: 14% | Managers: 59% | Americas: 18% |
Market-Sizing & Forecasting
Sizing starts from a top-down demand pool build that links industrial production activity to spend that typically goes into production visibility and control. For each major region and end-user set, we used indicators such as industrial production index trends, manufacturing value added, plant digitalization pace, cloud adoption in industrial software, and typical software plus services splits to construct a reasonable spend envelope.
Those totals were then corroborated with selective bottom-up checks, such as sampled vendor revenue attribution, channel feedback on deal sizes, and a simple ASP times volume logic for common subscription and services bundles. When direct revenue splits were not disclosed, the gap was handled using proxy ratios from similar solution lines, and the assumptions were re-tested through interviews before being carried into the final rollup.
For forecasting, we relied mainly on multivariate regression supported by scenario checks, since growth depends on multiple moving parts rather than a single time trend. Variables like capacity additions, automation investment cycles, and cloud migration timing were projected using public series and then reviewed with practitioners, which helped keep the forward view realistic rather than overly optimistic.
Data Validation & Update Cycle
Validation is done through multiple checks so the final number stays consistent with real-world signals. We compare outputs against independent indicators like manufacturing software spending direction, deployment mix shifts, and region-level industrial production movements, and then we review outliers that show sharp jumps or implausible regional shares.
Before sign-off, the model goes through step-by-step analyst reviews, and follow-up calls are triggered when a key assumption changes, such as a major pricing shift or a sudden change in deployment preference. The report is refreshed annually, and interim updates are made when material events occur. Right before delivery, a final pass is completed so clients receive the latest updated view.
Mordor Intelligence's Production Monitoring Market Size Measured Against Other Published Estimates
Published market sizes for production monitoring often differ because companies draw the line around what counts as a monitoring solution, how they treat services, and which year they call the base. The year range used in the forecast, currency timing, and how cloud subscriptions are annualized also create visible spread in reported values.
The table points to a clear gap between 2025 and 2024 baselines and to differences in what is included as production monitoring spend. In Mordor Intelligence's model, the 2025 value is built around production monitoring solutions plus services across cloud and on-premise deployments, and adjacent categories that do not directly support monitoring use cases are kept out even if they sit inside broader manufacturing software budgets.
Benchmark comparison
| Source | Market Size | Gaps in Research Methodology |
|---|---|---|
| Mordor Intelligence | USD 6.47 B (2025) | |
| Industry Data Publisher A | USD 5.58 B (2024) | Uses a 2024 base and often leans on enterprise-size segmentation, which can undercount services-heavy rollouts in process industries and can differ in how subscription revenue is annualized across deployment types. |
| Market Compilation B | USD 5.99 B (2025) | Stated base-year framing and a longer forecast window are used, with lighter transparency on how solutions versus services are split, which can shift totals depending on the assumed services attach rate and renewal pattern. |
Taken together, the spread is mostly explained by base-year choice and by whether the estimate fully separates production monitoring use cases from broader operations software. By keeping the model tied to observable industrial activity indicators and then cross-checking with interview-led deal and deployment realities, the final number stays traceable and repeatable for planning.


Key Questions Answered in the Report
What is the current size of the Production monitoring market?
The Production monitoring market size reached USD 7.03 billion in 2026 and is forecast to hit USD 10.63 billion by 2031.
Which deployment model is growing fastest?
Cloud deployments lead growth, expanding at a 9.31% CAGR as manufacturers seek scalable analytics capabilities.
Which industry vertical adopts production monitoring most actively?
Automotive plants hold the largest share at 21.70%, although healthcare and life sciences deliver the highest CAGR at 9.78% through 2031.
Why are services growing faster than solutions?
Services address OT-IT integration complexity, data-quality governance, and continuous AI model tuning, driving a 9.62% CAGR.
Which region shows the highest growth potential?
The Middle East and Africa region is projected to expand at a 10.34% CAGR thanks to large-scale industrial diversification programmes.
How is edge-AI reshaping production monitoring?
Edge-AI enables real-time anomaly detection on the shop floor, reducing unscheduled downtime by up to 70% for early adopters.
Page last updated on:





