
Commercial IT Hardware Fleet Procurement Market Size and Share
Market Overview
| Study Period | 2020 - 2031 |
|---|---|
| Market Size (2026) | USD 25.37 Billion |
| Market Size (2031) | USD 36.82 Billion |
| Growth Rate (2026 - 2031) | 7.73 % |
| Fastest Growing Market | Asia Pacific |
| Largest Market | North America |
| Market Concentration | Medium |
Major Players *Disclaimer: Major Players sorted in no particular order Image © Mordor Intelligence. Reuse requires attribution under CC BY 4.0. | |
Commercial IT Hardware Fleet Procurement Market Analysis by Mordor Intelligence
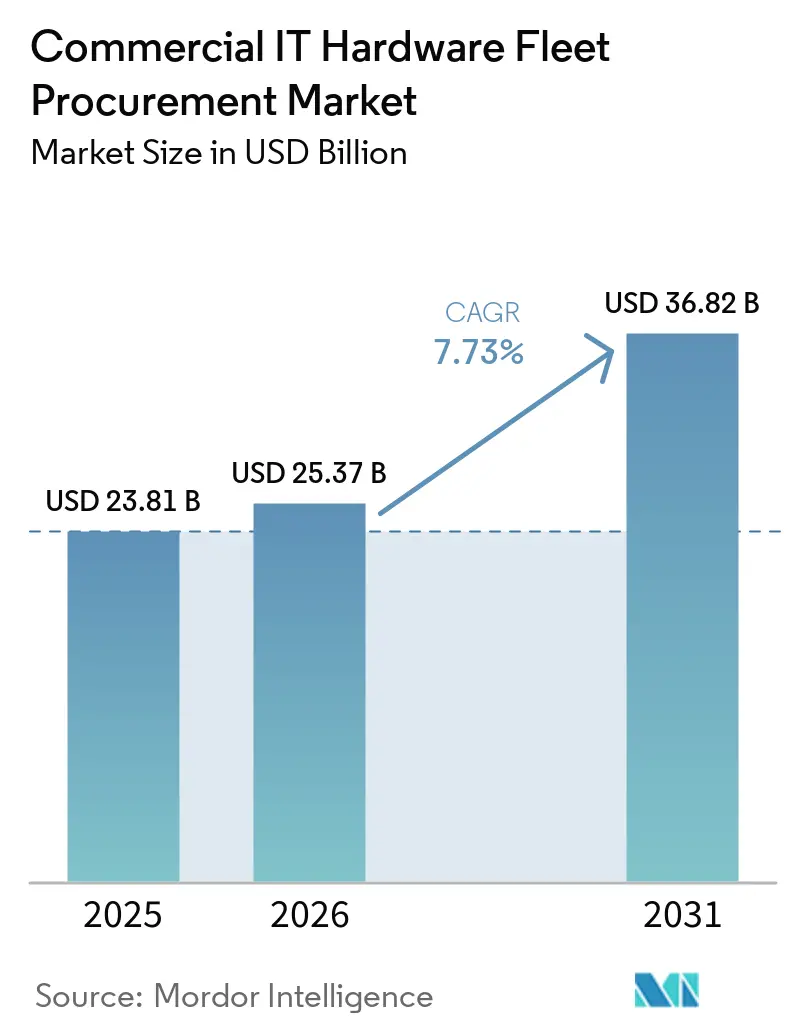
The commercial IT hardware fleet procurement market is projected to expand from USD 25.37 billion in 2026 to USD 36.82 billion by 2031, registering a CAGR of 7.73% over the same period. Heightened emphasis on operational resilience, the impending Windows 10 end-of-support deadline, and the shift toward AI-optimized endpoints are compressing refresh timetables and anchoring procurement in long-term strategy rather than episodic replacement. Device-as-a-service contracts are gaining currency as finance teams pivot to predictable OpEx models that sync with cloud-first budgeting, while ESG-linked mandates elevate hardware life-cycle transparency and take-back provisions. Chipset convergence between x86 and ARM architectures lowers total cost of ownership by enabling workload portability across edge, on-premises, and cloud footprints, yet lingering semiconductor allocation gaps prolong lead times and complicate planning. Competitive intensity is rising as hyperscaler-branded hardware and white-box vendors chip away at incumbent share, forcing traditional OEMs to pair hardware with software-defined management and carbon-accounting tools to remain differentiated.
Key Report Takeaways
- By hardware category, laptops and notebooks led with 46.32% revenue share in 2025, while mobile handheld devices are forecast to expand at an 8.93% CAGR through 2031.
- By procurement model, the outright purchase segment held 51.13% of the commercial IT hardware fleet procurement market share in 2025, whereas device-as-a-service is projected to record the highest CAGR at 8.73% over 2026-2031.
- By end-user industry, IT and telecom accounted for 24.59% of the commercial IT hardware fleet procurement market size in 2025, while healthcare is advancing at a 9.33% CAGR through 2031.
- By organization size, large enterprises captured 62.19% of the market in 2025, yet small and medium enterprises are growing at a 8.89% CAGR through 2031.
- By geography, North America dominated with 38.21% spend in 2025, but Asia-Pacific is the fastest growing region at an 8.36% CAGR during the forecast window.
Note: Market size and forecast figures in this report are generated using Mordor Intelligence’s proprietary estimation framework, updated with the latest available data and insights as of January 2026.
Market Trends and Insights
Drivers Impact Analysis of Commercial IT Hardware Fleet Procurement Market*
| Driver | (~) % Impact on CAGR Timeline | Geographic Relevance | Impact Timeline |
|---|---|---|---|
| Accelerated Hybrid-Work Hardware Refresh Cycles | +2.1% | Global, peak intensity in North America and Europe | Short term (≤ 2 years) |
| Rising Adoption of Device-as-a-Service Contracts | +1.8% | North America and Europe core, expanding to Asia-Pacific | Medium term (2-4 years) |
| ESG-Linked Procurement Mandates from Enterprises | +1.3% | Europe and North America, spillover to Asia-Pacific multinationals | Medium term (2-4 years) |
| Chipset Road-Map Alignment Reducing Total Lifecycle Cost | +1.2% | Global | Long term (≥ 4 years) |
| Zero-Trust Security Standards Driving Endpoint Upgrades | +0.9% | North America, Europe, adoption in Asia-Pacific financial services | Short term (≤ 2 years) |
| Surge in Edge-Computing Server Deployments | +0.8% | Global, early concentration in Asia-Pacific and North America | Medium term (2-4 years) |
| Source: Mordor Intelligence | |||
Accelerated Hybrid-Work Hardware Refresh Cycles
Hybrid work, entrenched since the pandemic, is driving synchronized refresh programs as enterprises replace hastily procured consumer devices with commercial-grade endpoints that embed hardware-based attestation. Microsoft’s October 2025 end-of-support for Windows 10 pushed 240 million PCs into refresh queues, and the spillover into 2026 is emphasizing AI-ready hardware equipped with neural processing units that offload inference from the cloud to the edge, slashing latency for collaboration platforms while curbing egress expenses. Dell Technologies disclosed that 68% of enterprise RFPs in 2025 specified AI PC requirements, underscoring the pivot from generic replacement to capability-centric procurement
Rising Adoption of Device-as-a-Service Contracts
Device-as-a-service (DaaS) converts hardware spending into subscription outlays and shifts residual-value risk to vendors, aligning with CFO goals for balance-sheet optimization. HP Inc. broadened its DaaS bundle in 2025 to include carbon-neutral shipping and modular component swaps that lengthen device life by two years. Lenovo’s TruScale expanded usage-based billing that triggers proactive swaps before failure, cutting unplanned downtime by one-third in pilot deployments for financial-services clients.[1] While DaaS mitigates refresh headaches, procurement teams remain alert to potential lock-in and insist on data-sanitization clauses to satisfy regulatory obligations.
ESG-Linked Procurement Mandates from Enterprises
Scope 3 accounting is animating procurement as buyers demand granular life-cycle carbon data and circular design. The European Union’s 2025 Green Public Procurement criteria require public agencies to source 30% of IT hardware that meets strict energy and recycled-content thresholds, with the criteria rippling across private tenders as vendors standardize on compliant SKUs. Dell pledged to incorporate 50% recycled or renewable materials by 2030, and in 2025 began closed-loop aluminum sourcing that re-enters recovered metal into new chassis. Procurement scorecards now weigh carbon intensity alongside price, reshaping competitive parameters.
Chipset Road-Map Alignment Reducing Total Lifecycle Cost
Convergence of x86 and ARM road maps widens workload portability and tempers total cost of ownership. AMD’s EPYC 9005 processors deliver 30% higher performance per watt than their predecessors, allowing operators to defer facility upgrades. Intel’s Xeon 6 with built-in accelerators lowers rack density and drives 18% five-year savings, while ARM-based servers such as AWS Graviton4 showcase cost-performance advantages that prompt on-premises buyers to evaluate Ampere and Fujitsu alternatives. The architectural mix affords procurement teams latitude to rebalance as economics evolve, although tooling and skill requirements add transitional complexity.
Restraints Impact Analysis of Commercial IT Hardware Fleet Procurement Market*
| Restraint | (~) % Impact on CAGR Forecast | Geographic Relevance | Impact Timeline |
|---|---|---|---|
| Persistent Global Semiconductor Supply Gaps | -1.4% | Global, acute in Asia-Pacific manufacturing and North America enterprise | Short term (≤ 2 years) |
| Budget Freezes in Public Sector IT Spending | -1.1% | Europe and select emerging markets | Short term (≤ 2 years) |
| Lengthening Hardware Replacement Cycles via Cloud Migration | -0.7% | North America and Europe, gradual in Asia-Pacific | Medium term (2-4 years) |
| Rising E-Waste Compliance Costs for Procurers | -0.5% | Europe core, expanding to Asia-Pacific and North America | Long term (≥ 4 years) |
| Source: Mordor Intelligence | |||
Persistent Global Semiconductor Supply Gaps
Despite significant investments in semiconductor fabrication facilities, shortages of legacy nodes continue to persist. TSMC’s capital expenditure for 2025 has been heavily focused on advancing cutting-edge nodes, leaving limited capacity for critical 28-nanometer production lines. This constraint has led to extended lead times of up to 18 weeks, causing delays in laptop production and impacting supply chains. Additionally, DDR5 module prices increased by 50% between Q4 2024 and Q2 2025, driven by heightened demand from data center restocking. This price surge has forced original equipment manufacturers (OEMs) to transfer the increased costs to enterprise buyers, further straining budgets. In response to these challenges, procurement teams have sought to mitigate risks by expanding secondary sourcing options. However, this approach has led to higher inventory costs and increased quality-control risks, adding complexity to supply chain management.
Budget Freezes in Public Sector IT Spending
Fiscal consolidation is exerting significant pressure on European ministries, leading to notable budgetary adjustments. The United Kingdom’s Autumn 2025 budget implemented a 12% reduction in non-essential IT expenditures. This reduction has compelled agencies to purchase Windows 10 extended security updates as a cost-saving measure rather than invest in new hardware.[2] Similarly, Spain and Italy have enacted 8% cuts to municipal IT budgets, resulting in delays to planned zero-trust endpoint transitions. In contrast, the United States has maintained robust federal IT spending, supported by multi-year cybersecurity appropriations. This divergence in spending patterns has created a clear regional disparity in demand for IT solutions.
*Our forecasts treat driver/restraint impacts as directional, not additive. The impact forecasts reflect baseline growth, mix effects, and variable interactions.
Commercial IT Hardware Fleet Procurement Market Segment Analysis
By Hardware Category:
Mobile Handheld Devices Fuel Field-Service DigitizationMobile handheld devices contributed a smaller revenue base in 2025 but are forecast to advance at an 8.93% CAGR, the fastest within the commercial IT hardware fleet procurement market. Utilities, mining, and logistics firms are rolling out rugged, intrinsically safe tablets to digitize asset inspections and meter readings. Getac Technology saw rugged tablet shipments jump 42% in 2025, driven by 5G-enabled models paired with predictive-maintenance applications. Zebra Technologies supplemented its handheld scanner line with six-inch displays and hot-swappable batteries for warehouses grappling with peak-season surges.
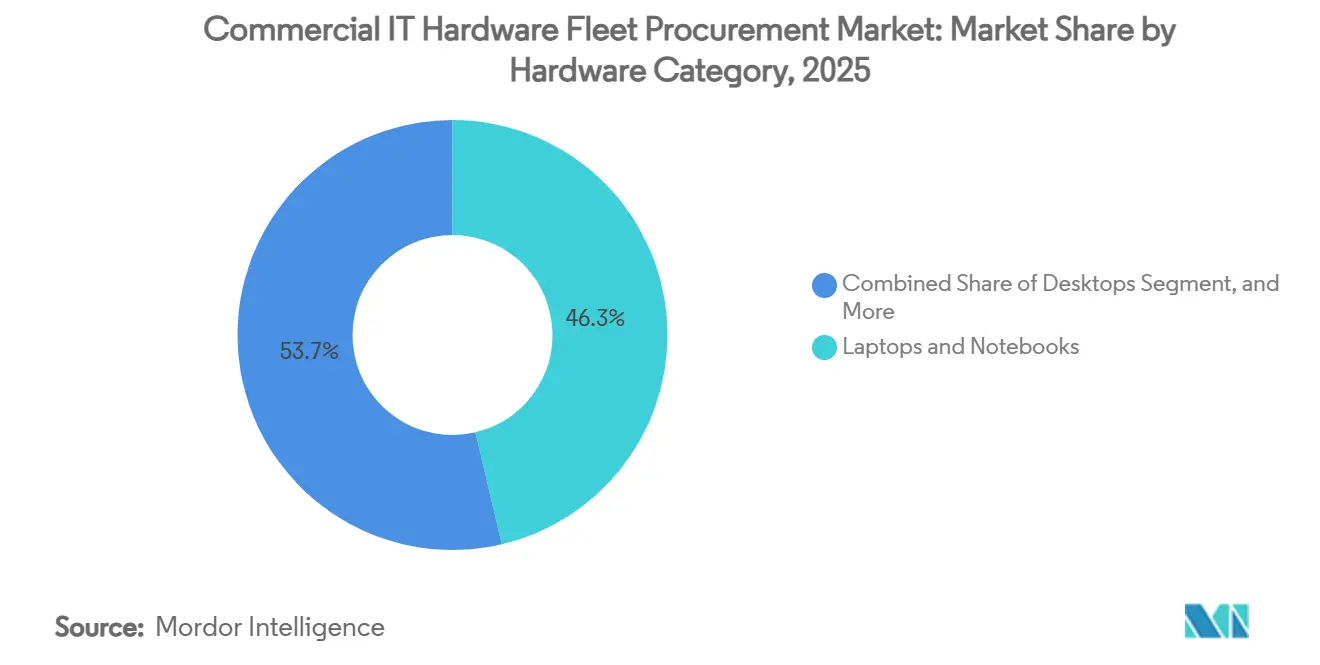
Laptops and notebooks retained 46.32% of the commercial IT hardware fleet procurement market share in 2025, yet growth tapers as virtual desktop infrastructure tempers compute needs for knowledge workers. Desktops persist in call centers and education, where stationary workflows prevail, and workstations remain indispensable for engineering and media workloads that require discrete GPUs. Edge-optimized servers are growing as manufacturers deploy localized compute; Supermicro logged 38% year-over-year growth in 2025. Computer peripherals track endpoint proliferation but face commoditization as USB-C standardization narrows differentiation.

By Procurement Model:
Device-as-a-Service Converts CapEx to OpExDevice-as-a-service (DaaS) contracts are expected to grow at a compound annual growth rate (CAGR) of 8.73%, gradually reducing the dominance of outright purchases, which are projected to hold a 51.13% share in 2025. HP has reported a significant 29% year-over-year increase in its DaaS bookings, with contract durations extending up to four years. These contracts often include bundled offerings such as hardware, support services, and sustainability features, making them an attractive option for businesses. While leasing remains a popular choice among mid-sized firms due to its flexibility, it lacks the integrated refresh automation that DaaS provides, which is increasingly becoming a critical factor for organizations aiming to streamline their IT operations.
The certified refurbishment market is also gaining momentum, with companies like Dell processing approximately 1.2 million units in 2025 through their refurbishment programs. These programs offer refurbished devices at 30–40% off while still providing full warranties, making them a cost-effective alternative for budget-conscious buyers. However, outright ownership remains the preferred model for industries with stringent data sovereignty requirements. Despite this, the alignment of operational expenditure (OpEx) with cloud spending trends is gradually shifting the balance in favor of subscription-based models like DaaS, as businesses increasingly prioritize flexibility and cost efficiency in their IT strategies.
By End-User Industry:
Healthcare Accelerates on Telehealth ComplianceThe healthcare sector is projected to grow at a 9.33% CAGR, making it the fastest-growing vertical, driven by the increasing adoption of telehealth services and stricter HIPAA enforcement. The U.S. Department of Health and Human Services implemented tighter regulations in 2025, mandating hardware-based encryption and remote-wipe capabilities, which has accelerated the replacement of outdated devices in hospitals.[3] In response to these demands, Panasonic introduced antimicrobial tablets equipped with hot-swappable batteries, specifically designed for continuous 24-hour clinical use. These advancements highlight the sector's focus on enhancing security and operational efficiency through modernized IT hardware solutions.
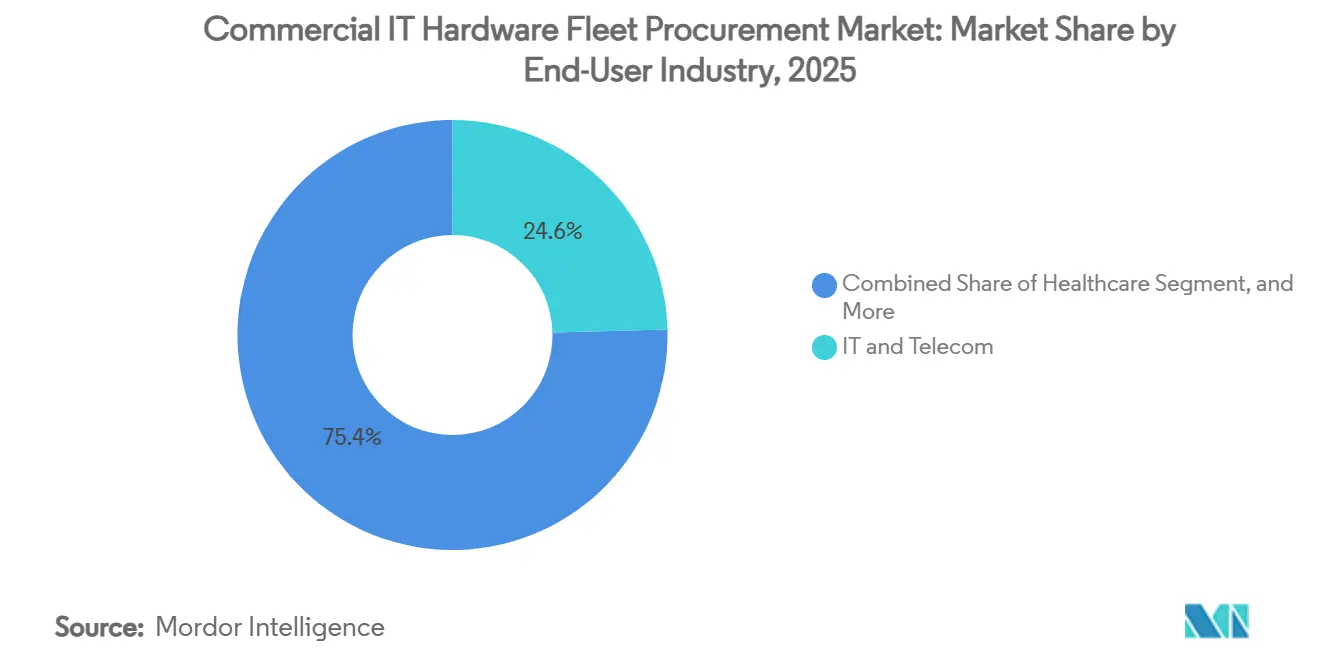
Meanwhile, the IT and telecom sector accounted for 24.59% of the commercial IT hardware fleet procurement market size in 2025, driven by the ongoing deployment of 5G networks and the increasing adoption of network virtualization, which requires high-density servers. The BFSI sector has prioritized investments in AI-powered fraud detection systems to enhance security and operational efficiency. Government agencies, despite facing budget constraints, have benefited from cybersecurity grants to modernize their IT infrastructure. In the education sector, demand is divided: higher education research labs that invest in GPU workstations to support advanced computing, while K-12 institutions focus on extending the lifecycle of Chromebooks to optimize costs and resources.
By Organization Size:
SMEs Narrow the Gap Through Fintech LeasingSmall and medium enterprises (SMEs) are experiencing a 8.89% CAGR, gradually reducing the dominance of large enterprises, which accounted for 62.19% of the market share in 2025. Fintech platforms, such as Stripe Capital, have streamlined equipment financing processes by approving loans within 24 hours. These platforms tie repayment schedules to cash flow, making it easier for credit-constrained SMEs to access funding. Lenovo’s SMB-focused TruScale offering aligns costs with growth trajectories by structuring fees based on headcount, providing flexibility for smaller businesses. While large enterprises continue to leverage their scale to negotiate volume discounts, they are increasingly prioritizing standardization and vendor consolidation to simplify support and maintenance processes.
SMEs, on the other hand, are gravitating toward turnkey solutions that integrate hardware, software, and managed IT services. These bundled offerings reduce the need for in-house IT expertise but also increase reliance on a single vendor. Additionally, rising cyber insurance premiums are pressuring SMEs to adopt modern hardware with built-in security features. Insurers are beginning to penalize businesses that fail to meet these security standards, prompting many SMEs to upgrade their IT infrastructure sooner than planned. This shift highlights the growing importance of security compliance and operational efficiency in driving IT hardware adoption among smaller enterprises.
Geography Analysis
North America Commercial IT Hardware Fleet Procurement Market
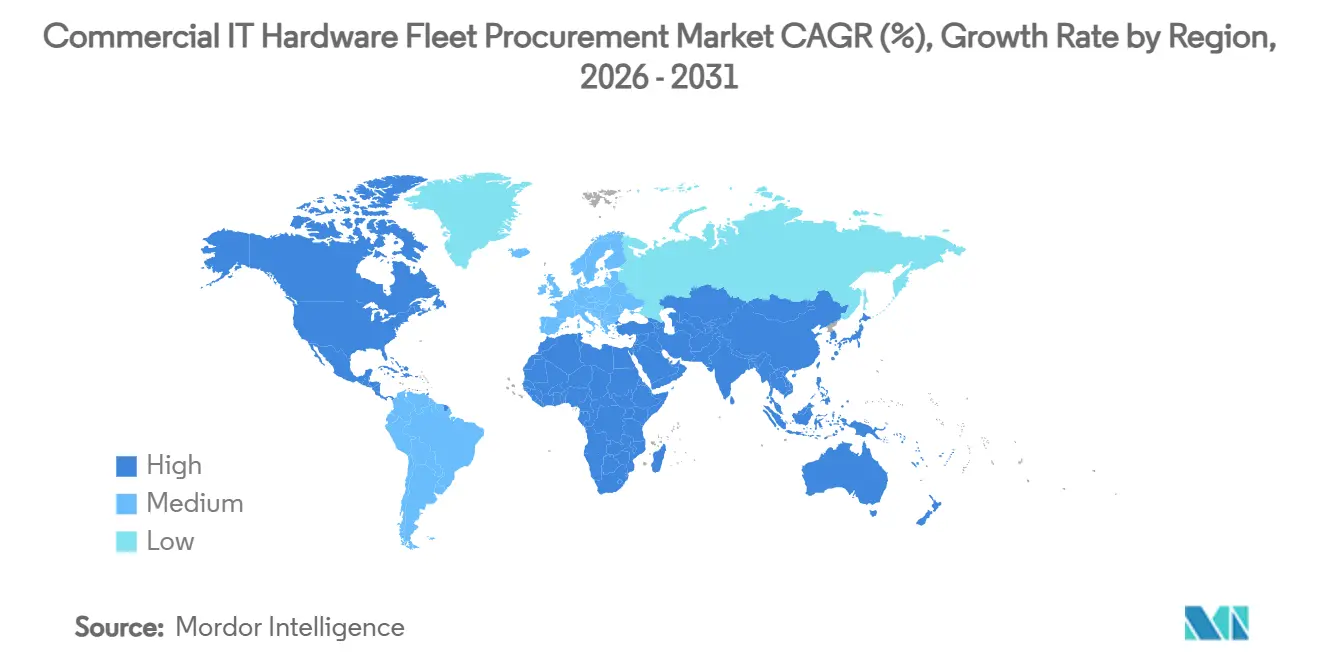
North America accounted for 38.21% of procurement outlays in 2025, driven by the implementation of zero-trust mandates and the early adoption of AI technologies at endpoints. The United States, in particular, saw significant investments through federal programs such as Continuous Diagnostics and Mitigation, which mandated hardware-rooted credential storage, prompting upgrades across various agencies. Additionally, Canada and Mexico benefited from nearshoring trends as manufacturing activities shifted from Asia to North America, further boosting investments in regional IT infrastructure and related technologies.
APAC Commercial IT Hardware Fleet Procurement Market
Asia-Pacific is projected to achieve the highest regional CAGR at 8.36% during the forecast period. India’s Digital India 2.0 initiative allocated USD 1.2 billion in 2025 to enhance IT infrastructure, including the procurement of 500,000 devices for schools and e-governance centers, thereby driving growth in the region. Meanwhile, China’s dual-circulation policy encouraged enterprises to adopt domestic servers from companies like Huawei and Inspur, helping mitigate geopolitical risks. Japan is also contributing to the region’s growth by extending digital transformation subsidies that covered 50% of hardware costs for small and medium-sized enterprises (SMEs) adopting cloud-based solutions.
EMEA and South America Commercial IT Hardware Fleet Procurement Market
Europe continues to balance strong environmental, social, and governance (ESG) regulations with fiscal austerity measures. While GDPR enforcement and cybersecurity directives sustain demand for endpoint devices, public-sector budget freezes have slowed overall growth in the region. In South America, price sensitivity remains a key factor, with many organizations opting for refurbished equipment and long payment terms to manage costs. The Middle East and Africa exhibit a bifurcated demand pattern, with Gulf states investing heavily in smart-city infrastructure projects, while many African markets prioritize mobile-first procurement strategies to overcome the limitations of wired broadband infrastructure.
Competitive Landscape
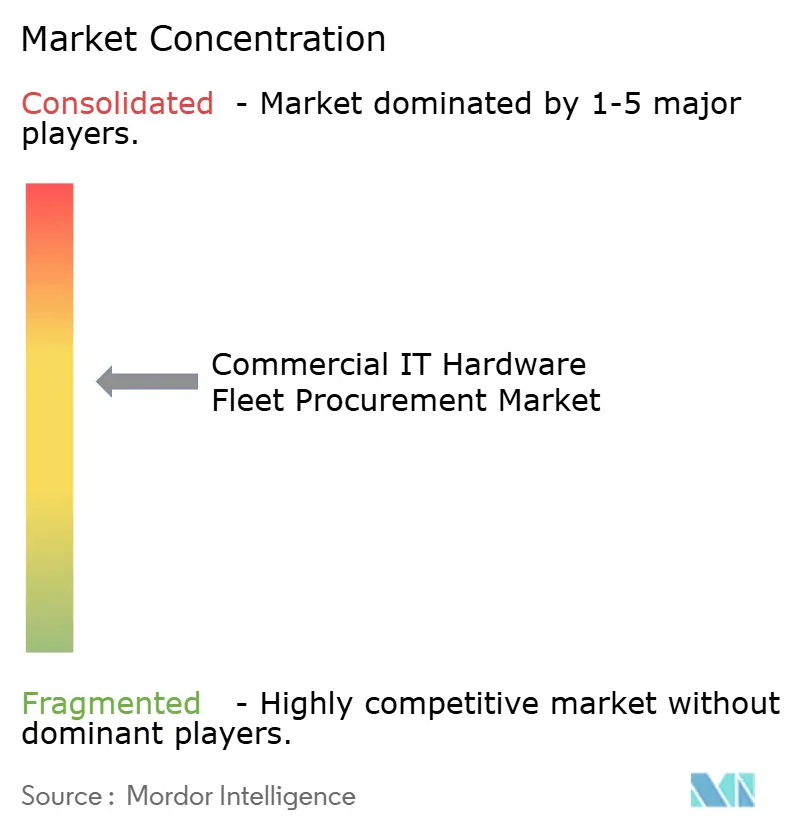
The commercial IT hardware fleet procurement market is moderately concentrated, with the top five vendors, Dell Technologies, HP Inc., Lenovo, Apple, and Microsoft, accounting for approximately 60% of global revenue in 2025. Dell and HP capitalize on vertically integrated supply chains to maintain operational efficiency; however, they face challenges with margin compression as the device-as-a-service model shifts revenue recognition over multi-year periods. Lenovo’s strategic pivot in 2025 toward AI-ready ThinkPad and ThinkStation product lines highlights the growing demand for edge computing solutions, which offer higher growth potential compared to commoditized servers. Meanwhile, Apple has seen increased enterprise adoption due to the performance and security advantages of its M-series chips and macOS platform, although its premium pricing limits its appeal in cost-sensitive industries.
Growth opportunities in the market are emerging across edge-computing appliances, ruggedized devices, and circular-economy services. Supermicro’s modular servers, for instance, enable component replacements without requiring a full chassis replacement, thereby reducing life-cycle costs and minimizing e-waste. However, these solutions often come with proprietary lock-in, limiting customer flexibility. In the rugged device segment, Getac and Panasonic maintain a stronghold by offering comprehensive end-to-end design and field service solutions tailored to demanding environments. Additionally, fintech leasing platforms are disrupting traditional distribution channels by simplifying small and medium enterprise (SME) approvals and aligning payment structures with actual usage, creating new competitive dynamics in the market.
The focus of differentiation in the IT hardware market is gradually shifting from hardware specifications to integrated management software, AI accelerators, and sustainability initiatives such as transparent carbon accounting. Vendors are increasingly prioritizing solutions that combine hardware, software, and services to deliver holistic value to customers. This trend is particularly evident in the adoption of circular-economy practices, in which companies aim to extend product lifecycles and reduce environmental impact. As the market evolves, players that can effectively integrate these elements into their offerings are likely to gain a competitive edge, especially in addressing the growing demand for sustainable and efficient IT hardware solutions.
Commercial IT Hardware Fleet Procurement Industry Leaders
-
Dell Technologies Inc.
-
HP Inc.
-
Lenovo Group Limited
-
Apple Inc.
-
Acer Inc.
- *Disclaimer: Major Players sorted in no particular order
Commercial IT Hardware Fleet Procurement Market Companies Covered in this Report
- Dell Technologies Inc.
- HP Inc.
- Lenovo Group Limited
- Apple Inc.
- Acer Inc.
- ASUSTeK Computer Inc.
- Samsung Electronics Co., Ltd.
- Fujitsu Limited
- Toshiba Corporation
- Panasonic Holdings Corporation
- Dynabook Inc.
- Microsoft Corporation
- Huawei Technologies Co., Ltd.
- Cisco Systems, Inc.
- Getac Technology Corporation
- Micro-Star International Co., Ltd.
- LG Electronics Inc.
- Zebra Technologies Corporation
- Honeywell International Inc.
- Super Micro Computer, Inc.
Recent Industry Developments in Commercial IT Hardware Fleet Procurement Market
- March 2026: Dell Technologies introduced the Latitude 7460 AI PC series with Intel Core Ultra NPUs delivering 48 TOPS, available via device-as-a-service with carbon-neutral shipping and modular upgrades.
- February 2026: Lenovo invested USD 200 million to expand its Pondicherry, India plant, adding 2 million units of annual capacity for ThinkPad and ThinkCentre production.
- January 2026: HP Inc. and Microsoft integrated Windows 11 Enterprise with HP Wolf Security firmware protections across Elite and Pro lines, shortening zero-trust deployment times by 40%.
- December 2025: Apple launched the MacBook Pro M4 with zero-touch deployment support for Intune and Workspace ONE, plus expanded 24×7 enterprise support.
Global Commercial IT Hardware Fleet Procurement Market Report Scope
The Commercial IT Hardware Fleet Procurement Market encompasses the structured acquisition, deployment, and lifecycle management of enterprise-grade computing hardware used by organizations across industries for business operations. This market includes bulk procurement and managed sourcing of IT hardware assets, including laptops and notebooks, desktops, workstations, servers, mobile handheld devices, and computer peripherals. These assets are typically deployed as part of enterprise IT infrastructure to support workforce productivity, digital transformation, and operational efficiency.
The Commercial IT Hardware Fleet Procurement Market Report is Segmented by Hardware Category (Laptops and Notebooks, Desktops, Workstations, Servers, Mobile Handheld Devices, and Computer Peripherals), Procurement Model (Outright Purchase, Leasing, Device-as-a-Service, Subscription-Based, and Buyback and Refurbished Programs), End-User Industry (BFSI, Healthcare, IT and Telecom, Government, Education, Manufacturing, Retail, and Energy), Organization Size (Large Enterprises, and SMEs), and Geography (North America, South America, Europe, Asia-Pacific, and Middle East and Africa). The Market Forecasts are Provided in Terms of Value (USD).
Segmentation Overview
| Laptops and Notebooks |
| Desktops |
| Workstations |
| Servers |
| Mobile Handheld Devices |
| Computer Peripherals |
| Outright Purchase |
| Leasing |
| Device-as-a-Service (DaaS) |
| Subscription-Based Procurement |
| Buyback and Refurbished Programs |
| BFSI |
| Healthcare |
| IT and Telecom |
| Government and Public Sector |
| Education |
| Manufacturing |
| Retail and E-Commerce |
| Energy and Utilities |
| Large Enterprises |
| Small and Medium Enterprises (SMEs) |
| North America | United States | |
| Canada | ||
| Mexico | ||
| South America | Brazil | |
| Argentina | ||
| Rest of South America | ||
| Europe | United Kingdom | |
| Germany | ||
| France | ||
| Italy | ||
| Spain | ||
| Rest of Europe | ||
| Asia-Pacific | China | |
| Japan | ||
| India | ||
| South Korea | ||
| Rest of Asia-Pacific | ||
| Middle East and Africa | Middle East | United Arab Emirates |
| Saudi Arabia | ||
| Rest of Middle East | ||
| Africa | South Africa | |
| Egypt | ||
| Rest of Africa | ||
| By Hardware Category | Laptops and Notebooks | ||
| Desktops | |||
| Workstations | |||
| Servers | |||
| Mobile Handheld Devices | |||
| Computer Peripherals | |||
| By Procurement Model | Outright Purchase | ||
| Leasing | |||
| Device-as-a-Service (DaaS) | |||
| Subscription-Based Procurement | |||
| Buyback and Refurbished Programs | |||
| By End-User Industry | BFSI | ||
| Healthcare | |||
| IT and Telecom | |||
| Government and Public Sector | |||
| Education | |||
| Manufacturing | |||
| Retail and E-Commerce | |||
| Energy and Utilities | |||
| By Organization Size | Large Enterprises | ||
| Small and Medium Enterprises (SMEs) | |||
| By Geography | North America | United States | |
| Canada | |||
| Mexico | |||
| South America | Brazil | ||
| Argentina | |||
| Rest of South America | |||
| Europe | United Kingdom | ||
| Germany | |||
| France | |||
| Italy | |||
| Spain | |||
| Rest of Europe | |||
| Asia-Pacific | China | ||
| Japan | |||
| India | |||
| South Korea | |||
| Rest of Asia-Pacific | |||
| Middle East and Africa | Middle East | United Arab Emirates | |
| Saudi Arabia | |||
| Rest of Middle East | |||
| Africa | South Africa | ||
| Egypt | |||
| Rest of Africa | |||
Key Questions Answered in the Report
What is driving the rapid uptake of device-as-a-service among enterprises?
Finance teams prefer predictable monthly OpEx, while vendors assume residual-value risk and manage refresh cycles, yielding 8.73% CAGR for the model through 2031.
How will the Windows 10 end-of-support deadline affect hardware demand in 2026?
The October 2025 deadline pushed 240 million PCs into refresh queues, causing a spillover surge in 2026 focused on AI-capable endpoints.
Which hardware category is projected to grow fastest to 2031?
Mobile handheld devices are forecast to climb at an 8.93% CAGR as utilities, logistics, and field-service firms digitize frontline workflows.
Why is Asia-Pacific the fastest growing region?
Government digitization budgets, semiconductor localization, and manufacturing automation propel an 8.36% CAGR for the region through 2031.
How are ESG mandates reshaping procurement choices?
Buyers now require lifecycle carbon data, recycled content, and take-back guarantees, favoring vendors that embed circular-economy design.
What level of market concentration characterizes the sector?
A concentration score of 6 reflects that the top five players hold about 60% of revenue, with growing competition from hyperscalers and niche specialists.