
Technology, Media and Telecom
5th MayPricing Strategy for Semiconductor Components
3 Min Read
The Procurement As A Service Market is Segmented by Service Type (Strategic Sourcing, Spend Management and More), Deployment Model (Cloud, On-Premise), Enterprise Size (Small and Medium Enterprises (SMEs) and More), End-User Industry (BFSI, Manufacturing, and More), and Geography. The Market Sizes and Forecasts are Provided in Terms of Value (USD) for all the Above Segments.
Market Overview
| Study Period | 2020 - 2031 |
|---|---|
| Market Size (2026) | USD 11.01 Billion |
| Market Size (2031) | USD 19.45 Billion |
| Growth Rate (2026 - 2031) | 12.08 % CAGR |
| Fastest Growing Market | Asia Pacific |
| Largest Market | North America |
| Market Concentration | Medium |
Major Players *Disclaimer: Major Players sorted in no particular order. Image © Mordor Intelligence. Reuse requires attribution under CC BY 4.0. |
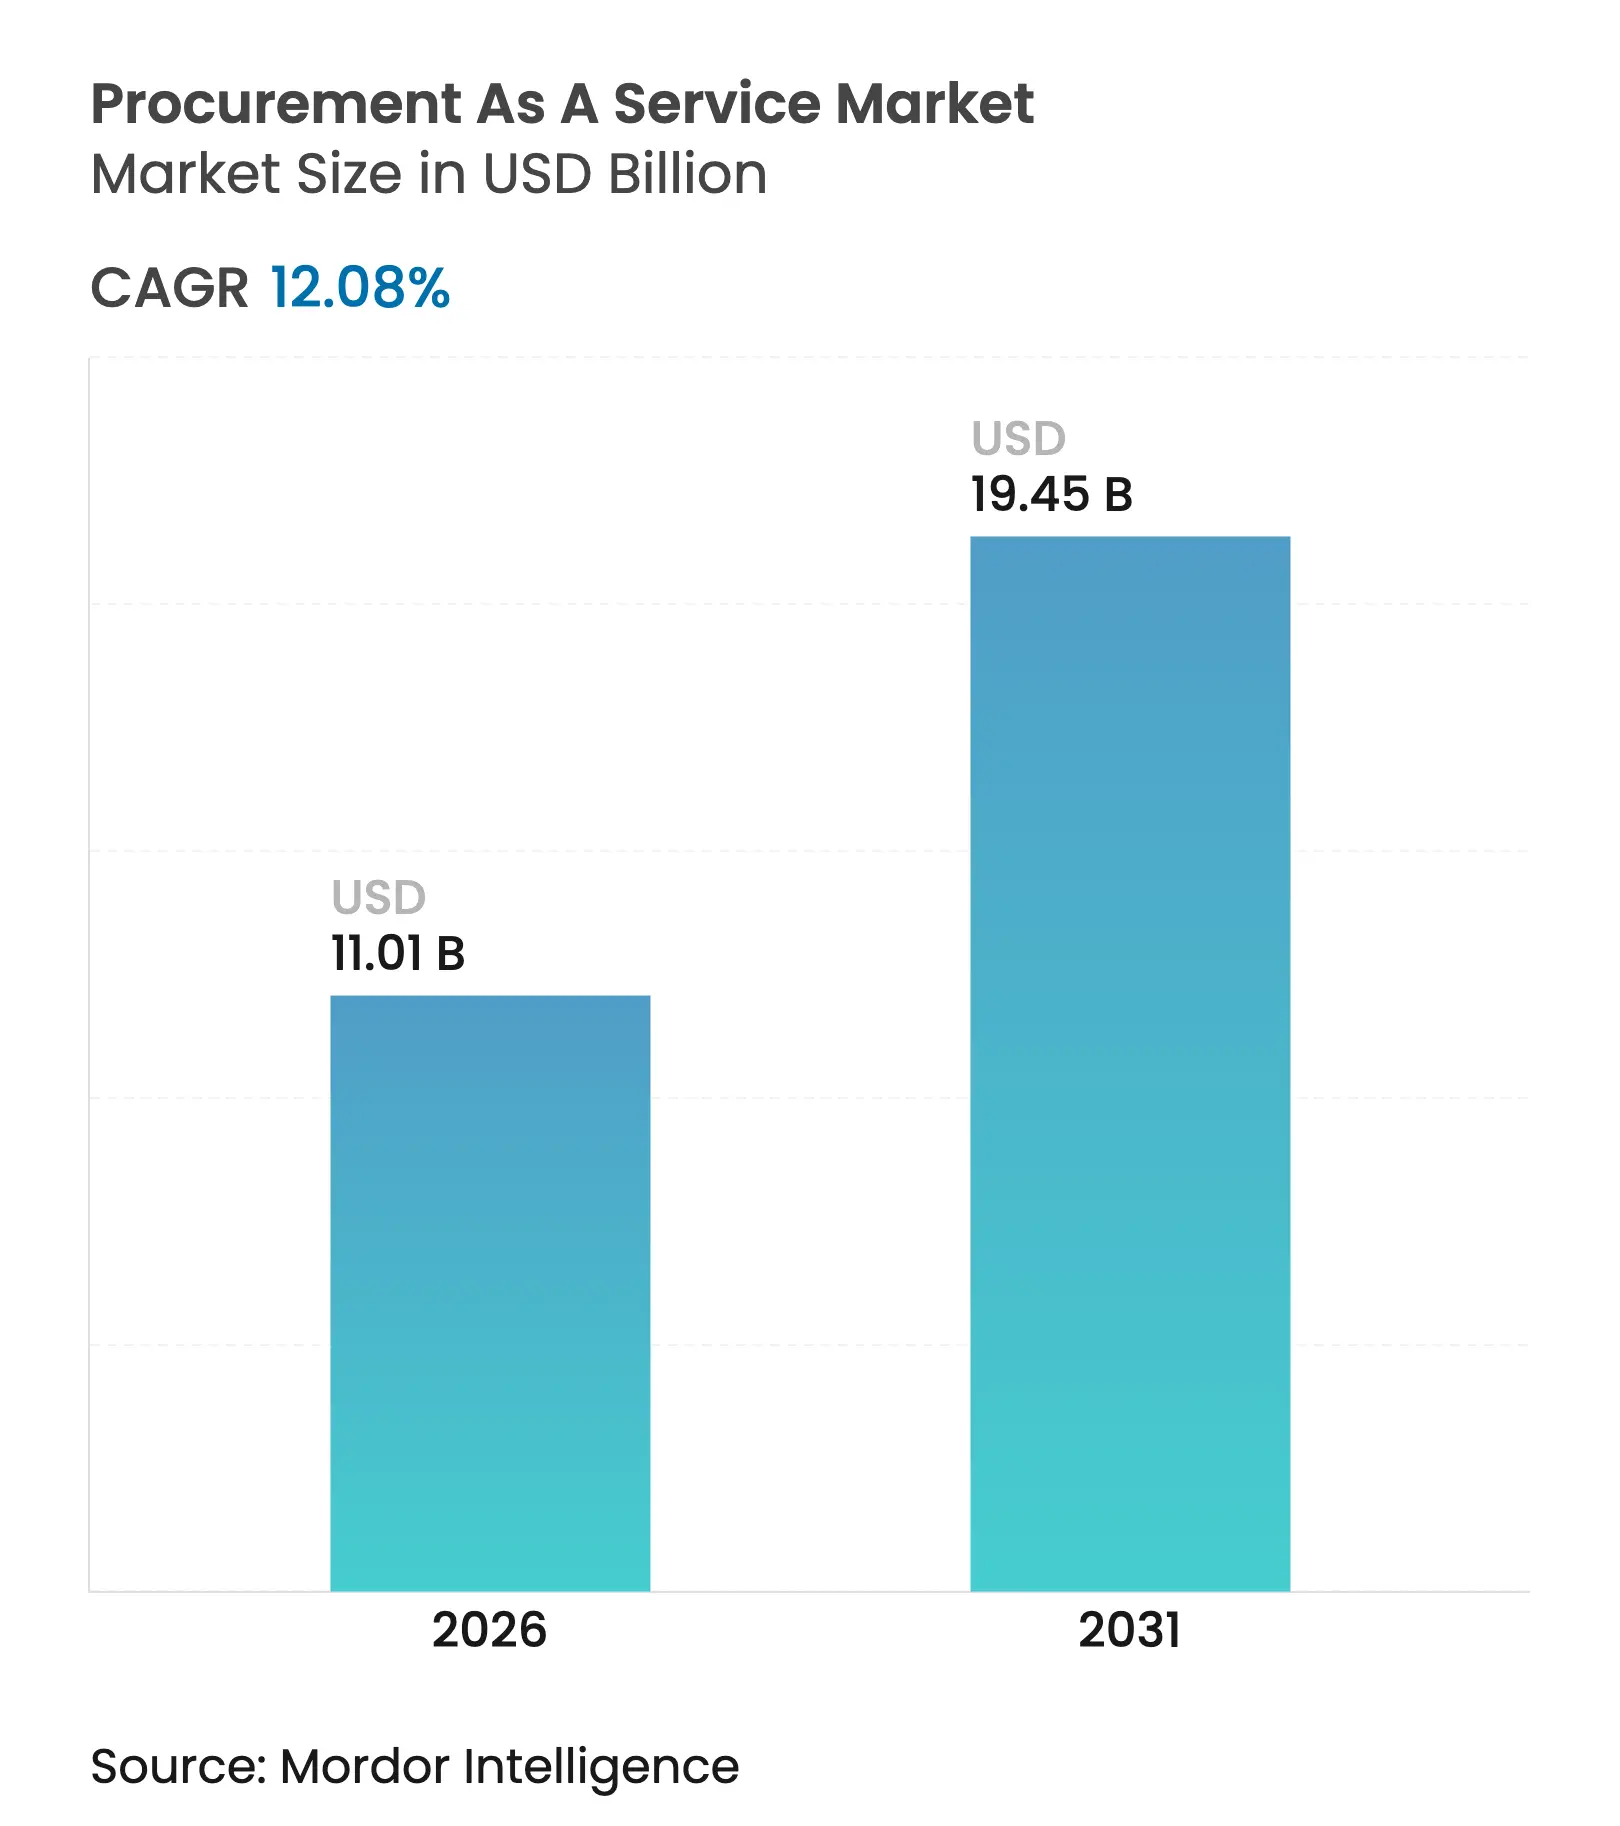
The Procurement-as-a-service market size was valued at USD 9.82 billion in 2025 and estimated to grow from USD 11.01 billion in 2026 to reach USD 19.45 billion by 2031, at a CAGR of 12.08% during the forecast period (2026-2031). Rapid growth reflects the shift from cost-centric purchasing toward value-oriented supplier collaboration, risk mitigation, and innovation capture. Enterprises rely on external specialists to manage commodity volatility, integrate ESG criteria, and deploy AI that identifies savings in tail-spend categories. Cloud-native platforms further accelerate adoption by enabling real-time collaboration across global teams while avoiding heavy upfront capital outlays[2]Procurement Magazine Editorial Team, “Cloud Procurement: The 2025 Outlook,” procurementmag.com. Near-shoring strategies, sustainability mandates, and AI-driven category intelligence together reinforce a virtuous cycle that expands wallet share for providers and elevates procurement to a board-level priority.
Key Report Takeaways
Note: Market size and forecast figures in this report are generated using Mordor Intelligence's proprietary estimation framework, updated with the latest available data and insights as of 2026.
Drivers Impact Analysis
| Driver | (~) % Impact on CAGR Forecast | Geographic Relevance | Impact Timeline | |||
|---|---|---|---|---|---|---|
Rising need to streamline procurement workflows Rising need to streamline procurement workflows | +2.8% | Global | Medium term (2-4 years) | (~) % Impact on CAGR Forecast:+2.8% | Geographic Relevance:Global | Impact Timeline:Medium term (2-4 years) |
Increasing focus on contract-compliance and risk mitigation Increasing focus on contract-compliance and risk mitigation | +2.1% | North America and EU | Short term (≤ 2 years) | |||
Digital procurement platforms enabling real-time spend visibility Digital procurement platforms enabling real-time spend visibility | +1.9% | Global | Short term (≤ 2 years) | |||
ESG-linked supplier selection gaining board-level urgency ESG-linked supplier selection gaining board-level urgency | +1.7% | Global, strongest in EU | Medium term (2-4 years) | |||
Demand for AI-driven category insights among mid-market firms Demand for AI-driven category insights among mid-market firms | +1.5% | North America and Asia-Pacific | Medium term (2-4 years) | |||
Near-shoring initiatives reshaping sourcing footprints Near-shoring initiatives reshaping sourcing footprints | +1.3% | Americas and Asia-Pacific | Long term (≥ 4 years) | |||
| Source: Mordor Intelligence | ||||||
Rising Need to Streamline Procurement Workflows
Manual requisition, approval, and payment tasks still consume nearly 40% of buyers’ time, prompting enterprises to outsource entire source-to-pay cycles to providers that embed robotic process automation and AI orchestration. Manufacturers that adopted end-to-end engagement models cut purchase-order cycle times by 30% and raised compliance levels from 65% to 93%, freeing staff to focus on supplier innovation. Mid-market companies gain particular benefit because external platforms arrive pre-integrated with analytics, avoiding multi-year internal IT projects. The quest for speed and accuracy directly links workflow optimization to better cash-flow management and stronger supplier relationships, reinforcing demand across every region.
ESG-linked Supplier Selection Gaining Board-Level Urgency
Roughly 90% of an organization’s ESG footprint resides in its supply chain, so boards now demand procurement partners that verify Scope 3 emissions, ethical labor, and circular-economy metrics. The EU Corporate Sustainability Reporting Directive intensifies this push by obliging companies to disclose environmental and social impacts deep into their tier-2 supplier base. Energy majors already ask providers to track carbon at line-item level while still meeting cost-reduction targets. Outsourcers able to blend ESG scoring with traditional category-management analytics therefore win larger, longer contracts as sustainability shifts from compliance exercise to competitive differentiator.
Demand for AI-Driven Category Insights Among Mid-Market Firms
Seventy-two percent of procurement leaders now rank generative AI as a top investment priority, and mid-market enterprises view AI-driven category management as a fast route to parity with larger rivals[3]JAGGAER Research, “Generative AI in Sourcing,” jaggaer.com. Cloud-based suites deliver predictive price forecasting, automated supplier performance scoring, and conversational spend digests without the need for in-house data scientists. Healthcare facilities, for example, leverage these engines to balance regulatory compliance with cost minimization when sourcing implants or diagnostic equipment. As intuitive front-ends mature, AI becomes a built-in feature rather than a premium add-on, widening the addressable SME pool for service providers.
Near-Shoring Initiatives Reshaping Sourcing Footprints
Geopolitical shocks, freight-rate swings, and heightened cyber risks have revived interest in regional supplier ecosystems. Sixty-eight percent of North American manufacturers now prioritize near-shoring to Mexico or Central America to trim lead times and bolster resilience. Providers with local language skills and regional compliance expertise secure multi-year agreements to rebuild bill-of-materials structures while preserving cost competitiveness. Latin America rises as a beneficiary, delivering both proximity and meaningful carbon-reduction gains through shorter transport lanes. Over the long term, regional sourcing strategies become embedded in corporate risk frameworks, locking in growth for outsourcers with boots-on-the-ground networks.
Restraint Impact Analysis
| Restraint | (~)% Impact on CAGR Forecast | Geographic Relevance | Impact Timeline | |||
|---|---|---|---|---|---|---|
Integration hurdles with legacy ERPs Integration hurdles with legacy ERPs | -1.8% | Global | Short term (≤ 2 years) | (~)% Impact on CAGR Forecast:-1.8% | Geographic Relevance:Global | Impact Timeline:Short term (≤ 2 years) |
Data-sovereignty and cybersecurity concerns Data-sovereignty and cybersecurity concerns | -1.4% | EU and Asia-Pacific | Medium term (2-4 years) | |||
Shortage of specialised procurement talent Shortage of specialised procurement talent | -1.2% | Global | Medium term (2-4 years) | |||
Volatile commodity pricing disrupting as-a-service SLAs Volatile commodity pricing disrupting as-a-service SLAs | -0.9% | Global | Short term (≤ 2 years) | |||
| Source: Mordor Intelligence | ||||||
Integration Hurdles with Legacy ERPs
Many enterprises still run customized ERP builds rolled out more than 10 years ago, and those systems struggle to expose data through modern APIs. Manufacturers with older SAP landscapes report six- to twelve-month integration projects that inflate budgets and delay ROI. Outsourcers must craft bespoke middleware to bridge gaps in real-time supplier collaboration and AI analytics, raising the total cost of ownership. Mid-market firms often lack the IT resources to tackle these complexities, slowing purchase decisions even when the business case is clear.
Shortage of Specialised Procurement Talent
Fifty-eight percent of employers cannot find professionals who combine category expertise with digital fluency. Service providers also battle this scarcity because clients expect on-demand access to experts who can manage multi-regional contracts, ESG audits, and AI dashboards. WNS Procurement notes that 70% of open roles now include generative-AI proficiency as a requirement. Providers must therefore fund aggressive upskilling programs, which raises operating costs and caps delivery capacity, particularly in regulated verticals such as pharmaceuticals.
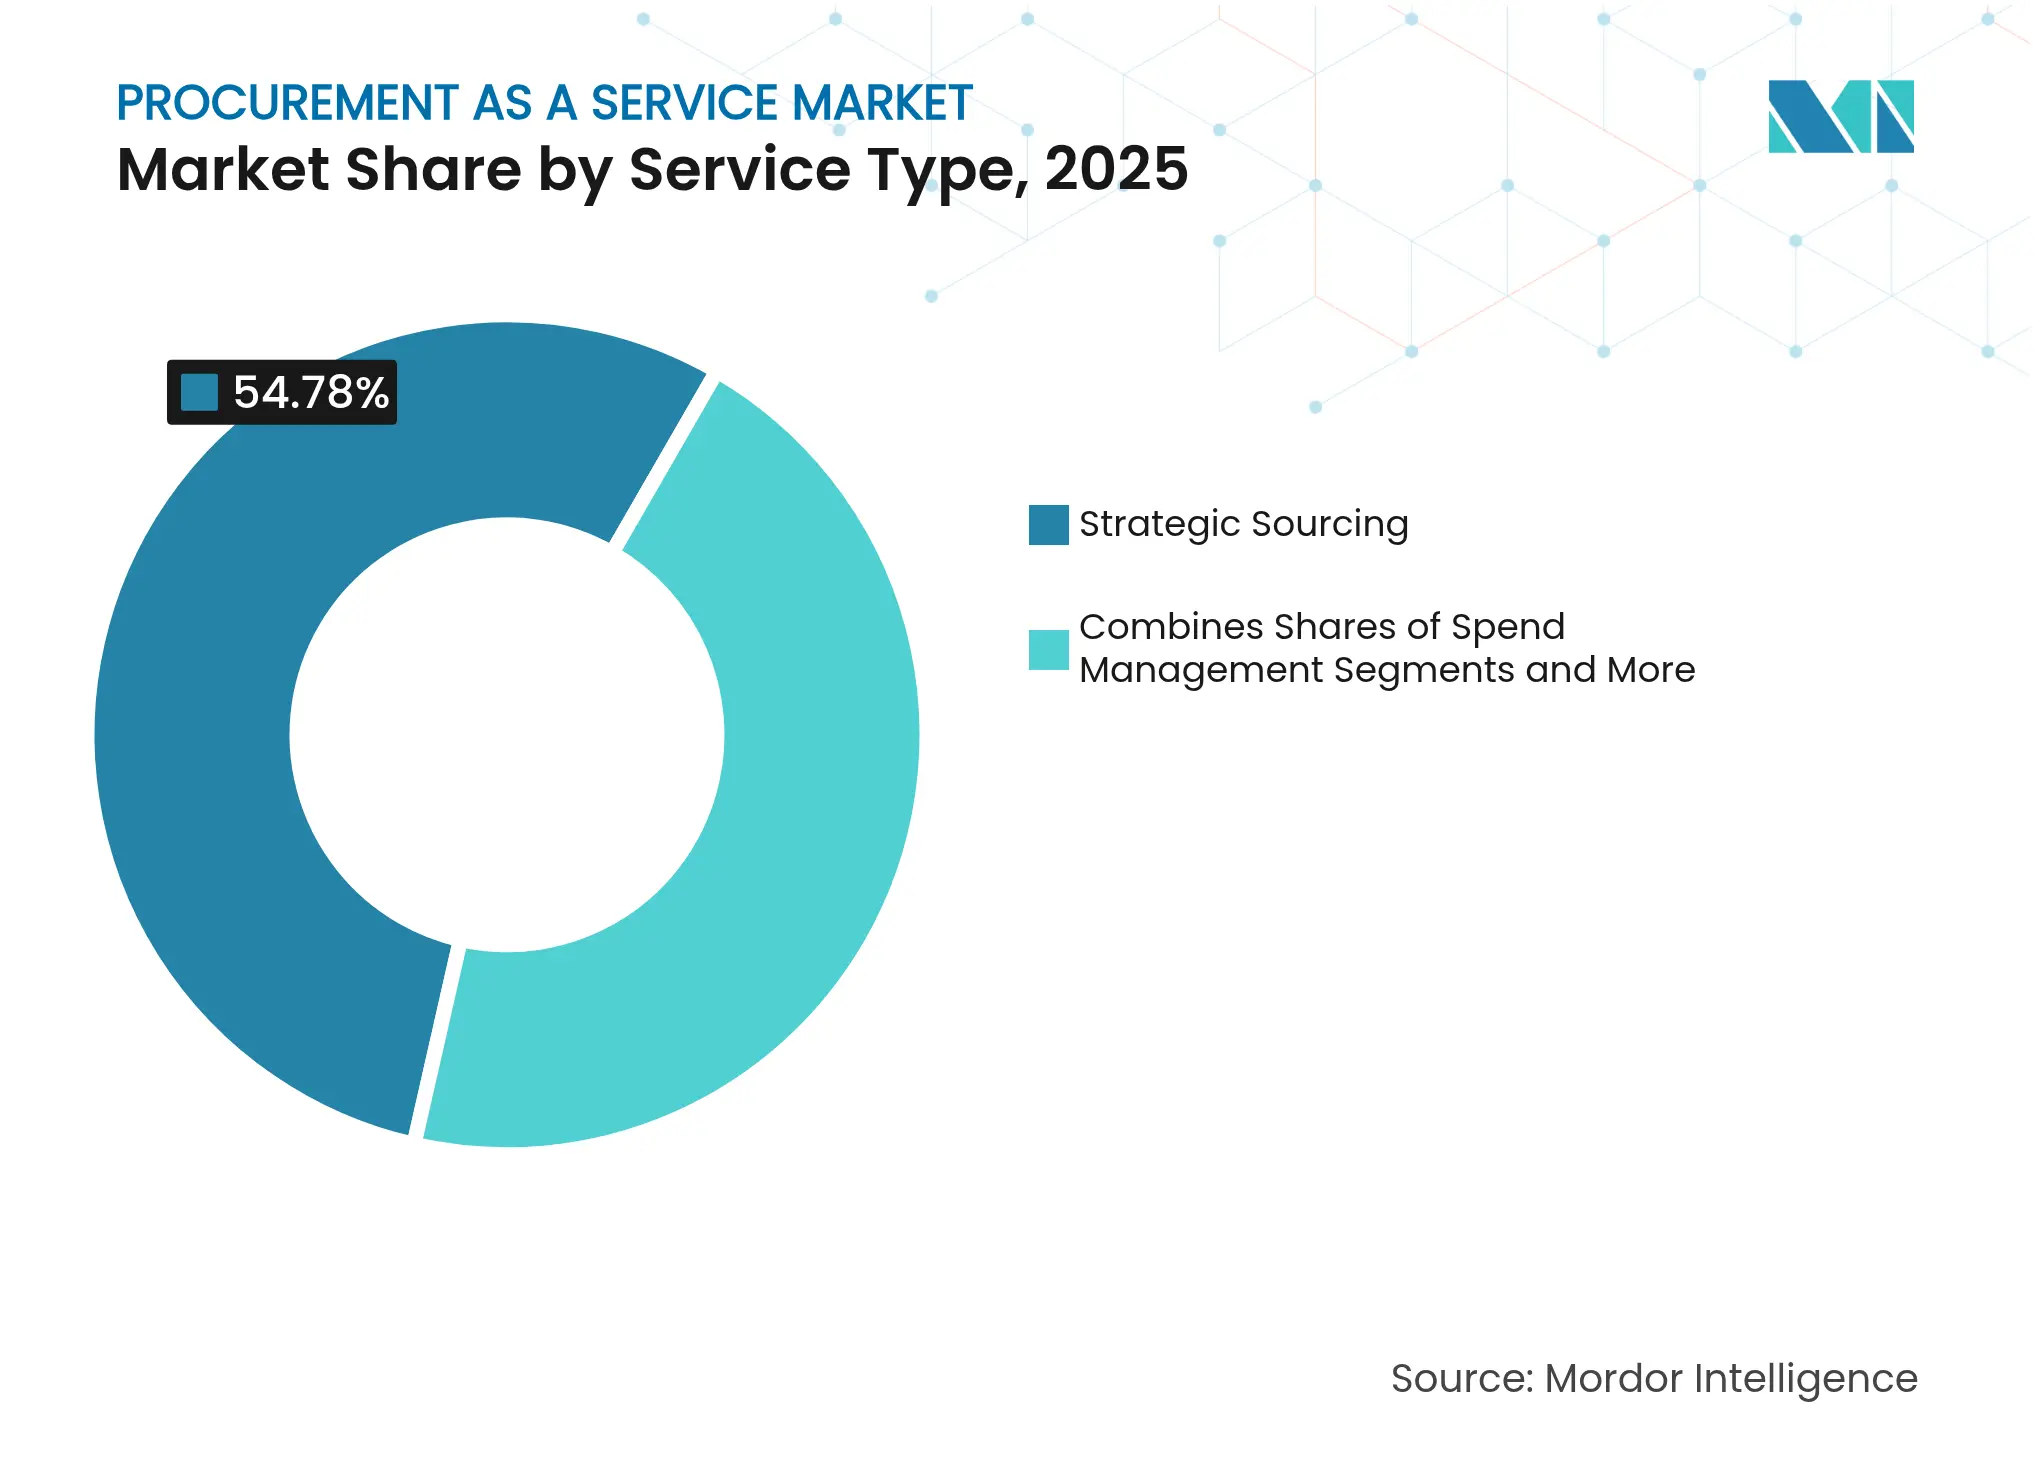
By Service Type: Strategic Sourcing Drives Market Leadership
Strategic sourcing captured 54.78% of Procurement-as-a-service market share in 2025, underscoring client appetite for end-to-end category stewardship that secures double-digit savings and deeper supplier innovation. The Procurement-as-a-service market size for category management is projected to expand at 14.85% CAGR to 2031 as AI democratizes granular supplier benchmarking once reserved for Fortune 500 budgets. Spend-management analytics maintain solid traction because real-time dashboards reveal maverick buying and free working capital. Procure-to-pay automation grows steadily as enterprises eliminate manual invoice matching and accelerate touchless payments.
Enterprises increasingly request bundled offerings that link strategic sourcing with contract-lifecycle management to ensure negotiated benefits flow into execution. Manufacturing clients now demand ESG screeners and supplier-innovation portals within the same agreement to support joint development projects. Outcome-based pricing, pegged to verified savings or compliance gains, incentivizes providers to integrate adjacent services rather than chase standalone contracts, reinforcing market leadership for full-suite specialists.
Note: Segment shares of all individual segments available upon report purchase
By Deployment Model: Cloud Dominance Accelerates Digital Transformation
Cloud platforms accounted for 72.65% of the Procurement-as-a-service market size in 2025 and are set to grow at 15.92% CAGR through 2031. Flexible subscription models lower the barrier for SMEs while multinationals appreciate global uptime, automatic upgrades, and built-in security certifications. On-premise remains common only in heavily regulated public-sector and defense accounts.
Rapid cloud uptake supports embedded AI services that predict demand spikes and flag supplier-credit risks in real time. Hybrid architectures emerge when clients route sensitive data through local servers yet still tap cloud analytics. Providers offering hardened multi-tenant environments with zero-trust frameworks and regional data centers gain preference as sovereignty rules tighten across the EU and parts of APAC.
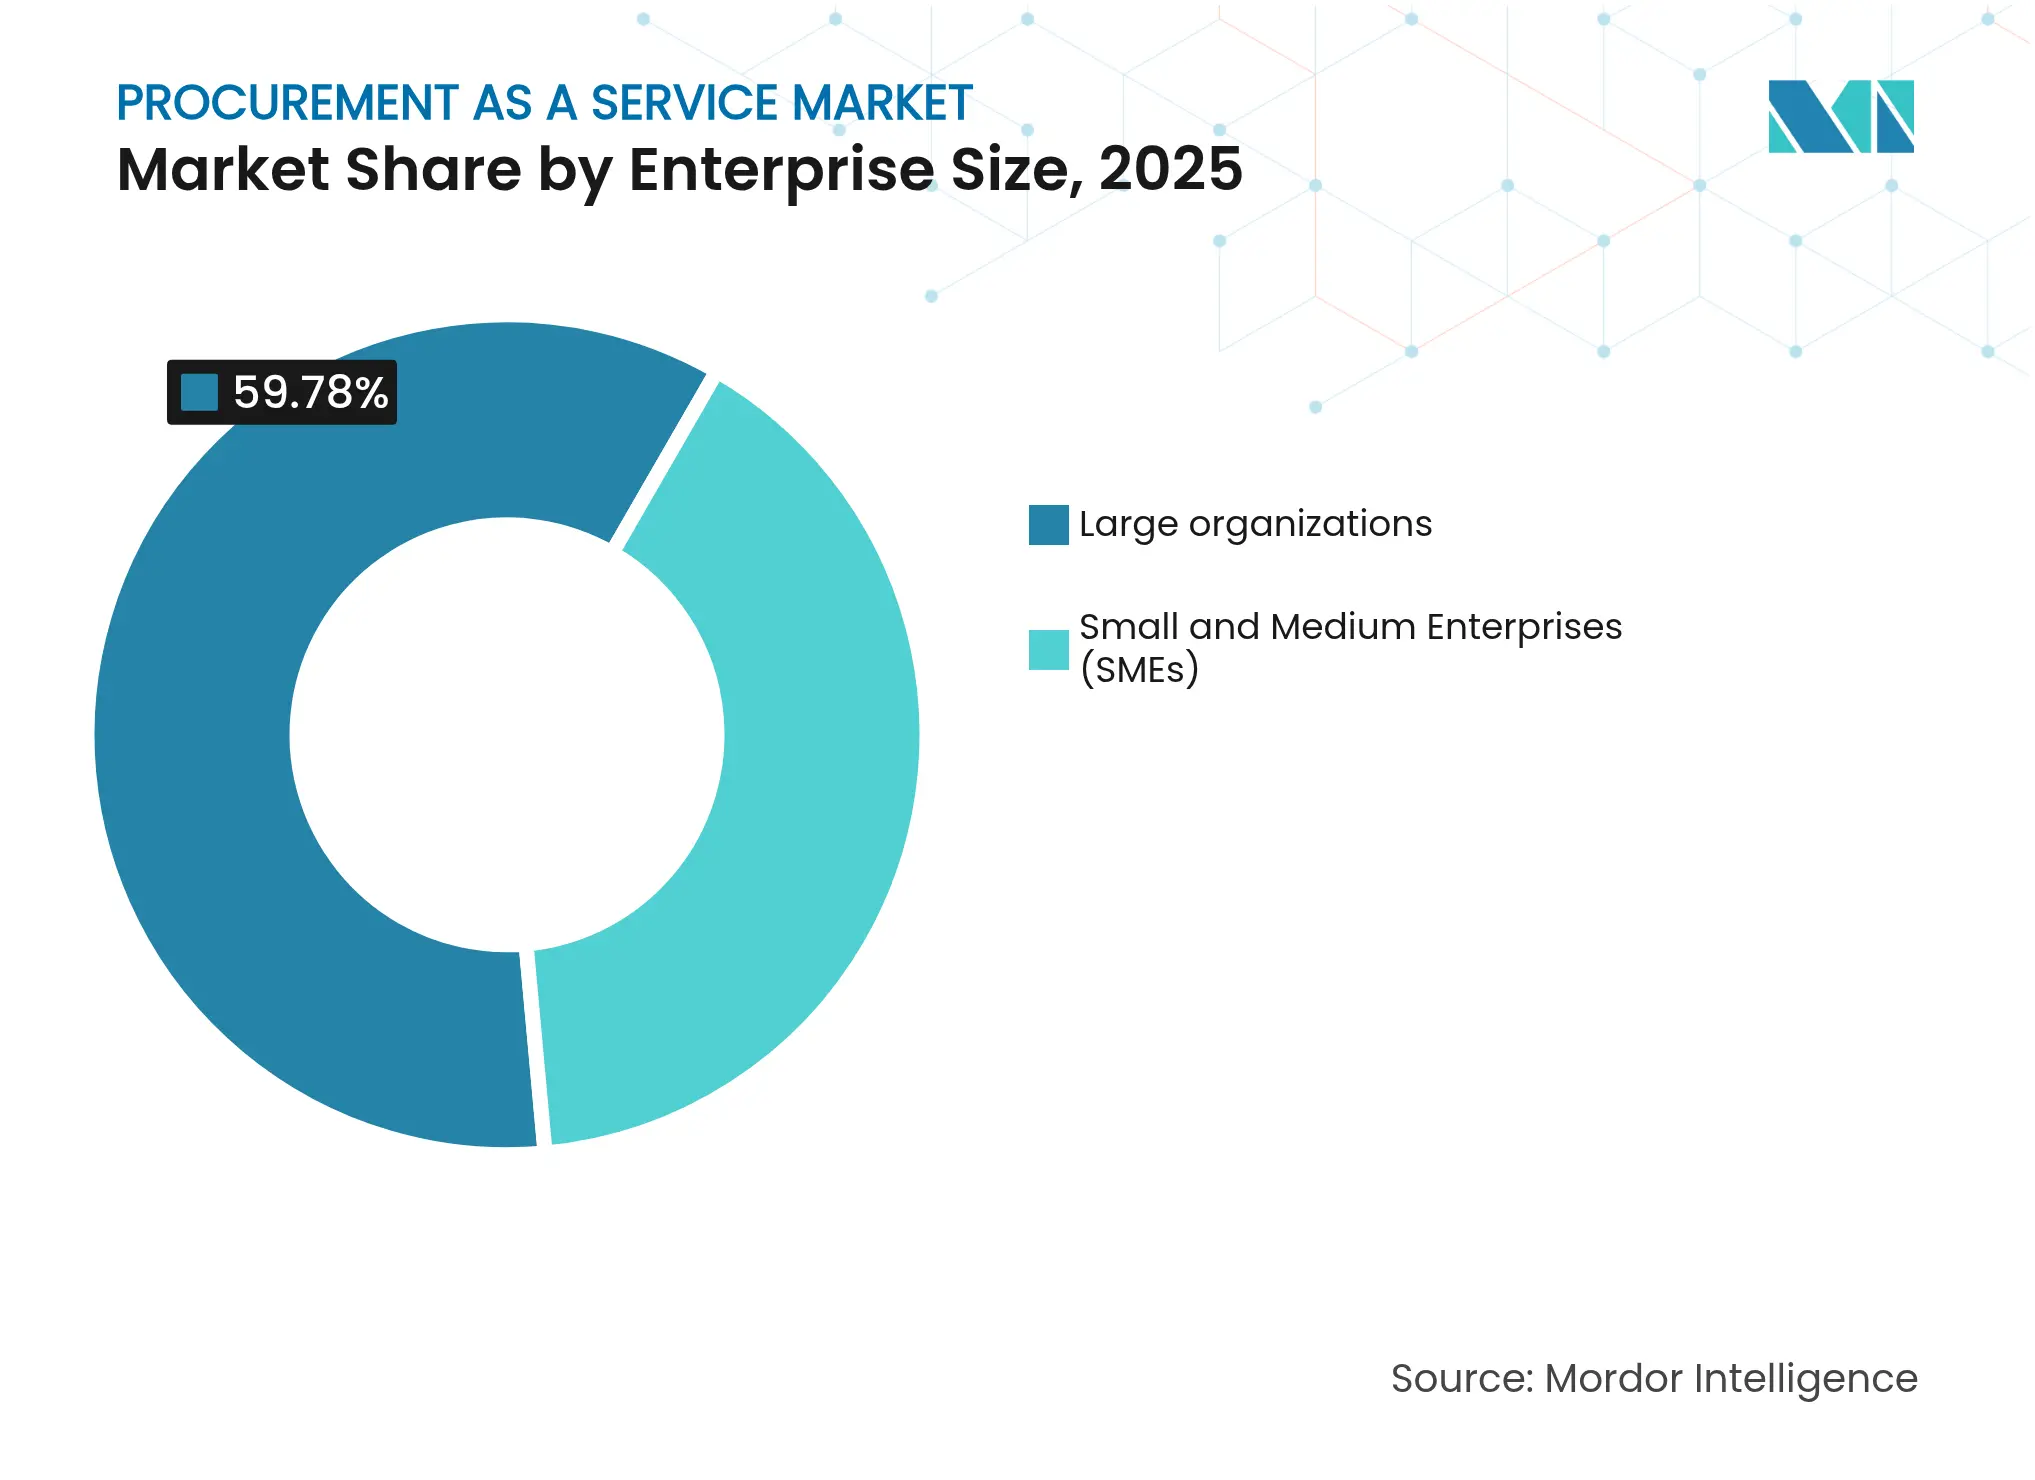
By Enterprise Size: SME Growth Challenges Large-Enterprise Dominance
Large organizations still delivered 59.78% of revenue in 2025, reflecting complex global supply chains and multi-billion-dollar spend pools. Nonetheless, SMEs represent the fastest-growing user group at 13.88% CAGR, driven by cloud subscriptions that package best-practice workflows, catalogs, and AI analytics out of the box.
SMEs leverage procurement outsourcing to unlock discounts historically unavailable due to lower volumes, narrowing the competitive pricing gap with conglomerates. Providers refine onboarding playbooks that cut time-to-value to weeks rather than quarters, allowing SMEs to pivot scarce resources toward product innovation and market expansion.
Note: Segment shares of all individual segments available upon report purchase
By End-Use Industry: Manufacturing Leadership Faces Healthcare Disruption
Manufacturing retained the largest customer slice at 23.95% in 2025 because large bill-of-materials structures magnify savings from category consolidation and supplier rationalization. The Procurement-as-a-service market size for healthcare, however, is forecast to soar at 15.26% CAGR to 2031. Hospitals outsource to enhance compliance with device-traceability rules and reduce inventory carrying costs for high-value implants.
Energy and utilities also accelerate outsourcing adoption to meet scope-3 reporting obligations, while financial-services firms seek third-party risk management that aligns with stringent vendor-oversight standards. Across verticals, providers differentiate by blending domain expertise with AI-enabled demand planning, tailoring playbooks for each sector’s regulatory and operational nuances.
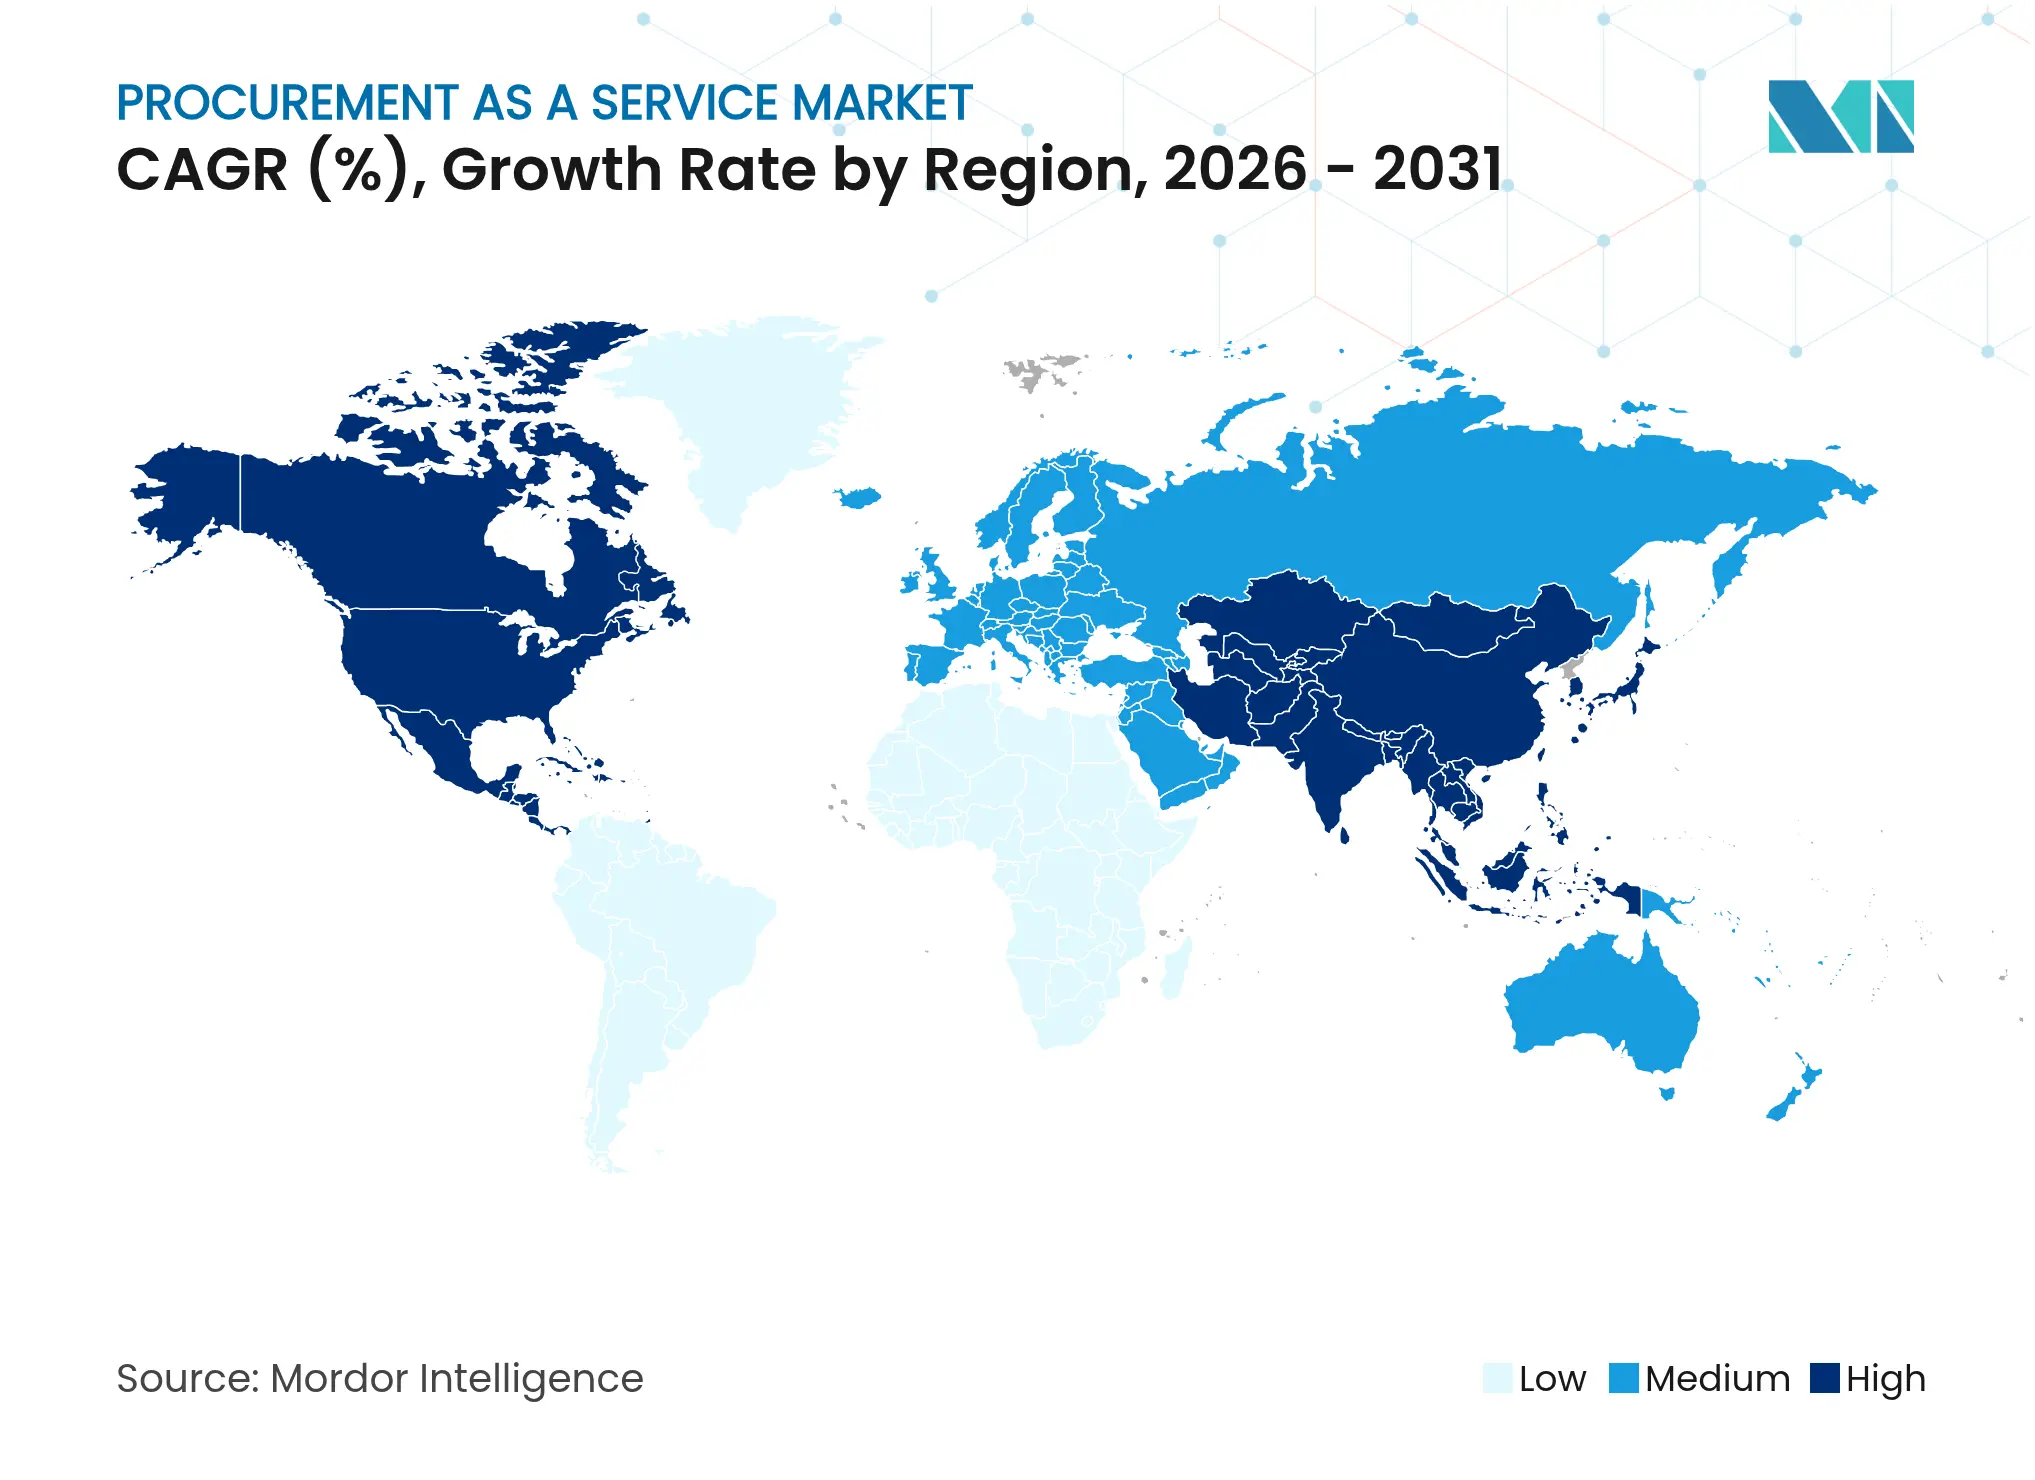
North America retained 39.22% share in 2025, supported by early adopter enterprises, abundant digital-talent pools, and federal modernization drives that embed outcome-based contracts in public procurement. Cloud penetration exceeds 80% among Fortune 1000, creating fertile ground for bundled analytics and ESG add-ons. Providers also benefit from entrenched supplier data networks that streamline benchmarking across industries.
Asia-Pacific recorded the fastest CAGR at 14.91% to 2031 as manufacturers in China, India, and Southeast Asia leapfrog legacy systems by embracing cloud-first procurement suites. Japanese multinationals rely on regional outsourcers to navigate language and regulatory complexity while orchestrating inbound component flows for automotive and electronics clusters. Government incentives that promote digital supply-chain transparency further spur investment, positioning the region as a growth engine for the Procurement-as-a-service market.
Europe posts steady expansion anchored in stringent ESG regulations that force companies to map supply-chain emissions and human-rights compliance beyond tier-1 suppliers Sievo. Outsourcers gain traction by layering sustainability analytics onto established category-management workflows. Latin America’s emergence is tied to near-shoring, with Mexico and Brazil absorbing demand from North American clients seeking freight-time reductions and tariff avoidance. Local providers form joint ventures with global firms to combine cultural proximity with advanced AI toolkits.
Market Concentration
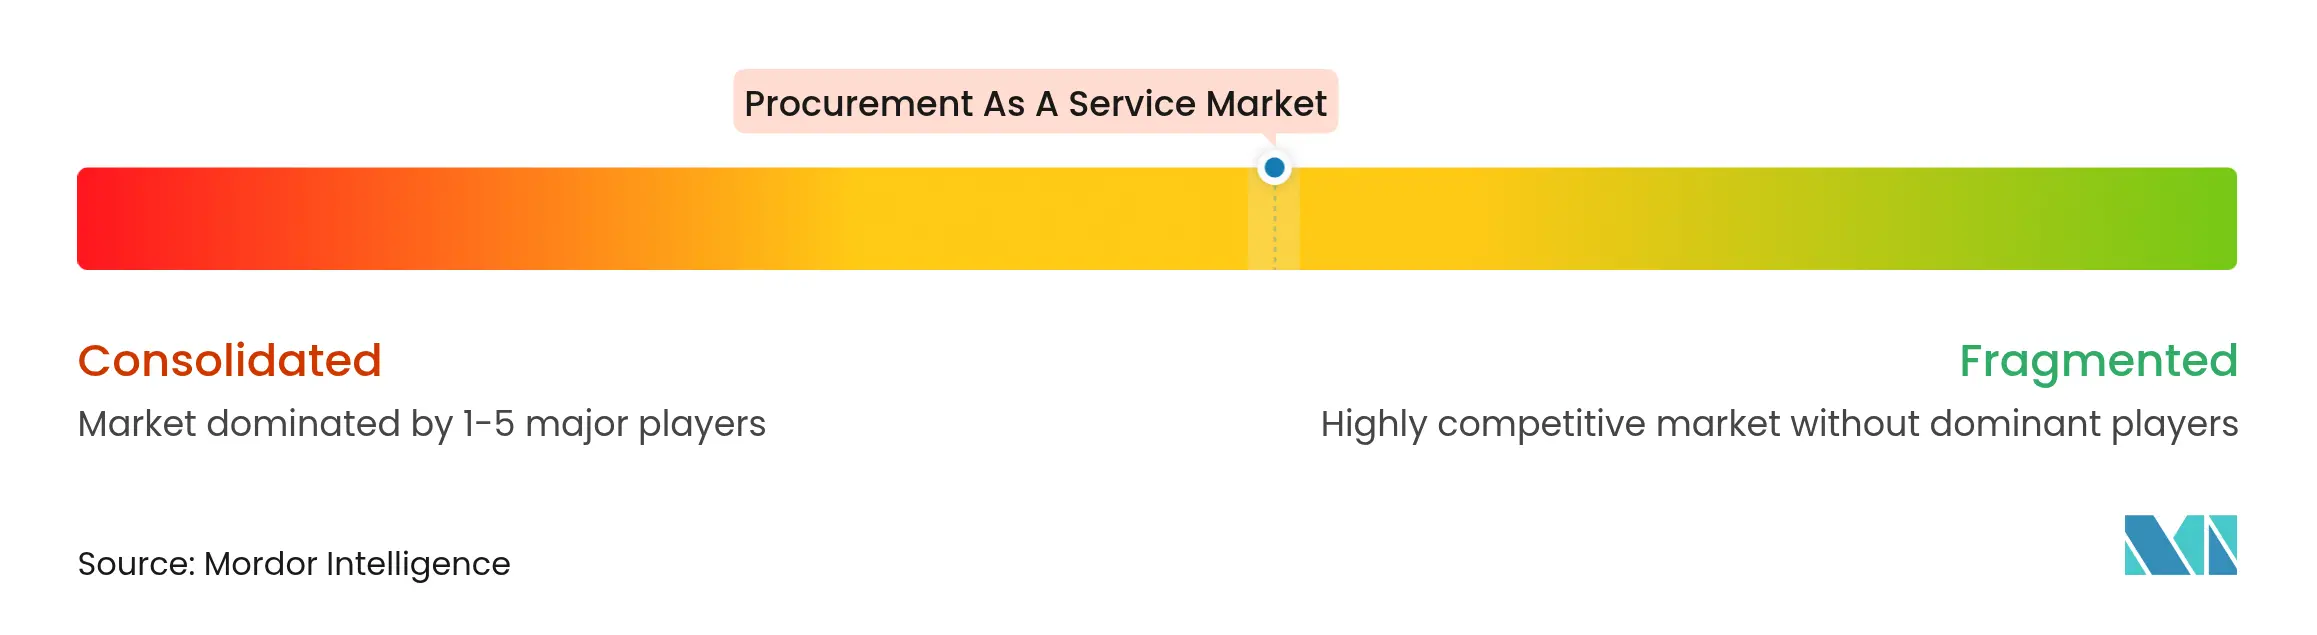
The market remains moderately fragmented. Accenture, IBM, and GEP Worldwide anchor the top tier with AI-infused platforms that weave software and managed services into unified value propositions. Collectively they hold an estimated mid-40% revenue share, leaving headroom for niche specialists that tailor offerings to healthcare, energy, or regional compliance needs. Technology service majors such as TCS, Wipro, and HCL Technologies extend from IT outsourcing into procurement, intensifying price and innovation pressure.
Competition increasingly centers on platform sophistication and ability to embed generative AI that turns unstructured spend data into strategic scenarios. GEP’s USD 1.3 billion revenue underscores the potency of a software-plus-services model that locks clients into long contracts through continuous capability releases. Boutique providers compete through localized market knowledge, agile governance, and outcome-based pricing that shares realized savings. MandA activity focuses on acquiring AI analytics firms and ESG data specialists to round out end-to-end suites.
Emerging battlegrounds include healthcare device sourcing, renewable-energy supply chains, and defense categories where compliance filters raise barriers to entry. Providers that cultivate deep domain pools and certified category experts strengthen customer stickiness, while laggards risk relegation to subcontractor roles supplying labor rather than strategic guidance.

*Disclaimer: Major Players sorted in no particular order
1. INTRODUCTION
2. RESEARCH METHODOLOGY
3. EXECUTIVE SUMMARY
4. MARKET LANDSCAPE
5. MARKET SIZE AND GROWTH FORECAST (VALUE)
6. COMPETITIVE LANDSCAPE
7. MARKET OPPORTUNITIES AND FUTURE OUTLOOK
Market Definitions and Key Coverage
Segmentation Overview
Detailed Research Methodology and Data Validation
Primary Research
Desk Research
Market-Sizing & Forecasting
Data Validation & Update Cycle
Why Mordor's Procurement As A Service Baseline Remains Dependable
Benchmark comparison
| Market Size | Anonymized source | Primary gap driver | ||
|---|---|---|---|---|
USD 9.82 B (2025) | Mordor Intelligence | - | Anonymized source:Mordor Intelligence | Primary gap driver:- |
USD 7.53 B (2025) | Global Consultancy A | Excludes transaction management fees; limited SME coverage | ||
USD 6.91 B (2025) | Industry Journal B | Uses 2023 currency rates without inflation adjustment | ||
USD 9.40 B (2025) | Regional Consultancy C | Bundles standalone SaaS seats with managed services |
Pricing Strategy for Semiconductor Components
3 Min Read
Accelerating Additive Manufacturing Adoption in India
3 Min Read
Unlocking Saudi Arabia’s Regional Tourism Growth Potential
5 Min Read
When decisions matter, industry leaders turn to our analysts. Let’s talk.