
India IT Hardware Market Size and Share
Market Overview
| Study Period | 2020 - 2031 |
|---|---|
| Forecast Data Period | 2026 - 2031 |
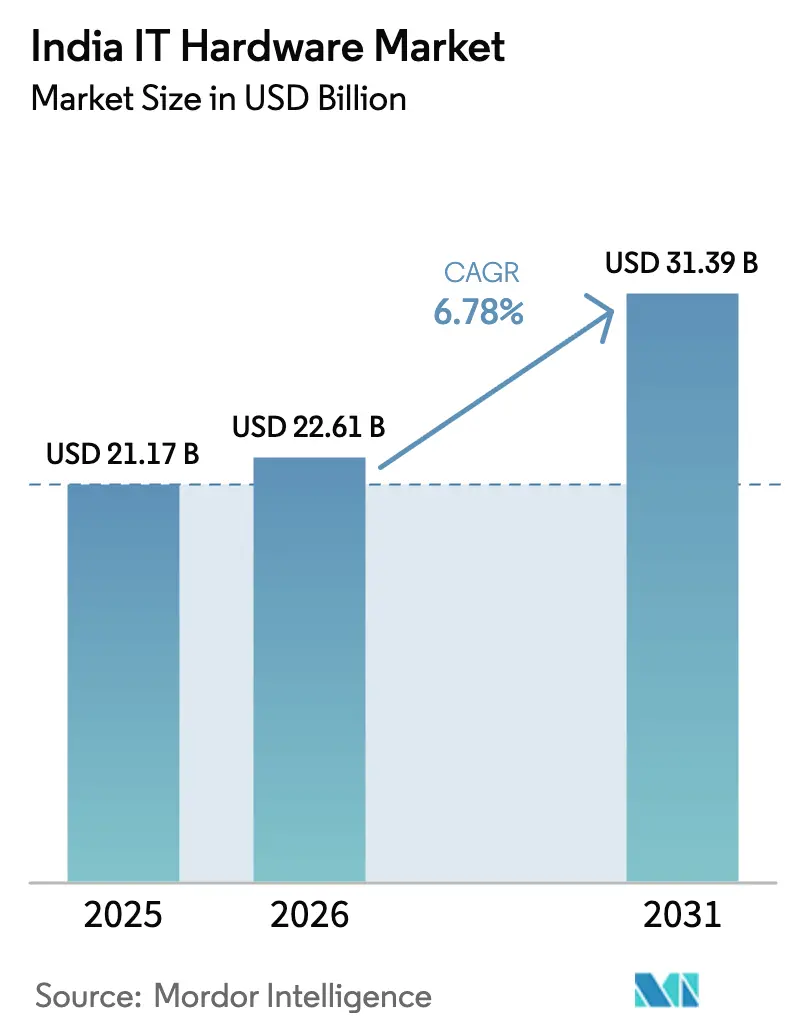
| Base Year Market Size (2025) | USD 21.17 Billion |
| Market Size (2026) | USD 22.61 Billion |
| Market Size (2031) | USD 31.39 Billion |
| Growth Rate (2026 - 2031) | 6.78 % |
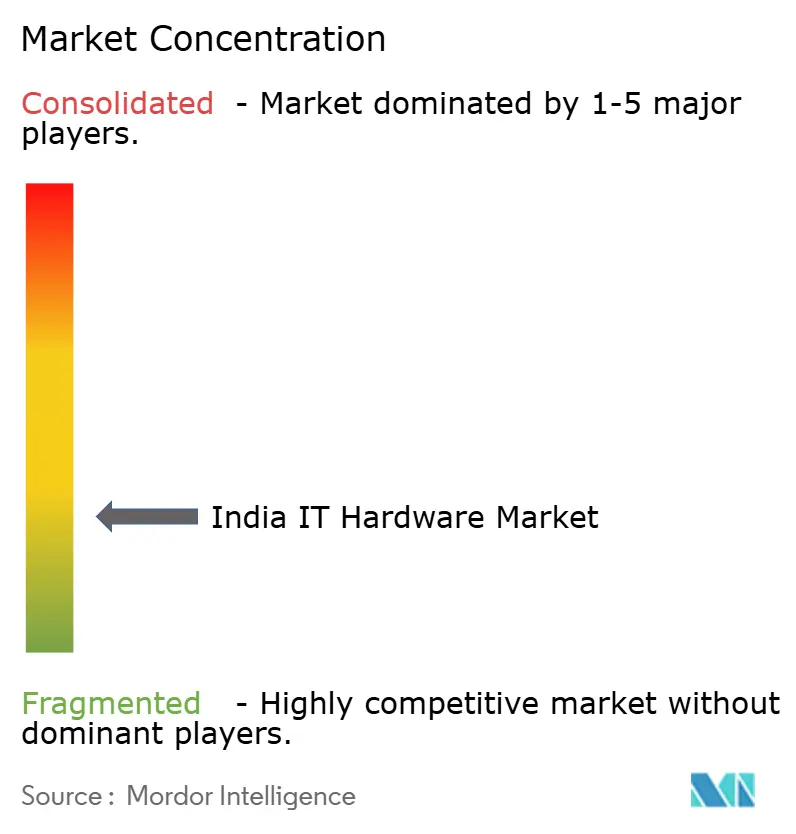
| Market Concentration | Low |
Major Players *Disclaimer: Major Players sorted in no particular order Image © Mordor Intelligence. Reuse requires attribution under CC BY 4.0. | |
India IT Hardware Market Analysis by Mordor Intelligence
India IT Hardware Market size in 2026 is estimated at USD 22.61 billion, growing from 2025 value of USD 21.17 billion with 2031 projections showing USD 31.39 billion, growing at 6.78% CAGR over 2026-2031. The growth path reflects rising enterprise digitization, persistent hybrid-work demand, and policy-led incentives that are localizing production at scale. Government backing through the Production Linked Incentive (PLI) 2.0 program has already attracted investments exceeding INR 1.61 lakh crore (USD 19.3 billion) and enabled electronics output worth INR 14 lakh crore (USD 168 billion).[1]India Semiconductor Mission, “Semicon India 2025,” ism.gov.in Foxconn alone more than doubled its domestic workforce to 80,000 employees and crossed USD 20 billion in India revenue in fiscal 2024-25, demonstrating how contract manufacturers are shifting global supply chains toward India. Edge data-center builds outside the four metros, AI-optimized infrastructure orders from enterprises, and a mandated 5% annual reduction in laptop imports beginning 2025 have further accelerated local demand for servers, storage, and PCs. Supply-chain resilience is emerging as a strategic differentiator as indigenous alliances, such as Tata Electronics’ tie-up with Powerchip Semiconductor Manufacturing Corporation and Himax Technologies, reduce the current 60-65% import dependence for display components.
Key Report Takeaways
- By product type, PCs and workstations maintained a 42.08% share trajectory, whereas enterprise storage captured 8.08% CAGR growth leadership through 2031.
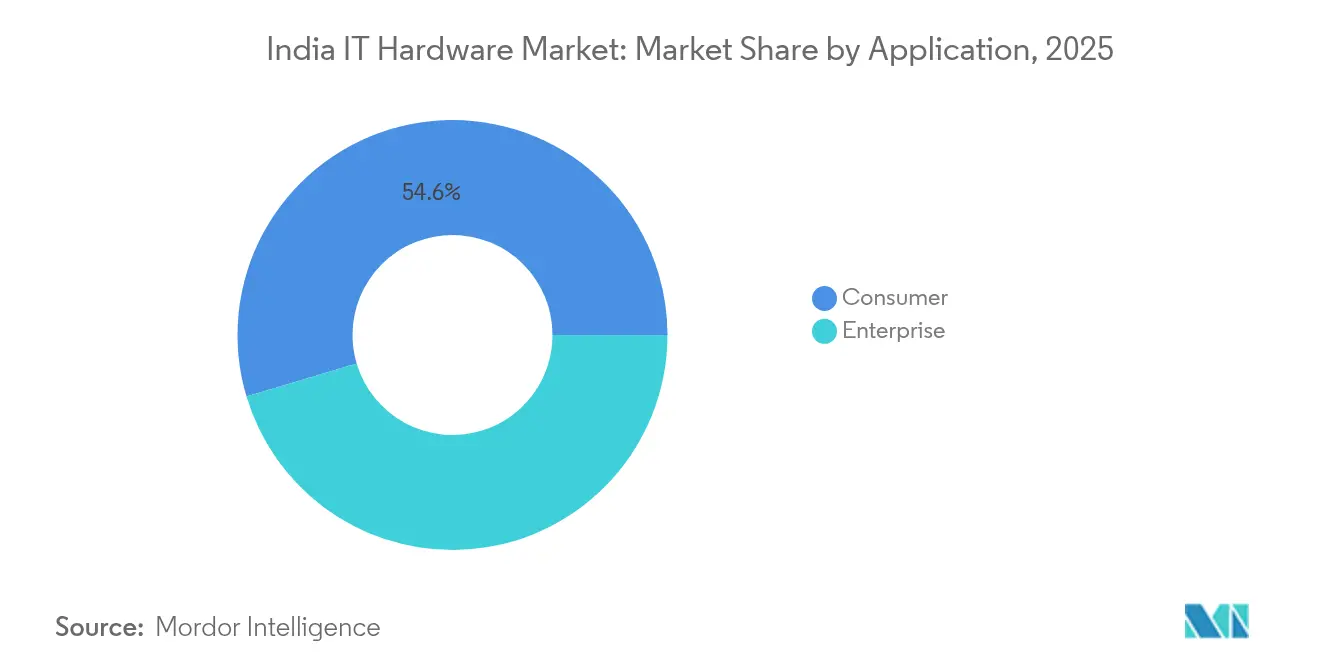
- By application, consumer retained the 54.62% revenue share of the India IT Hardware market size in 2025, whereas enterprise accounted for the fastest expansion at 7.65% CAGR through 2031.
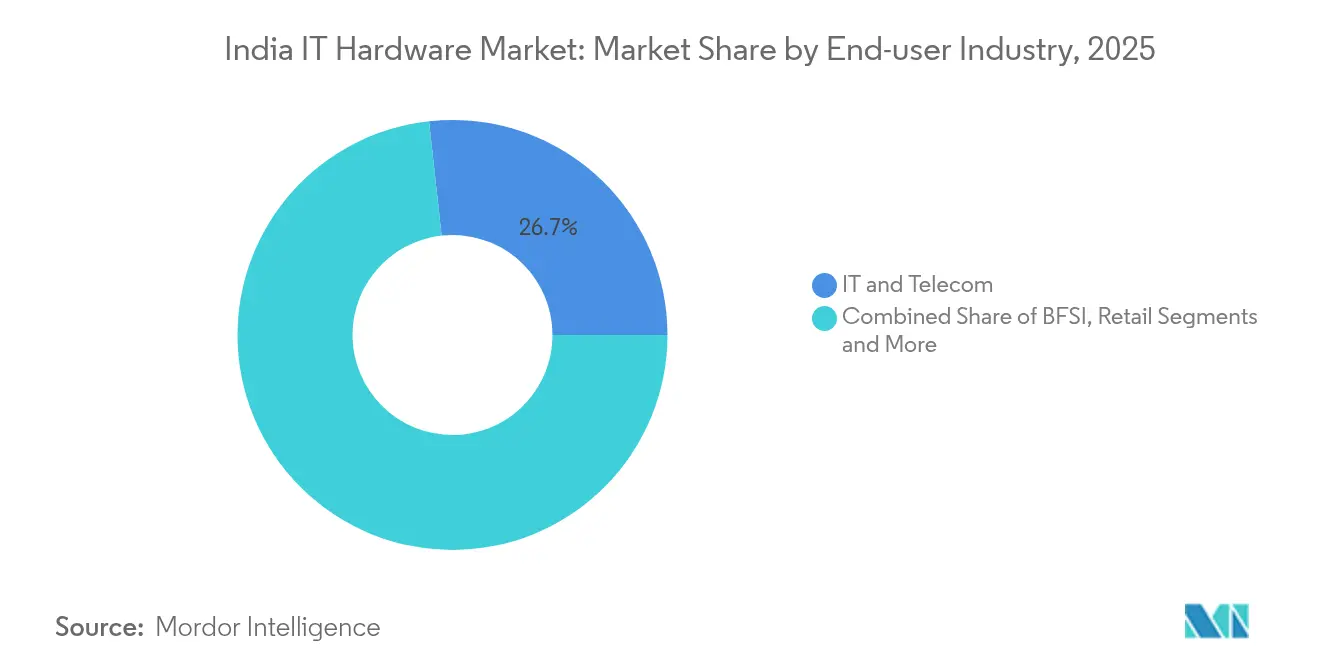
- By end-user industry, IT and Telecom held a 26.74% share of the India IT Hardware market size in 2025, whereas retail recorded the highest 7.12% CAGR through 2031.
- By region, South India led with 42.70% of the India IT Hardware market share in 2025, whereas East India commanded 8.25% through 2031.
Note: Market size and forecast figures in this report are generated using Mordor Intelligence’s proprietary estimation framework, updated with the latest available data and insights as of 2026.
Worldwide, activity is shaped by contributions from multiple countries and regions, with India representing one among them. The global report on it hardware market by Mordor Intelligence reflects how these countries and regional layers combine into a single system.
India IT Hardware Market Trends and Insights
Drivers Impact Analysis*
| Driver | (~) % Impact on CAGR Forecast | Geographic Relevance | Impact Timeline |
|---|---|---|---|
| Rapid growth in laptop demand under hybrid-work policies | + 1.1% | National, with concentration in metros and Tier-1 cities | Short term (≤ 2 years) |
| Elevated need for high-performance computing in AI workloads | +1.3% | National, with early gains in Bangalore, Hyderabad, Chennai | Medium term (2-4 years) |
| Public-sector digitization push via Digital India and NIC projects | +0.9% | National, with focus on rural and semi-urban areas | Long term (≥ 4 years) |
| Make-in-India incentives for local PC/server manufacturing (PLI 2.0) | +1.0% | South India, West India with spillover to North India | Medium term (2-4 years) |
| Rising demand for edge data-centre servers in Tier-2 cities | +0.6% | Tier-2 cities across all regions | Medium term (2-4 years) |
| Corporate ESG mandates favour energy-efficient hardware | +0.4% | National, with early adoption in large enterprises | Long term (≥ 4 years) |
| Source: Mordor Intelligence | |||


Elevated Need for High-Performance Computing in AI Workloads
Enterprise AI projects require 3-5 times more compute capacity than traditional applications, pushing firms to specify accelerators, advanced memory, and liquid cooling even for mid-range racks. Dell Technologies projects USD 15 billion in AI server revenue in fiscal 2025, up from USD 10 billion a year earlier.[2]Joseph Kovar, “NetApp Leads AI Innovation,” crn.com Ola’s partnership with Lenovo to build Krutrim 3, a 700-billion-parameter model, necessitates India’s largest supercomputer and an initial INR 2,000 crore (USD 240 million) hardware outlay. Such flagship deployments set procurement baselines that ripple into Tier-2 enterprises, increasing the India IT Hardware market’s average selling price and shifting vendor roadmaps toward purpose-built AI nodes.
Make-in-India Incentives for Local PC/Server Manufacturing (PLI 2.0)
The PLI framework offers 4-6% incremental incentive on net incremental sales of locally manufactured PCs and servers, encouraging global OEMs to relocate higher-value assembly lines. Dixon Technologies invested USD 115 million in Tamil Nadu to manufacture HP notebooks, with output slated at 2 million laptops annually. Lenovo targets 100% local PC production and plans to assemble AI servers domestically, cutting a USD 10.1 billion laptop import bill that previously constrained foreign-exchange reserves. Early localization also seeds ancillary component ecosystems. Foxconn has committed USD 1 billion for display module assembly in Tamil Nadu, reducing dependence on East Asian imports.
Public-Sector Digitization Push via Digital India and NIC Projects
Government buying criteria now emphasize total cost of ownership, local value addition, and long-term service reliability over lowest upfront bids. The INR 15,000 crore (USD 1.8 billion) TCS-BSNL program to establish four hyperscale data centers illustrates how procurement volumes for servers, storage, and networking migrate toward vendors with domestic manufacturing credentials. IBM’s new Lucknow lab, focusing on Generative and Agentic AI, deepens regional skills, attracting hardware suppliers that bundle integrated AI stacks. These projects accelerate refresh cycles in state departments and public sector enterprises, sustaining demand for ruggedized devices and edge servers engineered for India’s power and climate realities.
Rising Demand for Edge Data-Center Servers in Tier-2 Cities
India’s installed data-center capacity is expected to rise from 950 MW in 2024 to 1,800 MW by 2026, with 30% of new racks landing in Tier-2 cities. CtrlS committed INR 400 crore (USD 48 million) for a Patna edge facility designed for low-latency workloads serving Bihar and neighboring states, indicating that proximity computing is moving beyond metro clusters. OEMs are responding with compact, dust-resistant chassis and advanced telemetry for unmanned sites, opening new product adjacencies in KVM-less management modules and battery-free UPS hardware. The pivot expands the India IT Hardware market’s addressable base by tapping enterprises previously limited by latency and bandwidth.
Restraints Impact Analysis*
| Restraint | (~) % Impact on CAGR Forecast | Geographic Relevance | Impact Timeline |
|---|---|---|---|
| Escalating e-waste compliance costs | -0.6% | National, with higher impact in manufacturing hubs | Short term (≤ 2 years) |
| Semiconductor supply-chain volatility | -0.9% | National, with critical impact on assembly operations | Medium term (2-4 years) |
| Persistent grey-market imports in peripherals | -0.4% | National, with concentration in urban markets | Short term (≤ 2 years) |
| Slow enterprise refresh cycles in public-sector tenders | -0.5% | National, with focus on government and PSU segments | Long term (≥ 4 years) |
| Source: Mordor Intelligence | |||
Semiconductor Supply-Chain Volatility
India still imports 65-70% of its semiconductors, exposing manufacturers to volatile DRAM and NAND pricing that rose 15-20% over 2024-25.[3]Ankita Garg, “India’s first homegrown semiconductor chip by 2025,” indiatoday.in Local fabrication will not ship commercial wafers until Tata-PSMC’s Gujarat fab comes online in late 2025, prompting OEMs to hold larger safety stocks and hedge currency in component sourcing. High-performance GPUs remain the tightest node, stretching lead times to 52-60 weeks and stalling AI server rollouts. The bottleneck inflates working capital needs and dampens margin profiles, carving 90 basis points off the projected India IT Hardware market CAGR.
Escalating E-Waste Compliance Costs
Formal recyclers handle only 16-43% of India’s 3.8-4.1 million MT annual e-waste stream, pushing regulators to raise Extended Producer Responsibility (EPR) surcharges to INR 22 per kg for consumer electronics and INR 34 per kg for smartphones. Compliance now adds 2-8% to unit production costs, especially painful for contract assemblers running low-margin consumer hardware lines. OEMs must fund collection centers or partner with recyclers whose capacity remains limited in Tier-2 cities, elevating logistics complexity and offsetting part of the PLI incentive gains.
*Our forecasts treat driver/restraint impacts as directional, not additive. The impact forecasts reflect baseline growth, mix effects, and variable interactions.
Segment Analysis
By Product Type: Enterprise Storage Drives AI Infrastructure Boom
Enterprise storage accounted for the fastest 8.08% CAGR through 2031 as enterprises deployed AI-optimized arrays and NVMe-over-Fabrics architectures. NetApp’s hybrid-cloud revenue reached USD 5.66 billion in fiscal 2024, and its AIPod reference design became a blueprint for domestic data-center upgrades. Servers followed at 7.18% CAGR, fueled by edge deployments and public-sector demand. PCs and workstations maintained a 6.94% CAGR, buttressed by hybrid-work refreshes. The India IT Hardware market size for enterprise storage represented a significant share, while PCs retained 42.08% of the India IT Hardware market share. Printers and copiers trailed, reflecting digital document workflows and cloud forms adoption. Vendors integrated AI-inference accelerators inside notebooks to protect ASPs, signaling the convergence of client and server design philosophies.
The evolution also reshaped value chains. Component suppliers focusing on PCIe 5.0 controllers and CXL-ready DIMMs secured longer-term orders as hyperscalers demanded deterministic latency. Networking hardware pivoted toward software-defined overlays, cannibalizing traditional chassis switch revenues but opening opportunities in secure SD-WAN appliances tuned for branch edge. The shift enlarged the India IT Hardware market as consumption moved from capex purchases to hybrid device-plus-subscription bundles.



By Application: Consumer Dominance Meets Enterprise Acceleration
Consumer applications commanded a 54.62% share, underscoring India's swift embrace of technology, spurred by hybrid work models and a push for digital education. This consumer segment's lead is bolstered by India's youthful demographic, boasting over 600 million smartphone users, which in turn fuels a robust demand for related hardware like laptops, tablets, and peripherals. Thanks to PLI scheme incentives, device costs have dropped, and local availability has surged. Notably, HP has rolled out competitively priced AI-enhanced laptops, integrated with Microsoft Copilot, starting at INR 99,999 (USD 1,200). Meanwhile, enterprise applications are on a rapid ascent, projected to grow at a 7.65% CAGR through 2031, fueled by corporate shifts towards digitalization and hefty investments in AI infrastructure.
By End-user Industry: Retail Transformation Leads Hardware Adoption
Retail led with a 7.12% CAGR as omnichannel pivots forced chains to install IoT-enabled shelves, AI checkout kiosks, and real-time inventory servers. Roughly 80% of medium-sized retailers plan to expand AI-based analytics in 2025, translating to orders for GPU-enabled edge appliances and handheld scanners. IT and Telecom followed at 7.01% CAGR, powered by 5G rollouts and network-core modernizations; Airtel and Jio earmarked USD 2 billion for equipment upgrades. BFSI trailed at 6.88% CAGR, still substantial due to RBI compliance and digital-banking pushes. Other verticals, including manufacturing and healthcare, are provisioning IoT gateways and rugged tablets for shop-floor analytics, broadening hardware SKUs sold into non-traditional segments, and deepening the India IT Hardware market footprint.
Geography Analysis
South India continues to anchor manufacturing, bolstered by cumulative commitments exceeding INR 10 lakh crore (USD 120 billion) since 2021. Tamil Nadu’s electronics policy offers 30% capital subsidies, helping Dixon and Pegatron accelerate laptop and smartphone lines. Bengaluru hosts the highest concentration of AI chip design centers, ensuring local access to specialized talent that shortens product-development lifecycles. Contracts such as Foxconn’s iPhone enclosure project at Oragadam Industrial Park extend value capture beyond final assembly into precision machining.
North India’s proximity to federal ministries keeps it central to public-sector spending. The Digital India e-Governance stack is expected to award over USD 3 billion in IT hardware tenders between 2025-27, including rugged tablets for field-level agencies. IBM’s Lucknow lab gives the state its first Fortune 500 R&D center focused on Generative AI, drawing peripheral hardware suppliers seeking co-design opportunities. Data localization rules enacted in 2025 further stimulate server installations in NCR colocation sites.
East India’s rise hinges on strategic logistics routes to Southeast Asia via Kolkata port and the upcoming deep-sea terminal at Dhamra. CtrlS’s Patna edge facility, built to Tier-4 standards, exemplifies how lower-cost real estate offsets transmission-loss overheads, enabling hyperscale economics outside traditional hubs. State-level incentives on stamp duty and power tariffs strengthen the business case for greenfield plants, positioning East India to capture incremental export-oriented orders as China+1 strategies mature.
West and Central India combine industrial demand from auto and petrochemical majors with financial-services IT refreshes in Mumbai. The upcoming Mumbai–Ahmedabad high-speed rail corridor is expected to spur suburban data-center campuses linked via dark fiber, improving redundancy for disaster-recovery sites. Gujarat’s emerging semiconductor cluster around Dholera, led by Tata-PSMC, promises localized wafer supply, mitigating part of the supply-chain volatility by 2027.
Regulatory Landscape
India’s IT hardware market is shaped by Make-in-India incentives alongside tighter product compliance and import governance led by the Ministry of Electronics and Information Technology (MeitY) and enforcement agencies. The Production Linked Incentive (PLI) 2.0 program for IT hardware remains a key operating framework for OEM and EMS localization decisions, while electronics-sector incentive disbursements reached INR 15,554 crore as of March 2026, reinforcing the link between domestic manufacturing, sales, and eligibility.
On the compliance side, MeitY’s Compulsory Registration Order (CRO) framework is being enforced more actively at the border. In June 2026, the Central Board of Indirect Taxes and Customs (CBIC) issued Instruction No. 08/2026 and 09/2026 to tighten import checks for CRO-covered goods. The CRO timeline also adds product-specific obligations, including standalone hard disk drives, where compliance becomes legally mandatory from November 5, 2026. This increases the cost of non-compliance and pushes brands to align sourcing and labeling processes with Indian certification requirements.
Value Chain Analysis
India’s IT hardware value chain runs from upstream components (semiconductors, memory, storage media, displays, sensors, passives) to midstream manufacturing (PCB assembly, system integration, box-build, testing), then downstream distribution (national distributors, LFR and e-commerce channels, SI-led enterprise sales). After-sales service feeds into end-of-life collection and recycling under EPR. The domestic ecosystem is currently strongest in assembly and system integration, supported by PLI-linked scale-up by EMS and contract manufacturers, while high-value inputs such as semiconductors and displays remain import intensive, keeping lead times and pricing sensitive to global cycles.
Import dependency shows up most clearly in integrated circuits, where HS 8542 accounts for 23.7% of India’s total electronics imports, limiting localization beyond final assembly. To move value addition upstream, policy and industry actions are expanding capability in assembly, test, and packaging (OSAT/ATMP) and adjacent electronics manufacturing services. Companies such as Kaynes Electronics and CG Power are participating in OSAT development under incentive support. Parallel policy moves, including July 2026 customs-duty exemptions on select components for lithium-ion cells, inductor coil modules, and display assemblies, are intended to reduce input costs and broaden the addressable supplier base for locally manufactured systems.
Competitive Landscape
The India IT Hardware market remains moderately concentrated. HP, Dell, and Lenovo hold a significant share in PCs, while HPE, Dell, and Cisco lead enterprise servers and networking. HP retained 31.5% of PC unit shipments despite a 6.6% volume decline, demonstrating its pricing latitude in commercial accounts. Global players maintain R&D scale, yet contractual partnerships with Dixon, Foxconn, and Tata Electronics enable faster localization, trimming landed costs by 8-12% and protecting margins against currency swings. Foreign OEMs increasingly cede low-value assembly to domestic EMS partners while focusing on firmware, design, and channel enablement.
Vertical integration is reshaping strategic positions. Tata Electronics’ acquisition of Wistron’s operations, followed by a Himax partnership, extends its reach from chassis to display drivers, advancing toward a silicon-to-systems stack. Foxconn’s diversification into display modules and potential semiconductor back-end operations illustrates similar moves to lock in component security. Lenovo’s intent to assemble AI servers locally gives it a first-mover advantage in premium infrastructure bids, particularly in public-sector HPC clusters.
Disruptive entrants are emerging. Indkal Technologies, licensed to build Acer smartphones, targets the INR 15,000-50,000 (USD 180-600) bracket once dominated by Chinese brands, underscoring how local branding plus manufacturing incentives can upend existing value hierarchies.[5]Gulveen Aulakh, “Indkal licensing pact,” livemint.com Channel ecosystems are consolidating as partners add managed services to offset shrinking margins on hardware alone. Regulatory oversight by the Bureau of Indian Standards and MeitY standardizes quality levels, lowering entry barriers for smaller domestic brands to compete on features rather than mere compliance.
India IT Hardware Industry Leaders
Dell Inc.
Lenovo Group Ltd
ASUS Tek Computer Inc.
HP Inc.
Acer Inc.
- *Disclaimer: Major Players sorted in no particular order

Market Opportunities and Future Outlook
A near-term opportunity set is deeper localization of compute and data-center hardware stacks, where policy and procurement are converging on domestic sourcing and compliance. CBIC’s June 2026 instructions to strengthen border enforcement for MeitY’s CRO, together with the scheduled November 5, 2026 CRO compliance date for standalone hard disk drives, raises the premium for compliant, India-ready supply chains. This creates clearer whitespace for certified local assembly, test, and labeling operations across storage and server subassemblies.
A second opportunity comes from the government’s expanded semiconductor and electronics push in 2026, which strengthens upstream inputs for IT hardware manufacturing. In July 2026, the Union Cabinet approved India Semiconductor Mission (ISM) 2.0 with an outlay of INR 1.27 lakh crore, alongside a new Mobile Phone Manufacturing Scheme (MPMS) with an INR 62,500 crore outlay. MPMS explicitly incentivizes domestic sourcing and local product design and R&D, including up to 1.5% for domestic sourcing of key components and an additional 3% for local design and R&D. While MPMS is mobile-centric, the same component, EMS, and test-and-packaging capacity these programs catalyze can be leveraged by IT hardware OEMs and EMS firms as they broaden India-based production footprints and seek higher local value addition beyond box-build.
Recent Industry Developments
- June 2026: Dell Technologies announced that a majority of its servers sold in India are now manufactured domestically to support AI infrastructure and data sovereignty requirements. The change strengthens local supply chains and supports ongoing IT hardware localization in the Indian market.
- June 2026: ASUS reported that its local manufacturing in India is scaling to account for 30 percent of its India laptop sales in 2026, compared to 10 percent in 2025. The rising share of India-made laptops improves supply resilience and leverages local production incentives.
- June 2026: ASUS commenced local production of gaming laptops in India, targeting the TUF gaming series through a partnership with an EMS firm in Chennai. The rollout deepens EMS partnerships and expands the local product portfolio.


Research Methodology Framework and Report Scope
Market Definition and Coverage
For this study, the India IT hardware market is the value of physical computing equipment bought and deployed in India across consumer and enterprise use, reported as revenue at the point of sale (USD) during the study period.
Scope exclusions: This sizing does not count IT services, telecom connectivity, or pure software subscriptions that may be sold alongside hardware.
Segmentation Overview
- By Product Type
- PCs and Workstations
- Enterprise Networking Hardware
- Enterprise Storage Devices
- Servers
- Other Hardware (Printers and Copiers)
- By Application
- Consumer
- Enterprise
- SMEs
- Large Enterprises
- By End-user Industry
- BFSI
- Retail
- IT and Telecom
- Other End-user Industries
- By Region
- North India
- East India
- West and Central India
- South India
Data Sources, Market Sizing, and Validation
Desk Research
Desk research was used to set the market boundary, shape base demand indicators, and cross-check price and shipment direction before we locked the model. We referenced public sources such as MeitY releases, MOSPI national accounts and price statistics, the Directorate General of Commercial Intelligence and Statistics trade data, Telecom Regulatory Authority of India reports for enterprise connectivity context, and Reserve Bank of India macro series for currency and inflation assumptions.
To convert those signals into a usable sizing structure, we also reviewed company annual reports, investor presentations, and audited filings of relevant India-facing distributors and OEM subsidiaries, along with association publications such as NASSCOM and similar industry bodies. Where helpful, paid subscriptions for company financials and intelligence, news and financials, patent databases, and import-export shipment-level records were used to confirm timelines, product mix shifts, and reported revenue splits. This list is illustrative, and many other sources were also used for data collection, validation, and clarification.
Primary Interviews and Surveys
Primary work was used to test what the desk inputs could not reliably show, especially channel margins, typical discounting, and the split between direct enterprise deals and partner-led sales. We spoke with a mix of manufacturers, national and regional distributors, large system integrators, resellers, and enterprise IT buyers to check pricing logic and unit assumptions across north, south, west, and east demand centers.
Feedback from these conversations helped us refine product coverage, adjust average selling prices by procurement route (direct versus channel), and validate adoption drivers such as refresh cycles and data center capacity additions before final totals were signed off.
Distribution of primary research fieldwork respondents
| Company type | Respondent position |
|---|---|
| Top tier: 25% | CXOs: 16% |
| Mid tier: 58% | Functional/Unit leaders: 39% |
| Smaller Players: 17% | Managers: 45% |
Market-Sizing & Forecasting
Sizing starts with a top-down build where India demand is reconstructed from device and infrastructure spend pools, import and local-assembly signals, and category penetration across consumer and enterprise IT estates, then mapped into consistent product groups. Once this view was in place, we ran selective bottom-up checks using sampled price points and unit volumes, plus channel checks on large deal sizes, so totals could be corrected where the mix looked unrealistic.
The inputs that mattered most included PC and workstation replacement cycles, notebook versus desktop mix, enterprise network and storage refresh timing, data center capacity expansion indicators, import value and volume movement by relevant hardware headings, and INR to USD conversion timing for the base year. For forecasts, we used scenario analysis supported by simple multivariate relationships between macro demand drivers and category growth, then aligned scenario choice to what interviewees expected for procurement budgets, lead times, and discount behavior. When direct unit signals were weak for a niche category, we used a proxy such as attaching a conservative hardware share to a related spend pool, and then rechecked that assumption with channel participants.
Data Validation & Update Cycle
Outputs are validated through multiple checks so gaps do not slip through. Our team compares category totals against independent signals such as reported device shipments, import direction, and enterprise capex commentary, then flags sharp jumps that cannot be explained by a known driver.
If a variance is found, assumptions are reopened, and follow-up calls are triggered with the most relevant respondent type (for example, distributors for price realization, and enterprise buyers for refresh timing). A second analyst review is completed before sign-off to keep calculations, currency handling, and category mapping consistent. Reports are refreshed annually, and interim updates are made when material events affect pricing, availability, or demand, followed by a final pre-delivery pass to ensure the latest view is reflected.
Mordor Intelligence's India IT Hardware Market Size Compared With Other Published Estimates
Published market sizes for India IT hardware can look different even when they describe similar demand, because the included product sets, pricing points, and the year used for currency conversion are not always the same. Differences also come from whether a publisher values hardware at retail price, distributor sell-in, or end-customer purchase price, which shifts the final number even when unit volumes are similar.
The table shows a noticeable spread mainly because some estimates fold in consumer electronics-like devices or bundled software value, and a few rely on import values without fully adjusting for domestic assembly and channel margins. It also reflects that in Mordor Intelligence's model, only defined IT hardware categories are counted, and the base year is treated as 2025 with a consistent INR to USD conversion timing across categories.
Benchmark comparison
| Source | Market Size | Gaps in Research Methodology |
|---|---|---|
| Mordor Intelligence | USD 21.17 B (2025) | |
| Industry Association A | USD 19.20 B (2024) | Uses an industry revenue cut that mixes hardware with adjacent tech categories and applies a fiscal-year lens, which can understate hardware sold via non-member channels and misalign USD conversion timing. |
| Trade Publication B | USD 21.17 B (2025) | Often mirrors a single published headline without detailing product inclusion rules, channel price point, or how domestic assembly and reseller markups are handled, which limits repeatability. |
Taken together, the gap drivers are mostly about what gets counted as hardware, which price level is used, and whether fiscal-year reporting is blended into calendar-year USD sizing. By keeping the inputs tied to observable demand signals like refresh cycles, trade movement, and category mix, the model stays traceable and can be re-run when assumptions change.


Key Questions Answered in the Report
What is the current India IT Hardware market size?
The India IT Hardware market size stands at USD 22.61 billion in 2026.
How fast is the India IT Hardware market expected to grow?
The market is projected to expand at a 6.78% CAGR, reaching USD 31.39 billion by 2031.
Which product category shows the highest growth?
Enterprise storage leads with an 8.08% CAGR driven by AI data-center deployments.
How is policy impacting local manufacturing?
PLI 2.0 incentives and a mandated 5% yearly cut in laptop imports are pushing OEMs like HP, Lenovo, and Foxconn to localize high-value assembly lines.
Which region offers the strongest growth prospects?
East India records the highest regional CAGR at 8.25%, supported by new data-center and electronics manufacturing investments.
Page last updated on:


 Your data is secure and never sold or shared.


