Coconut Water Market Size and Share
Market Overview
| Study Period | 2021 - 2031 |
|---|---|
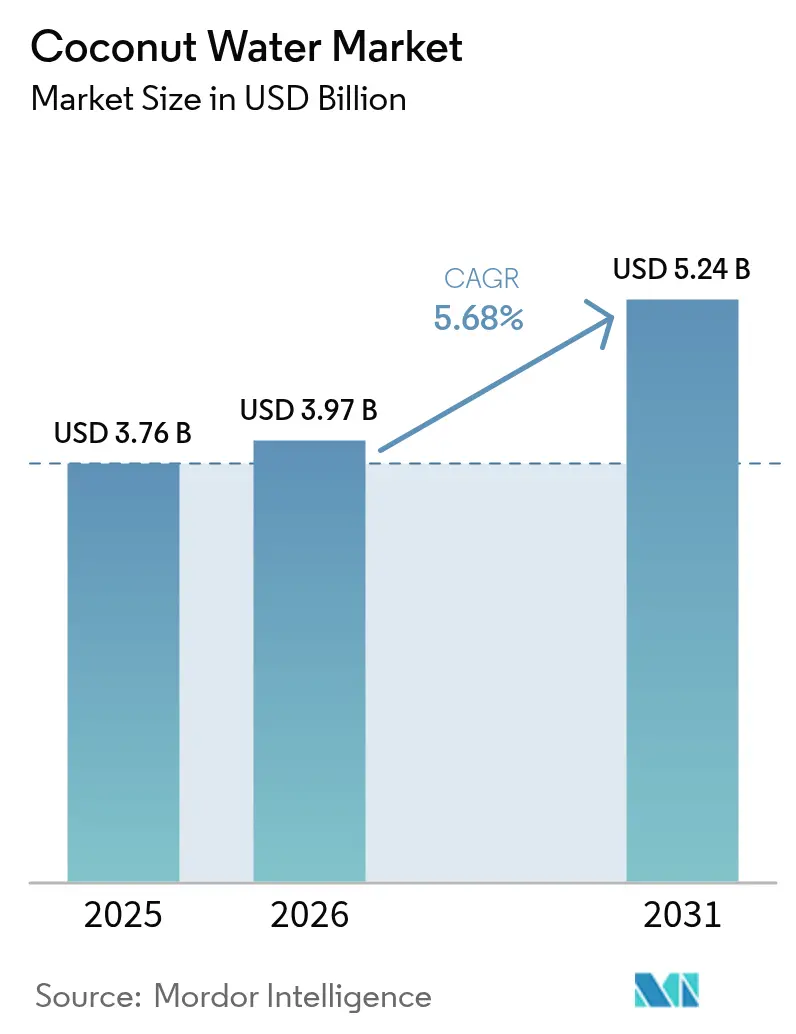
| Market Size (2026) | USD 3.97 Billion |
| Market Size (2031) | USD 5.24 Billion |
| Growth Rate (2026 - 2031) | 5.68% CAGR |
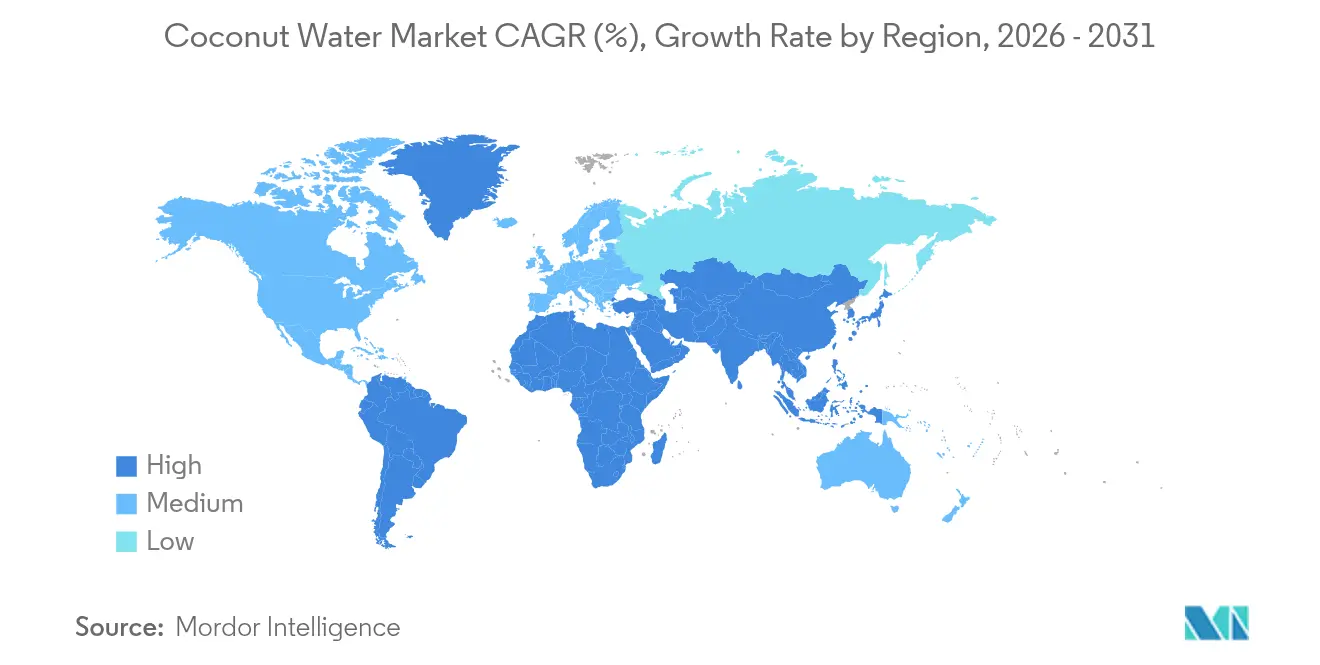
| Fastest Growing Market | Asia Pacific |
| Largest Market | North America |
| Market Concentration | Medium |
Major Players
*Disclaimer: Major Players sorted in no particular order Image © Mordor Intelligence. Reuse requires attribution under CC BY 4.0. |
|
Coconut Water Market Analysis by Mordor Intelligence
The coconut water market size was valued at USD 3.76 billion in 2025 and estimated to grow from USD 3.97 billion in 2026 to reach USD 5.24 billion by 2031, at a CAGR of 5.68% during the forecast period (2026-2031). Driven by health trends and evolving consumer preferences, global demand for coconut water is surging. As health consciousness rises, consumers increasingly favor natural beverages. Coconut water, rich in electrolytes, vitamins, and minerals, emerges as a healthier alternative to sugary sodas and synthetic energy drinks. This trend gains momentum with the ascent of plant-based and vegan lifestyles, which prioritize naturally sourced hydration. Innovations, from flavored variants to fortified options boasting added benefits and organic certifications, cater to varied tastes and wellness aspirations, broadening their demographic appeal. Additionally, advancements in packaging like ready-to-drink formats and eco-friendly materials not only enhance convenience but also resonate with sustainability values, drawing in environmentally conscious consumers. Brands have boosted their visibility and engaged consumers through aggressive marketing tactics, such as celebrity endorsements and social media campaigns.
Key Report Takeaways
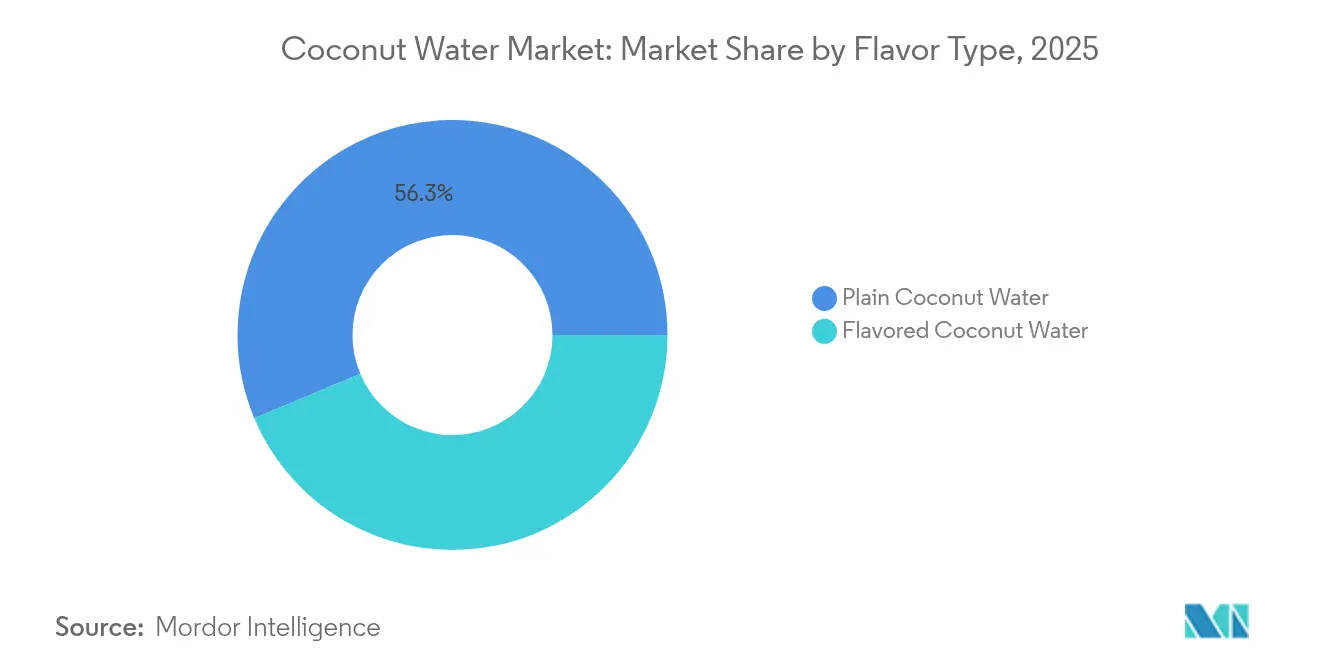
- By flavor type, plain variants held 56.32% of the market share in 2025, and flavored products are projected to expand at a 5.88% CAGR through 2031 in all major regions.
- By packaging, tetra pak formats held 52.15% of the shares in 2025, whereas PET/glass bottles are expected to grow at a 6.31% CAGR between 2026-2031.
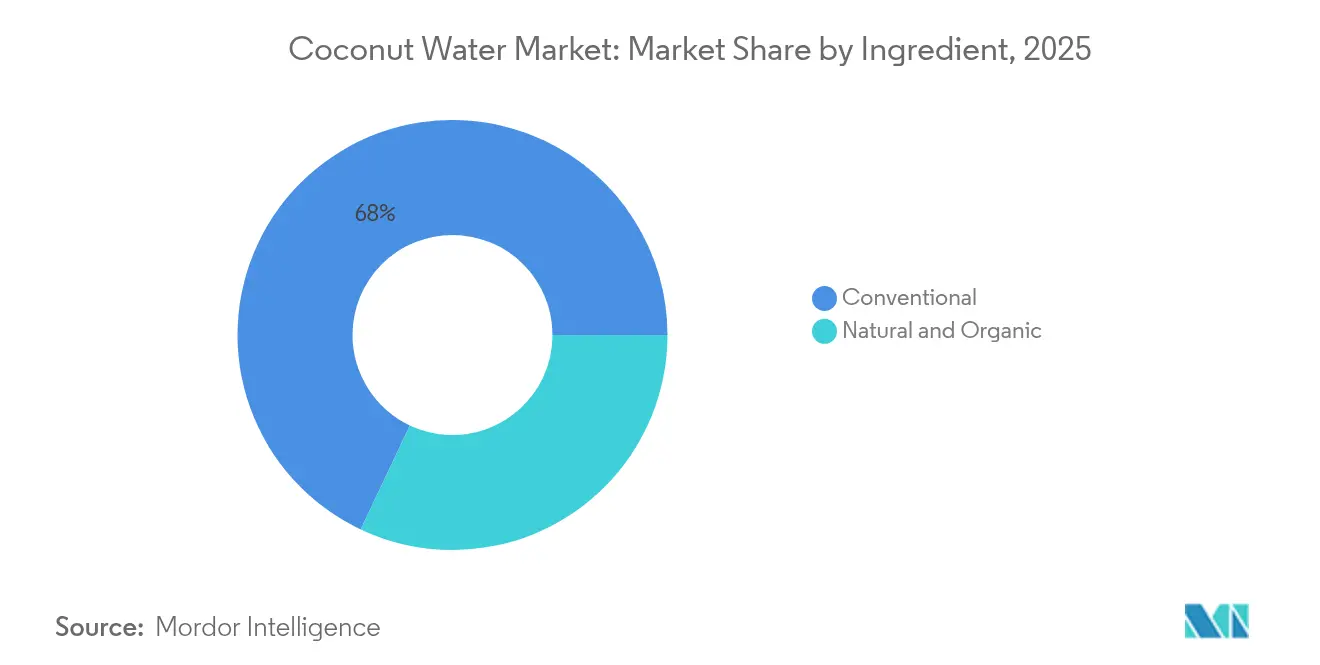
- By ingredient, the conventional segment held 67.98% of the market share in 2025; natural and organic is expected to reach a 6.74% CAGR through 2031.
- By distribution channel, supermarkets/hypermarkets contributed 56.95% share in 2025, while online retail is forecast to reach a 7.12% CAGR through 2031.
- By geography, North America accounted for 37.45% of 2025 shares, whereas Asia-Pacific is expected to grow at a 7.60% CAGR over the forecast period.
Note: Market size and forecast figures in this report are generated using Mordor Intelligence’s proprietary estimation framework, updated with the latest available data and insights as of 2026.
Global Coconut Water Market Trends and Insights
Drivers Impact Analysis*
| Driver | (~) % Impact on CAGR Forecast | Geographic Relevance | Impact Timeline |
|---|---|---|---|
| Rising Consumer Preference for Natural and Healthy Beverages | +1.2% | Global, with the strongest impact in North America and Europe | Medium term (2-4 years) |
| Growing Fitness and Wellness Trends Among Consumers | +0.9% | North America and Asia-Pacific core, spill-over to Europe | Long term (≥ 4 years) |
| Aggressive Marketing and Celebrity Endorsements | +0.8% | North America andEurope, expanding to Asia-Pacific | Short term (≤ 2 years) |
| Product Innovation in Terms of Flavor | +0.7% | Global, with early adoption in North America | Medium term (2-4 years) |
| Sustainability and Plant-Based Trends | +0.6% | Europe and North America, emerging in Asia-Pacific | Long term (≥ 4 years) |
| Health Benefits Associated with Consumption of Coconut Water | +0.5% | Global | Long term (≥ 4 years) |
| Source: Mordor Intelligence | |||
Rising Consumer Preference for Natural and Healthy Beverages
Consumer migration toward natural hydration alternatives accelerates as health consciousness intersects with ingredient transparency demands. The FDA's January 2025 guidance on plant-based milk alternative labeling, which encompasses coconut-based beverages, mandates clearer nutritional disclosure that paradoxically benefits coconut water by highlighting its naturally occurring electrolyte profile versus artificially enhanced competitors. This regulatory shift creates competitive advantages for coconut water brands that can leverage inherent nutritional benefits without requiring extensive fortification. Asian markets demonstrate particularly strong adoption, with 54% of Asia-Pacific consumers recognizing hydration-health linkages and 47% planning increased hydration consumption, according to Glanbia Nutritionals' report from 2025 [1]Source: Glanbia Nutritionals, "Emerging Hydration Trends in Asia, Consumer Preferences and Opportunities for innovation in Functional Beverages,'' glanbianutritionals.com . The trend gains momentum as plant-based hydration products, including coconut water, achieved 86% growth in their launch year across Asian markets. Premium positioning becomes viable as consumers demonstrate a willingness to pay higher prices for functional ingredients that deliver perceived health benefits beyond basic hydration.
Growing Fitness and Wellness Trends Among Consumers
Professional athletes' endorsements of coconut water products influence market dynamics by expanding consumer reach beyond health-conscious segments. The natural electrolyte content of coconut water enables it to compete with conventional sports drinks. For instance, BodyArmor's launch of coconut water-based sports drinks in Canada emphasizes natural ingredients over artificial additives. The growing fitness consciousness creates broad market appeal across multiple consumer segments. As sports participation is increasing, the demand for hydration drinks like coconut water is increasing. According to the Sports England data from 2024, the number of people participating in fitness classes was 6,695.5 thousand in England [2]Source: National Organic Standards Board, "National Organic Standards Board Meeting,"ams.usda.gov.Younger consumers, particularly Generation Z and Millennials, increasingly view hydration as essential to wellness and accept premium pricing for functional benefits. Athletic partnerships strengthen coconut water's market position in both sports and lifestyle segments. These partnerships provide credibility and authenticity to coconut water brands in the beverage market. The combination of athletic endorsements and natural functionality positions coconut water as a versatile beverage choice for diverse consumer needs.
Aggressive Marketing and Celebrity Endorsements
Celebrity partnerships have shifted from traditional endorsements to equity investments, creating stronger brand alignment and long-term promotional commitments. This evolution reflects a fundamental change in how brands engage with influential figures. The transformation has led to more sustainable marketing strategies, as celebrities become financially invested in the brand's success. These arrangements foster genuine advocacy and create more meaningful connections with target audiences. In October 2024, ZICO coconut water named NFL player DK Metcalf as their brand ambassador and investor. This approach ensures authentic promotion while reducing marketing expenses through equity-based compensation. Celebrity endorsements are particularly effective on social media platforms, where lifestyle integration influences consumer behavior more effectively than conventional advertising. The integration of celebrities as brand stakeholders has proven especially impactful in digital environments, where authenticity and consistent engagement drive consumer trust and purchasing decisions.
Product Innovation in Terms of Flavor
Coconut water brands are expanding beyond traditional fruit flavors to create distinct taste profiles for specific consumer segments and drinking occasions. Coaqua's introduction of six new varieties in April 2025, including Sparkling, Citrus Circus, and Espresso'd, resulted in 60% year-over-year growth in Sprouts retail channels. The company's strategic flavor expansion demonstrates the market's readiness for innovative taste combinations. These new flavors cater to diverse consumer preferences while maintaining the nutritional benefits of coconut water. Vita Coco expanded its Treats line with Orange and Creme, following the success of Strawberries and Creme, appealing to consumers seeking lighter, sweeter beverages. The frequency of new flavor launches has increased as companies use flavor diversity to stand out in competitive retail spaces. This trend indicates a shift in consumer preferences towards more sophisticated and unique beverage options. The market's response to these innovations suggests continued growth potential in the flavored coconut water segment.
Restraints Impact Analysis*
| Restraint | (~)% Impact on CAGR Forecast | Geographic Relevance | Impact Timeline |
|---|---|---|---|
| Consumer's Inclination Towards Fresh Coconut Water | -0.8% | Asia-Pacific core, particularly Southeast Asia and India | Medium term (2-4 years) |
| Competition from Alternative Hydration Products | -1.1% | Global, with strongest impact in North America | Short term (≤ 2 years) |
| High Price Compared to Other Beverages | -0.6% | Global, with strongest impact in price-sensitive emerging markets | Medium term (2-4 years) |
| Fluctuating Raw Material Price | -0.4% | Global, with strongest impact in supply-dependent regions | Short term (≤ 2 years) |
| Source: Mordor Intelligence | |||
Consumer's Inclination Towards Fresh Coconut Water
Fresh coconut water preference creates persistent competitive pressure in tropical markets where year-round coconut availability enables direct consumption alternatives. This challenge intensifies in Southeast Asian markets where cultural familiarity with fresh coconuts and established vendor networks provide convenient, cost-effective access to unprocessed alternatives. The FDA's recall of over 2 million cans of Jarritos Coconut Water due to contamination risks paradoxically reinforces consumer perceptions that fresh alternatives offer superior safety profiles. Packaged coconut water brands counter this preference through convenience positioning, extended shelf life benefits, and consistent quality assurance that fresh alternatives cannot guarantee. However, the preference constraint becomes particularly acute during peak coconut seasons when fresh product pricing advantages widen significantly against packaged alternatives.
Competition from Alternative Hydration Products
The competitive pressure in the beverage market intensifies through innovation cycles and marketing investments from multinational corporations in enhanced water, sports drinks, and energy beverages. The fortified water segment competes with coconut water's natural positioning by offering immune support, mental wellness, and functional benefits. Products like Propel Immune Support and Smartwater+ target similar health-conscious consumers. These products demonstrate the growing competition in the functional beverage market, where established brands continuously introduce new offerings. Large beverage companies use their extensive distribution networks and marketing resources to compete against specialized coconut water brands. This competitive advantage allows major corporations to reach wider consumer bases and maintain strong market presence. Smaller coconut water brands often respond by focusing on niche or premium market segments to maintain their market position. This strategic positioning helps specialized brands differentiate themselves despite limited resources compared to larger competitors.
*Our forecasts treat driver/restraint impacts as directional, not additive. The impact forecasts reflect baseline growth, mix effects, and variable interactions.
Segment Analysis
By Flavor Type: Plain Coconut Water Dominance Sales
Plain coconut water maintains a commanding 56.32% market share in 2025, reflecting consumer preference for authentic, unmodified taste profiles that emphasize natural purity over artificial enhancement. However, flavored variants accelerate at 5.88% CAGR through 2031, indicating premiumization opportunities as brands target specific consumption occasions and demographic preferences. The dichotomy suggests market bifurcation where volume economics favor plain varieties while margin expansion relies on flavored innovation.
Flavored segment growth accelerates through sophisticated taste development that transcends traditional fruit combinations toward experiential profiles. The flavor innovation cycle intensifies as brands recognize taste variety as a primary differentiator in increasingly competitive retail environments where shelf space commands premium positioning. In April 2025, Raw C, an Australian producer of coconut water, unveiled a new addition to its lineup: a chocolate-infused flavored coconut water. This innovative blend combines single-origin coconut water with cocoa and coconut cream, resulting in a delectably smooth beverage.


By Packaging Type: Sustainability Reshapes Container Choice
Tetra Pack packaging leads with 52.15% market share in 2025, benefiting from superior shelf stability, cost efficiency, and established supply chain infrastructure that enables global distribution at scale. Pet/Glass bottles accelerate at 6.31% CAGR through 2031, driven by sustainability concerns and premium positioning strategies that emphasize recyclability and product visibility. The packaging evolution reflects broader environmental consciousness trends where consumer willingness to pay sustainability premiums creates competitive advantages for eco-friendly alternatives. EU packaging regulations mandating reuse and refill targets for food products intensify this shift, particularly affecting European market dynamics where environmental compliance becomes a market entry requirement.
The packaging transformation creates supply chain implications as brands balance cost optimization against sustainability positioning, particularly for premium segments where eco-friendly packaging justifies higher retail pricing. Other packaging formats, including aluminum cans and flexible pouches, capture niche applications but face scalability challenges due to limited infrastructure and higher per-unit costs. The segment dynamics suggest continued Tetra Pack dominance in volume markets while Pet/Glass bottles gain share in premium and environmentally conscious consumer segments.
By Ingredient: Organic Premiumization Accelerates
Natural and organic ingredients drive 6.74% CAGR growth through 2031 despite conventional products maintaining 67.98% market share in 2025, highlighting premiumization trends where quality positioning commands higher margins. The organic segment benefits from USDA National Organic Standards Board discussions on certification streamlining and risk-based approaches that reduce compliance burdens for low-risk operations. Betrimex's expansion toward 10,000 hectares of organic coconut farming by 2025 demonstrates supply chain investments required to meet growing organic demand while maintaining cost competitiveness . The organic positioning creates differentiation opportunities as health-conscious consumers demonstrate a willingness to pay premium prices for certified organic products.
Conventional ingredient dominance reflects cost sensitivity in mass market segments where price competition limits premium positioning opportunities. However, the ingredient bifurcation creates strategic choices for brands between volume-based conventional positioning and margin-focused organic strategies. The organic acceleration trend gains momentum as regulatory frameworks simplify certification processes while consumer education increases awareness of organic benefits beyond basic health considerations to include environmental and social impact dimensions.
By Distribution Channel: Digital Transformation Accelerates
Online retail stores achieve a 7.12% CAGR through 2031, while supermarkets/hypermarkets maintain a 56.95% market share in 2025, indicating a shift in beverage purchasing behavior. In September 2024, Blue Monkey expanded its international distribution by partnering with Emart traders in South Korea. The growth of digital channels enables premium positioning, subscription models, and direct consumer relationships that reduce traditional retail margins. Online platforms provide opportunities for niche and emerging brands that cannot support extensive physical retail networks.
Convenience stores, grocery stores, and other distribution channels serve specialized segments including foodservice, hospitality, and institutional markets where immediate availability influences purchasing decisions. This channel diversification indicates market maturity, with different consumption occasions requiring specific distribution approaches. Traditional retail maintains its strong position through impulse purchases and established shopping habits, but faces pressure from online channels that offer convenience and competitive pricing. While traditional retail continues to lead in volume, online channels present growth opportunities for brands that engage directly with consumers.
Geography Analysis
North America holds 37.45% market share in 2025, characterized by mature market conditions with established consumer awareness and premium positioning. Strong retail infrastructure, health-conscious consumers, and widespread acceptance of coconut water enable premium pricing strategies. However, new 10% US import tariffs create margin pressures, prompting companies like Vita Coco to implement cost reduction measures and price adjustments. The region shows particular success with celebrity endorsements, where athletic partnerships and social media influence expand market reach beyond traditional health-focused consumers.
Asia-Pacific demonstrates the highest growth trajectory at 7.60% CAGR through 2031, supported by increasing health awareness, retail development, and high spending power in emerging markets. Supply chain disruptions, including drought and pest issues in Thailand, affect regional pricing stability, prompting government oversight of price inflation. Plant-based hydration products achieve 86% growth in launch years, with strong adoption among younger consumers who respond to functional beverage messaging.
Europe, South America, and the Middle East and Africa offer growth potential despite current limited market penetration. European operations must adapt to EU packaging sustainability regulations, which add compliance requirements but create opportunities for environmentally conscious brands. The EU's Farm to Fork strategy and European Green Deal support plant-based alternatives, while organic consumption targets reinforce premium positioning. South American markets leverage cultural familiarity with coconut products and increasing health awareness. Middle Eastern markets show promise through growing wellness trends and premium beverage acceptance among high-income consumers.

Competitive Landscape
The coconut water market maintains a moderately fragmented market. Major companies in the market include The Vita Coco Company, Inc., ZICO Rising, Inc., Iberia Foods, LLC., Harmless Harvest Inc., and C2O Coconut Water. Companies with diverse distribution networks and strong brands maintain significant market advantages in this competitive landscape. The ability to maintain resilient supply chains through multiple sourcing regions and processing partnerships has become increasingly important for sustained success.
Companies gain competitive advantages through strategic investments in processing technology, quality control systems, and supply chain optimization to reduce costs while maintaining product quality. These technological advancements help companies streamline operations and ensure consistent product delivery across markets. Market opportunities continue to emerge in functional coconut water varieties and regional flavor variations that cater to local preferences. The development of sustainable packaging solutions has also become a key differentiator in the market, particularly among environmentally conscious consumers.
New entrants target premium segments with organic certifications and direct consumer sales strategies to avoid traditional retail margins and build brand loyalty. This approach allows smaller players to establish strong market positions despite limited resources and distribution capabilities. Established companies maintain their market positions through celebrity endorsements and broad distribution networks that span multiple retail channels. Large players also implement intensive promotional activities and marketing campaigns that smaller competitors cannot match, creating effective barriers to entry in certain market segments.
Coconut Water Industry Leaders
-
The Vita Coco Company, Inc.
-
ZICO Rising, Inc.
-
Iberia Foods, LLC.
-
Harmless Harvest Inc.
-
C2O Coconut Water
- *Disclaimer: Major Players sorted in no particular order


Recent Industry Developments
- March 2025: Hamdard launched Hamdard Refresh Nariyal Paani, a new variant of its coconut water, in an aseptic brick pack. The product contains natural electrolytes and no added sugar, offering the same benefits as traditional coconut water at a lower price point. The beverage is made from concentrated coconut extract and provides instant hydration.
- July 2024: Yu, an omnichannel brand, launched a new beverage product made from 100% coconut water. The company aims to provide consumers with a natural, refreshing drink option that maintains the authentic taste and nutritional benefits of fresh coconuts. This product launch aligns with the growing consumer demand for healthy, natural beverages in the market.
- March 2024: Indian entrepreneur Arjun Talwar launched Bervera, a coconut water brand targeting the global beverage mixer market. Bervera positions its coconut water as a healthy alternative for consumers seeking nutritious options in their cocktails and mocktails.
- April 2023: ITC's B Natural Juices and Beverages has launched packaged tender coconut water nationwide in India. The beverage provides hydration and refreshment during summer months. B Natural Select Tender Coconut Water contains no added sugar, artificial flavors, or fats, aligning with consumer preferences for natural beverages.


Global Coconut Water Market Report Scope
Coconut water is the clear liquid inside coconuts. In early development, it serves as a suspension for the endosperm of the coconut during the nuclear phase of growth. The market has been segmented on the basis of flavor, distribution channel, and geography. It is segmented by flavor into plain coconut and flavored coconut water. The distribution channel is segmented into supermarkets/hypermarkets, convenience stores, online retail stores, and other distribution channels. Geography is segmented into North America, Europe, Asia-pacific, South America, and Middle-East & Africa. For each segment, the market sizing and forecasts have been done based on value (in USD Million).
| Plain Coconut Water |
| Flavor Coconut Water |
| Pet/Glass Bottles |
| Tetra Pack |
| Others |
| Conventional |
| Natural and Organic |
| Supermarkets/Hypermarkets |
| Convenience/Grocery Stores |
| Online Retail Stores |
| Other Distribution Channels |
| North America | United States |
| Canada | |
| Mexico | |
| Rest of North America | |
| Europe | Germany |
| United Kingdom | |
| Italy | |
| France | |
| Spain | |
| Netherlands | |
| Poland | |
| Belgium | |
| Sweden | |
| Rest of Europe | |
| Asia-Pacific | China |
| India | |
| Japan | |
| Australia | |
| Indonesia | |
| South Korea | |
| Thailand | |
| Singapore | |
| Rest of Asia-Pacific | |
| South America | Brazil |
| Argentina | |
| Colombia | |
| Chile | |
| Peru | |
| Rest of South America | |
| Middle East and Africa | South Africa |
| Saudi Arabia | |
| United Arab Emirates | |
| Nigeria | |
| Egypt | |
| Morocco | |
| Turkey | |
| Rest of Middle East and Africa |
| By Flavor Type | Plain Coconut Water | |
| Flavor Coconut Water | ||
| By Packaging Type | Pet/Glass Bottles | |
| Tetra Pack | ||
| Others | ||
| By Ingredient | Conventional | |
| Natural and Organic | ||
| By Distribution Channel | Supermarkets/Hypermarkets | |
| Convenience/Grocery Stores | ||
| Online Retail Stores | ||
| Other Distribution Channels | ||
| By Geography | North America | United States |
| Canada | ||
| Mexico | ||
| Rest of North America | ||
| Europe | Germany | |
| United Kingdom | ||
| Italy | ||
| France | ||
| Spain | ||
| Netherlands | ||
| Poland | ||
| Belgium | ||
| Sweden | ||
| Rest of Europe | ||
| Asia-Pacific | China | |
| India | ||
| Japan | ||
| Australia | ||
| Indonesia | ||
| South Korea | ||
| Thailand | ||
| Singapore | ||
| Rest of Asia-Pacific | ||
| South America | Brazil | |
| Argentina | ||
| Colombia | ||
| Chile | ||
| Peru | ||
| Rest of South America | ||
| Middle East and Africa | South Africa | |
| Saudi Arabia | ||
| United Arab Emirates | ||
| Nigeria | ||
| Egypt | ||
| Morocco | ||
| Turkey | ||
| Rest of Middle East and Africa | ||


Key Questions Answered in the Report
What is the current size of the coconut water market and how fast is it growing?
The category produced USD 3.97 billion in 2026 and is set to reach USD 5.24 billion by 2031, reflecting a 5.68% CAGR.
Which region leads coconut water sales today?
North America holds 37.45% of 2025 revenue thanks to premium positioning and strong retail infrastructure.
Which packaging format is gaining popularity fastest?
PET and glass bottles are expanding at a 6.31% CAGR through 2031, propelled by sustainability concerns and premium shelf appeal.
Why are flavored coconut waters important for growth?
Flavored variants, though smaller in volume, will grow 5.88% annually as shoppers look for variety and brands pursue higher margins.
Page last updated on:


