
Market Overview
| Study Period | 2020 - 2031 |
|---|---|
| Forecast Data Period | 2026 - 2031 |
| Base Year Market Size (2025) | USD 1.54 Billion |
| Market Size (2026) | USD 1.65 Billion |
| Market Size (2031) | USD 2.29 Billion |
| Growth Rate (2026 - 2031) | 6.84 % |
| Market Concentration | Medium |
Major Players *Disclaimer: Major Players sorted in no particular order Image © Mordor Intelligence. Reuse requires attribution under CC BY 4.0. | |
Africa CNG And LPG Vehicle Market Analysis by Mordor Intelligence
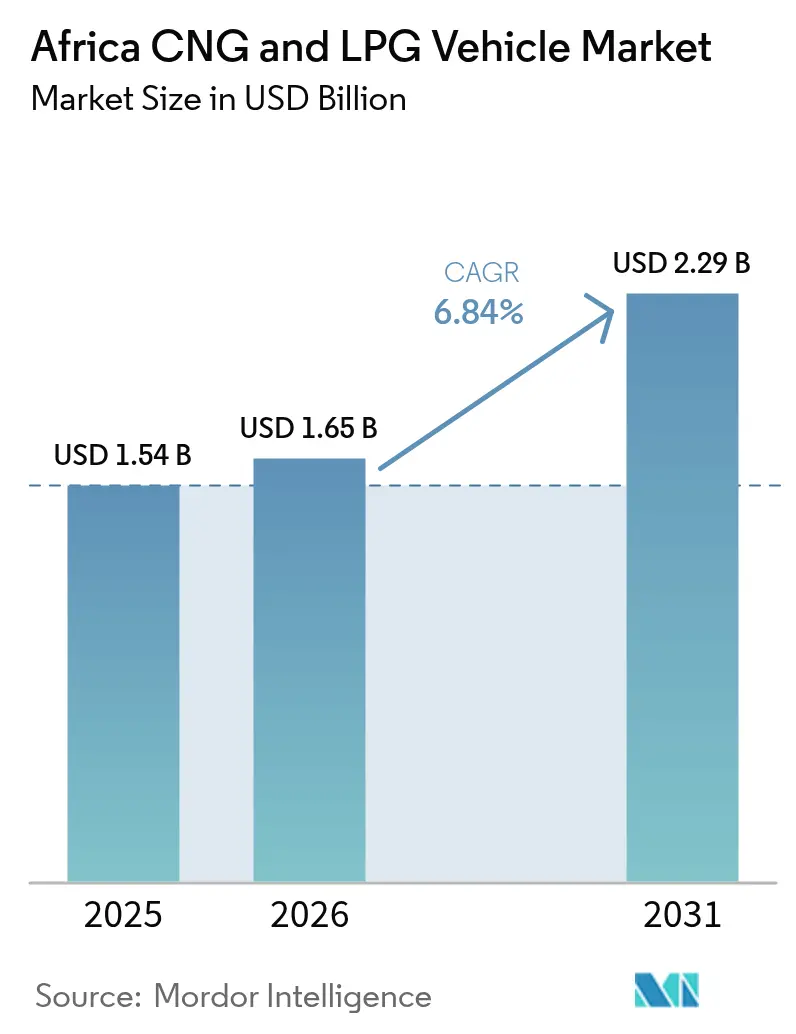
The Africa CNG and LPG Vehicle Market size in 2026 is estimated at USD 1.65 billion, growing from 2025 value of USD 1.54 billion with 2031 projections showing USD 2.29 billion, growing at 6.84% CAGR over 2026-2031. As petroleum prices fluctuate, the cost advantage of gaseous fuels becomes more pronounced, a shift underscored by national programs embedding fuel-diversification goals into long-term energy policies. Nigeria's Presidential CNG Initiative, with a significant investment for refueling assets and converting many vehicles, underscores the state's role in hastening private adoption. With an extensive network of CNG stations, Egypt offers a mature infrastructure model that other African nations are now looking to replicate. At the same time, technology suppliers are introducing retrofit kits, making it more affordable for commercial fleets to transition, and cross-border pipeline projects are ensuring consistent fuel quality across West Africa.
Key Report Takeaways
- By fuel type, CNG led with a 76.79% revenue share in 2025; it is also forecast to progress at a 6.74% CAGR through 2031.
- By vehicle type, passenger cars accounted for 62.88% of sales in 2025; buses and coaches are projected to grow at a 6.90% CAGR to 2031.
- By sales channel, the aftermarket controlled 76.95% of conversions in 2025; OEM sales are expected to expand at a 6.92% CAGR through 2031.
- By conversion technology, bi-fuel gasoline-gas systems captured 68.10% of installations in 2025; dedicated gaseous-fuel platforms should increase at a 6.87% CAGR by 2031.
- By country, Egypt held 38.40% of the 2025 volume, whereas Nigeria is positioned for the fastest 6.89% CAGR between 2026 and 2031.
Note: Market size and forecast figures in this report are generated using Mordor Intelligence’s proprietary estimation framework, updated with the latest available data and insights as of 2026.
Africa CNG And LPG Vehicle Market Trends and Insights
Drivers Impact Analysis*
| Driver | (~) % Impact on CAGR Forecast | Geographic Relevance | Impact Timeline |
|---|---|---|---|
| Investments in Refueling Infrastructure | +1.8% | Nigeria, Egypt, South Africa core; spillover to Morocco, Ethiopia | Medium term (2-4 years) |
| Government Incentives for Gaseous Fuels | +1.5% | Nigeria, Egypt primary; Tanzania, Ghana secondary markets | Short term (≤ 2 years) |
| Volatile Fuel Prices | +1.2% | Global, with highest impact in import-dependent economies | Short term (≤ 2 years) |
| Stricter Emission Standards | +0.9% | South Africa, Egypt leading; gradual adoption across ECOWAS region | Long term (≥ 4 years) |
| Micro-LNG-to-CNG Rural Hubs | +0.7% | Nigeria rural areas, Kenya, Tanzania expanding coverage | Medium term (2-4 years) |
| Ride-Hailing Fleet Conversion | +0.6% | Urban centers: Lagos, Cairo, Johannesburg, Nairobi, Accra | Short term (≤ 2 years) |
| Source: Mordor Intelligence | |||


Rising Investments in Refueling Infrastructure
Nigeria’s NNPC targets multiple CNG stations by 2025, and Egypt already operates numerous sites, giving both nations a substantial first-mover advantage in network coverage [1]“NNPC Plans 100 CNG Stations by 2025,” NNPC Limited, nnpclimited.com. Capital also flows into micro-LNG-to-CNG hubs that monetize previously flared associated gas volumes, lowering unit transportation costs for rural operators. The Nigeria–Morocco pipeline and Nigeria–Equatorial Guinea gas-link agreements underscore regional ambitions to unify supply specifications. Early investors gain location advantages because infrastructure typically precedes demand, locking in high-traffic urban corridors. As stations spread, fleet owners increasingly base procurement plans on assured refueling proximity rather than speculative future builds.
Government Incentives & Subsidies for Gaseous Fuels
Nigeria’s Presidential CNG Initiative bundles conversion rebates, tax holidays, and mandatory public-sector fleet transitions that target one million vehicles—or roughly half of the current commercial fleet—by 2027 [2]“Program Fact Sheet 2025,” Presidential CNG Initiative, pcng.ng . Tanzania’s completed conversions illustrate the catalytic effect of even modest fiscal support when paired with visible pilot fleets. Such frameworks tilt total cost-of-ownership calculations decidedly toward gaseous fuels, but fiscal sustainability hinges on complementary private capital in infrastructure and service delivery. Coordinated public–private investment structures matter because unchecked subsidy outlays risk crowding out other energy-transition priorities. Thus, policy architects increasingly design sunset clauses that phase incentives out as network density approaches economic self-sufficiency.
Volatile Gasoline and Diesel Prices
Petroleum price volatility compresses payback horizons: operators report two-fifth fuel-cost savings from CNG, recovering conversion expenses within 12–18 months at present price levels [3]“Natural Gas Market Update 2024,” International Energy Agency, iea.org . Import-reliant African economies feel the pressure most, generating structural appetites for domestically sourced natural gas alternatives. Yet the response is moderated by installation capacity; during sharp price spikes, workshops struggle to meet sudden surges in conversion orders, delaying impact. Sustained price elevation, rather than episodic spikes, therefore proves pivotal in justifying capital outlays for both fleets and station developers. In this environment, companies that hedge through dual-fuel or fleet-wide contracts stabilize operating margins against global oil swings.
Stricter Vehicle-Emission Standards
The UNEP-backed “Safer and Cleaner Used Vehicles for Africa” initiative urges Euro 4-equivalent thresholds for imported vehicles, indirectly nudging fleets toward lower-carbon fuel mixes. South Africa and Egypt have already implemented UNECE Regulations 110 and 115, standardizing equipment and retrofit safety compliance and reducing insurance premiums for professional operators. Because used vehicles account for up to four-fifths of annual fleet additions, enforcement leakage still dilutes immediate impact; however, rising inspection capacity across customs posts signals tightening oversight. Over the long term, emission-based road-user charges—now under study in South Africa—could further sharpen price signals that favor gaseous fuels. Operators react by repositioning older diesel assets into secondary routes while shifting new acquisitions toward compliant CNG options.
Restraints Impact Analysis*
| Restraint | (~) % Impact on CAGR Forecast | Geographic Relevance | Impact Timeline |
|---|---|---|---|
| Inadequate Regulations | -1.1% | Sub-Saharan Africa excluding South Africa; limited enforcement capacity | Long term (≥ 4 years) |
| Limited OEM Portfolio | -0.8% | Global, with acute impact in markets preferring new vehicles over conversions | Medium term (2-4 years) |
| Gas-Supply Disruptions | -0.6% | Nigeria, Egypt primary; Tanzania, Ghana secondary markets with pipeline dependencies | Short term (≤ 2 years) |
| Safety Perception Issues | -0.5% | Nigeria, Kenya, Tanzania where informal conversion practices are prevalent | Medium term (2-4 years) |
| Source: Mordor Intelligence | |||
Inadequate Regulatory Frameworks
Regulation gaps foster informal workshops that install uncertified high-pressure tanks, raising safety concerns that erode consumer confidence. Approval protocols differ widely among African states, driving up compliance costs for kit suppliers who must customize paperwork for each jurisdiction. Absent harmonized fuel-quality rules, cross-border fleets face engine-damage risk when methane numbers or LPG octane levels vary unexpectedly. Such friction fragments scale economies, inhibiting OEMs from committing to dedicated assembly lines. ECOWAS discussions on standard gaseous-fuel specification could lower these barriers, but progress remains incremental and politically sensitive.
Limited OEM Gaseous-Fuel Vehicle Portfolio
Few automakers offer factory-fitted CNG or LPG variants tailored to African duty cycles. Westport Fuel Systems’ 2025 decision to sell its light-duty division for a considerable amount underscores a strategic retreat from volume segments, tightening supply options. Importers relying on Euro-sourced models face currency volatility that inflates landed costs, narrowing price differentials versus diesel. OEM reluctance stems partly from perceived volume limitations, yet aftermarket kit penetration demonstrates latent demand that the formal sector has not met. Over time, partnerships like the Volvo–Westport HPDI joint venture hint at renewed interest in heavy-duty niches where fuel savings justify premium drivetrains.
*Our forecasts treat driver/restraint impacts as directional, not additive. The impact forecasts reflect baseline growth, mix effects, and variable interactions.
Segment Analysis
By Fuel Type: CNG Infrastructure Calibrates Growth Trajectory
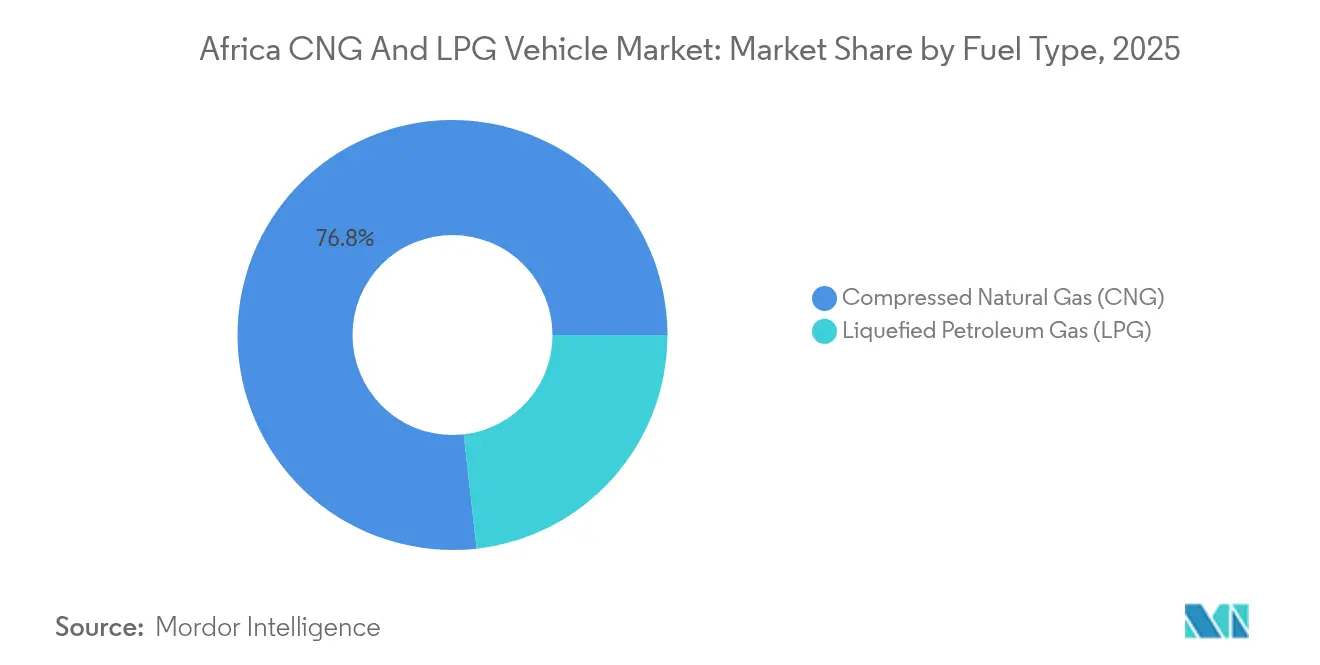
Compressed Natural Gas commanded a 76.79% 2025 revenue share, reflecting the dense station networks in Egypt and emerging corridors in Nigeria. The Africa CNG and LPG vehicle market size for CNG-powered units is forecast to climb at a 6.74% CAGR through 2031 as additional pipelines lower wholesale methane costs and make retail pricing more competitive. Infrastructure prerequisites create natural oligopolies in urban centers, incentivizing long-term supply contracts between fleet operators and station consortia. LPG continues serving territories without pipeline access, offering bottled-gas convenience where road density is low yet cooking-gas distribution already exists.
Nonetheless, as pipeline-based supply pushes deeper inland, investment logic tilts toward CNG for high-utilization freight. Once commissioned, the Nigeria-Morocco trunk line will likely expand CNG market access into interior West Africa. That extension will further widen the cost gap between CNG and LPG, nudging mixed-fuel fleets toward single-fuel strategies that simplify maintenance.


By Vehicle Type: Commercial Fleets Anchor Early Adoption
Passenger cars held 62.88% of cumulative conversions in 2025, yet buses and coaches are projected to lead growth at a 6.90% CAGR to 2031. High-mileage urban passenger transport amplifies savings: a city bus completing triple-shift duty can recoup conversion costs within one fiscal year, compelling payback calculations. Freight logistics likewise sees mounting interest, illustrated by Dangote Group’s rollout of multiple CNG trucks that collectively displace sizable diesel volumes.
The Africa CNG and LPG vehicle market share captured by commercial categories will expand as e-commerce accelerates delivery-van utilization and operators seek a shield against oil-price swings. Private car uptake, though slower, rises in lockstep with public confidence built by visible fleet examples and growing station density. The trajectory implies a commercial-first adoption curve, with retail consumers following once infrastructural convenience reaches parity with legacy fuels.
By Sales Channel: Retrofit Dominance, OEM Upside
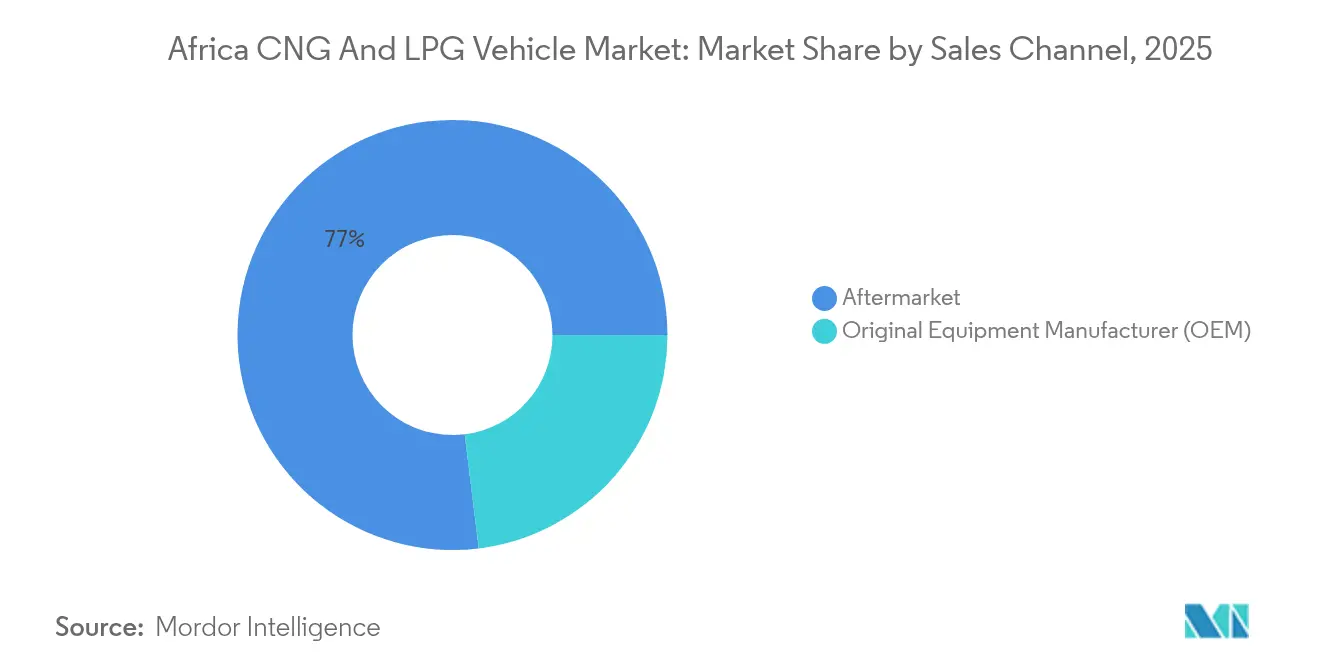
Aftermarket conversions represented 76.95% of 2025 installations because kit availability and workshop familiarity overcame the limited OEM catalogue. Conversion costs remain attainable for small fleet owners when paired with vendor-provided installment financing. Over the forecast horizon, OEM deliveries are set to expand at a 6.92% CAGR, lifting their portion of the Africa CNG and LPG vehicle market as warranty guarantees and factory-integrated telemetry appeal to corporate buyers. Policy incentives that exempt factory-built gaseous-fuel models from import duties in Egypt and Kenya further tip decisions toward OEM supply.
Yet retrofit-focused service networks will stay relevant by targeting older diesel assets that fleets cannot replace immediately. A coexistence phase is therefore expected where retrofit centers operate alongside brand dealerships, sometimes integrating as certified installers to preserve warranty coverage.
By Conversion Technology: Bi-Fuel Flexibility Persists
Bi-fuel gasoline-gas systems secured 68.10% of 2025 volume, emphasizing operator preference for redundant fuel capability during the infrastructure build-out phase. Such systems allow seamless toggling between liquid and gaseous fuel, mitigating range anxiety and supporting cross-border operations where gas availability remains uneven. Dedicated CNG or LPG configurations will outpace at a 6.87% CAGR as station density improves, attracting owners keen on lighter tanks and simplified maintenance.
Dual-fuel diesel-CNG kits for heavy trucks achieve near-immediate fuel savings by offsetting up to two-fifths of diesel with natural gas, delivering measurable emission cuts without sacrificing torque requirements. Suppliers differentiate through advanced engine-control modules that optimize combustion in real time, improving thermal efficiency and cylinder durability. The evolutionary pattern suggests bi-fuel dominance during infrastructure infancy, gradually ceding ground to dedicated systems once reliability perceptions are solidified.
Geography Analysis
Egypt’s 38.40% 2025 share mirrors three decades of methodical state strategy: gas discoveries, city-by-city station rollouts, and mobile workshops that convert taxis at scale. That foundation establishes the African CNG and LPG vehicle market as a mainstream option for Egyptian commuters. Nigeria, by contrast, contributes the heftiest growth momentum, set for a 6.89% CAGR through 2031. Urban penetration is so extensive that taxis in Cairo routinely queue for CNG, normalizing the fuel for private motorists who once viewed it as purely commercial. Regulatory clarity-UNECE Regulation 115 adoption, station safety audits, and periodic cylinder inspections-reinforces user trust, lowering perceived risk and encouraging faster fleet turnover toward dedicated CNG platforms.
Nigeria has adopted an interventionist path, blending subsidy allocations with infrastructure investment to fast-track demand. The Presidential CNG Initiative commits a huge amount to new stations, technician training, and concessional conversion financing, pushing the African CNG and LPG vehicle market into mainstream media discourse. Geographical reach extends beyond Lagos and Abuja via micro-LNG-to-CNG hubs that allow remote depots to refuel heavy trucks without pipeline access. Collaborations with the planned Nigeria-Morocco pipeline promise eventual price convergence across West Africa, strengthening Nigeria’s status as a regional supply hub.
The looming gas-supply tightness moderates South Africa’s adoption pace, prompting discussions on LPG import-terminal expansions and alternative energy diversification. Electric-vehicle incentives compete directly for passenger-car mindshare. However, freight operators still model total cost of ownership scenarios favoring gaseous fuels over battery packs, particularly for long-haul routes with stringent payload margins. Elsewhere, Ghana and Tanzania concentrate on LPG infrastructure modernization, creating stepping-stones toward future CNG, where local gas finds are monetized. ECOWAS and SADC policy dialogues on fuel-quality harmonization foreshadow a continent where cross-border fleets could refuel seamlessly under uniform standards.
Regulatory Landscape
Regulation is tightening around safety, fuel quality, and conversion practices as governments use gaseous-fuel mobility to reduce petrol and diesel dependence. Nigeria has formalized its push through the Presidential Initiative on Compressed Natural Gas and Electric Vehicles (Pi-CNG and EV), pairing incentives and public-sector fleet actions with infrastructure targets through 2027 (including 2,322 CNG stations and 3,000 conversion workshops). International technical baselines are also being reinforced by ISO 16923:2026 (published January 2026) for CNG fueling station design, construction, operation, and inspection, which strengthens the compliance framework for station developers and insurers.
Country-level compliance mechanisms still vary, shaping how quickly organized conversion networks can scale. Tanzania uses its Petroleum (Natural Gas Midstream and Downstream) General Regulations framework, including requirements that CNG facilities be installed and maintained by approved workshops under a certifying authority. Kenya, meanwhile, updated petroleum product quality management through its 2025 regulations that tie product standards to those approved by the national standards body. This unevenness keeps cross-border fleet operators and kit suppliers exposed to multi-jurisdiction paperwork and inspection regimes, increasing the value of standard-aligned equipment and certified installer networks in the formal channel.
Value Chain Analysis
The value chain begins with gas supply and conditioning (pipeline gas, associated gas monetization, or LPG distribution), then moves through compression and distribution to stations, vehicle conversion or OEM delivery, and downstream services (inspection, maintenance, cylinder testing, and parts). Nigeria is expanding the infrastructure layer through a mother-station/daughter-station and virtual pipeline model that moves CNG by tube trailers from pipeline-connected hubs to off-grid daughter stations, supporting corridor-style rollouts. Pi-CNG and EV also commissioned a high-capacity daughter station in Jahi, Abuja in May 2026, backed by the Midstream and Downstream Gas Infrastructure Fund. Egypt operates a more mature chain with dense station coverage and large-scale conversion centers, which supports repeatable fleet programs and higher workshop productivity.
Execution from upstream to midstream increasingly depends on localized industrial capacity and financing. Key components such as cylinders and ECU hardware are still largely imported (China, South Korea, India, Europe), while Nigeria is promoting domestic manufacturing for selected components through industrial development around Ajaokuta. Technician standards and quality oversight reference national bodies such as NADDC and SON. On the demand side, conversion volumes depend on trained installers, verified parts supply, and consumer finance. Nigeria has used program-led conversion financing approaches and broad rollout operations across many states, while Egypts conversion activity is reinforced by major integrators such as Cargas reporting 30,000 conversions in 2025 and a 61% year-on-year increase, indicating strong pull-through for workshop capacity, parts availability, and station uptime.
Competitive Landscape
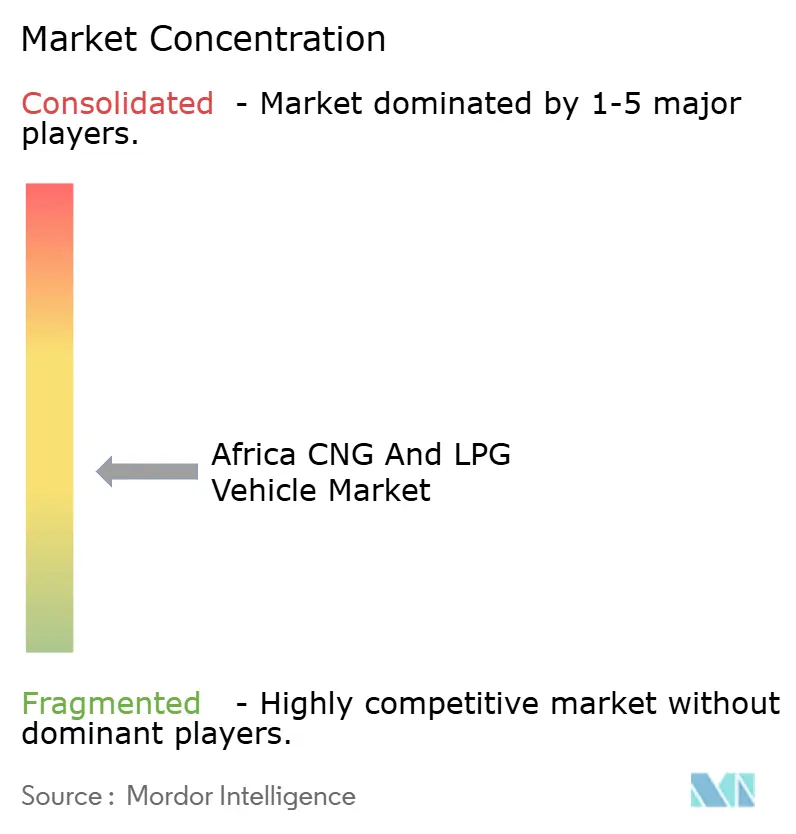
The African CNG and LPG vehicle market remains fragmented, with technology specialists, global OEMs, and local integrators jockeying for position. Iveco, Volkswagen, and Volvo maintain a global engineering scale, marketing factory-built gaseous-fuel models that appeal to corporations seeking warranty certainty. Conversion-kit leaders such as Landi Renzo, BRC Gas Equipment, and Prins Autogassystemen sustain high workshop loyalty by bundling training and diagnostics tools. African entities—including NGVAfrica and African Gas Equipment—bridge cost gaps by adapting imported kits to locally sourced cylinders, lowering overall conversion bills.
Strategic alliances are multiplying. The 2024 Volvo–Westport joint venture commercializes HPDI fuel systems for long-haul trucks, exploiting the heavy-duty niche where fuel margins justify advanced injector technology. System integrators partner with micro-finance houses to offer lease-to-own conversion packages, easing upfront cash hurdles for small operators. Consolidation appears inevitable as station rollouts require capital intensity that favors players with balance-sheet capacity or multilateral backing. Mergers may begin in servicing, where combining spare-parts procurement and telemetry platforms yields immediate economies of scale.
Digitalization is the new battleground. Real-time fleet portals track gas consumption, predict cylinder inspections, and schedule preventive maintenance. Suppliers that embed such analytics into their hardware capture stickier customer relationships and unlock performance-based contracting models. Over the forecast period, the African CNG and LPG vehicle market will likely progress toward vertically integrated ecosystems that span gas sourcing, station ownership, conversion services, and data-enabled fleet management.
Africa CNG And LPG Vehicle Industry Leaders
Seat S.A.
Exo Gas
Zavoli
BRC Gas Equipment
Cummins Inc.
- *Disclaimer: Major Players sorted in no particular order

Market Opportunities and Future Outlook
Large, policy-backed conversion programs create whitespace across certified workshops, station equipment, and compliant parts supply, especially where the aftermarket dominates adoption. Nigeria provides a near-term demand anchor through Pi-CNG and EV actions, including the March 2026 directive to deploy 100,000 CNG conversion kits nationwide and the April 2026 financing partnership with Moniepoint Microfinance Bank, CreditCorp, and the National Credit Guarantee Company to widen access to conversion credit. These initiatives support the addressable opportunity for certified installers, kit distributors, cylinder inspection services, and fleet telematics that can document fuel savings and compliance to lenders.
Manufacturing localization and heavy-duty and public transport applications stand out as growth corridors tied to announced programs and measured outcomes. In May 2026, Nigerias federal government cited mobilization of USD 1.02 billion for the conversion program and expanded the Ajaokuta CNG Industrial Park footprint, which creates opportunities for localized assembly, QA labs, and component supply chains that reduce FX exposure. In Egypt, state-linked rollout in public transport continues to show measurable benefits, with the Public Transport Authority reporting that natural gas and electric buses reduced diesel consumption by 73.5% between July 2025 and May 2026. That outcome supports continued procurement and retrofit demand for buses, depot fueling solutions, and maintenance ecosystems, alongside technology upgrades for higher-utilization fleets such as heavy trucks.
Recent Industry Developments
- May 2026: Nigeria expanded corridor-style deployment under the Presidential Initiative on CNG and Electric Vehicles, activating the Northern CNG and EV Corridor in Kano and supporting multi-vehicle rollout including CNG buses and tricycles. The corridor approach connects fueling access, fleet procurement, and conversion capacity into a single execution model, accelerating commercialization beyond early adopter cities.
- March 2025: Westport Fuel Systems agreed to divest its light-duty segment to Heliaca Investments for USD 73.1 million, with contingent earn-outs, to sharpen focus on heavy-duty HPDI commercialization. The divestment influences technology availability and partner priorities for fleets and integrators sourcing advanced natural-gas drivetrains for medium and heavy commercial vehicles.
- July 2024: Volvo Group and Westport Fuel Systems inaugurated a joint venture to commercialize HPDI fuel systems for long-haul trucks, including pathways for renewable natural gas and hydrogen. This provides a clearer industrial route for high-utilization heavy-duty applications where fuel savings and emissions performance support investment in gas-capable powertrains.


Research Methodology Framework and Report Scope
Market Definition and Coverage
For this study, the market is defined as the value of on-road vehicles in Africa that run on CNG or LPG, including factory-built models and vehicles converted through approved retrofit systems.
Scope exclusions: Off-road equipment and non-automotive gas applications (such as household LPG cylinders and stationary generators) are excluded from this market sizing.
Segmentation Overview
- By Fuel Type
- Compressed Natural Gas (CNG)
- Liquefied Petroleum Gas (LPG)
- By Vehicle Type
- Passenger Cars
- Light Commercial Vehicles
- Medium and Heavy Commercial Vehicles
- Buses & Coaches
- By Sales Channel
- Original Equipment Manufacturer (OEM)
- Aftermarket
- By Conversion Technology
- Dedicated CNG/LPG
- Bi-fuel (Gasoline-Gas)
- Dual-fuel Diesel-CNG (HDVs)
- By Country
- Egypt
- Nigeria
- South Africa
- Morocco
- Ethiopia
- Rest of Africa
Data Sources, Market Sizing, and Validation
Desk Research
To set the market boundary correctly, we compiled a factual base on Africa vehicle parc trends, fuel availability, and alternative-fuel policy direction. Public sources were reviewed for market signals, including International Energy Agency datasets on natural gas and LPG, World Bank indicators on transport and fuel affordability, UN Comtrade trade flows for conversion parts and related components, and AFREC energy statistics for country energy balances.
We also reviewed regulatory and standards information published by national transport and energy authorities, plus customs and excise releases where available, since these documents usually explain when conversions are permitted and how they are taxed. Company annual reports, investor presentations, and credible press were then used to track conversion rollouts, station expansions, and fleet programs that can change demand quickly. Where financial line items were hard to isolate, we referred to paid subscriptions for company financials and intelligence, and also for shipment-level import and export checks to anchor the direction of volumes and pricing. The desk sources mentioned here are illustrative rather than exhaustive, and additional public references were used for data collection, validation, and clarification.
Primary Interviews and Surveys
Primary inputs were built through expert interviews and short surveys with OEM and aftermarket stakeholders, conversion kit and cylinder suppliers, fleet operators, station developers, and policy-linked experts across key African markets. We used these discussions to confirm adoption pace, typical conversion pricing, the split between OEM fitment and retrofits, and how supply constraints or safety rules affect what gets delivered in practice.
Distribution of primary research fieldwork respondents
| Company type | Respondent position |
|---|---|
| Top tier: 32% | CXOs: 13% |
| Mid tier: 47% | Functional/Unit leaders: 27% |
| Smaller Players: 21% | Managers: 60% |
Market-Sizing & Forecasting
The core model uses a top-down approach that reconstructs demand from the addressable vehicle parc and applies conversion or fitment penetration, then translates that volume into value using country-level pricing logic. Because published parc data can lag, we rebalanced the demand pool using signals that are available more frequently, and we cross-checked the main totals using selective bottom-up approximations.
On the input side, we used measurable indicators such as the CNG and LPG refueling footprint by country, conversion program activity for taxis and buses, relative pump price gaps versus gasoline and diesel, availability and pricing of cylinders and kits, and the passenger versus commercial vehicle mix in each priority country. These variables help explain whether adoption is practical, and then how fast it can scale in real fleet decisions.
Forecasts were produced using scenario analysis, since policy timing and infrastructure rollout can change adoption speed more than a single trend line can capture. We built a base case supported by expert consensus, then tested sensitivity to slower station buildout, delayed incentives, and higher conversion costs. Where bottom-up information was incomplete, gaps were handled by applying interview-backed ranges for conversion rates and average selling prices, and then tightening them through cross-country consistency checks.
Data Validation & Update Cycle
Outputs are validated through a triangulation routine that checks value totals against independent signals, including changes in alternative-fuel vehicle registrations, public announcements of fleet conversion targets, and trade-linked availability of key components. When a country-level result looks inconsistent with these signals, we review the assumptions and re-contact respondents to confirm whether the variance reflects a real shift or a data artifact.
Before sign-off, the model and assumptions go through multi-step internal reviews, with checks on currency conversion timing, price logic, and year-on-year jumps that do not match infrastructure reality. The report is refreshed annually, and interim updates are made when material events occur, such as a major conversion mandate, subsidy change, or a step-change in gas supply availability. Right before delivery, a final pass is completed so clients receive the most current view possible.
Mordor Intelligence's Africa Cng and Lpg Vehicle Market Estimate Compared With Other Published Estimates
Published market numbers for Africa CNG and LPG vehicles can differ because firms define the market boundary differently and then apply different price and adoption assumptions. In our experience, the biggest differences come from whether the value is tied to vehicle sales, conversion services, or a mix, and also from how each source treats OEM fitment versus aftermarket retrofits.
Vehicle registration signals, refueling station additions, and conversion program disclosures are the checks that keep Mordor Intelligence's estimate aligned to on-road adoption, since retrofits are counted only when supported by country-level evidence on approvals and operating activity. Another common gap driver is the pricing layer, because some studies apply a single pan-Africa average conversion cost even though cylinder sourcing, taxes, and labor rates vary by country. Timing can also shift results, since faster refresh cycles can capture new station projects and incentive resets earlier, which can move the short-term market value noticeably.
Benchmark comparison
| Source | Market Size | Gaps in Research Methodology |
|---|---|---|
| Mordor Intelligence | USD 1.54 B (2025) | |
| Trade Journal B | USD 1.37 B (2025) | Often leans more heavily on reported conversion program budgets and stated targets, which can undercount private retrofits and smaller fleet activity not captured in public program summaries. |
| Regional Consultancy A | USD 1.28 B (2025) | Tends to apply a tighter inclusion rule by focusing mainly on factory-fitted or formally registered alternative-fuel vehicles, which can exclude informal but economically meaningful retrofit volumes in some countries. |
The comparison suggests that most of the spread comes from what is counted as in-scope conversion activity and how strictly registrations are used as the gatekeeper for demand. By tying totals to repeatable country signals and then sanity-checking with supplier and fleet feedback, the final number stays explainable, and it can be updated cleanly as infrastructure and policy conditions change.


Key Questions Answered in the Report
What is the forecast value of the African CNG and LPG vehicle market by 2031?
The market is projected to reach USD 2.29 billion by 2031, advancing at a 6.84% CAGR.
Which country currently leads adoption?
Egypt leads with 38.40% of 2025 conversions, supported by more than 800 CNG stations.
Why are buses and coaches switching fastest to gaseous fuels?
High annual mileage shortens payback periods, driving a 6.90% CAGR in conversions for these vehicles.
How significant is the aftermarket role in conversions?
Retrofit kits account for 76.95% of 2025 installations, reflecting limited OEM model availability.
What policy measures accelerate uptake in Nigeria?
The Presidential CNG Initiative combines conversion rebates, tax incentives, and public-fleet mandates backed by USD 450 million in funding.
Which technology trend is shaping heavy-duty applications?
HPDI dual-fuel systems, commercialized through the Volvo-Westport venture, allow diesel engines to displace up to 45% of diesel with natural gas.
Page last updated on:


 Your data is secure and never sold or shared.


