India CNG Vehicles Market Size and Share
Market Overview
| Study Period | 2017 - 2029 |
|---|---|
| Forecast Data Period | 2025 - 2029 |
| Historical Data Period | 2017 - 2023 |
| Market Size (2025) | USD 10.38 Billion |
| Market Size (2029) | USD 13.55 Billion |
| Growth Rate (2025 - 2029) | 6.88% CAGR |
| Market Concentration | High |
Major Players*Disclaimer: Major Players sorted in no particular order Image © Mordor Intelligence. Reuse requires attribution under CC BY 4.0. | |

India CNG Vehicles Market Analysis by Mordor Intelligence
The India CNG Vehicles Market size is estimated at 10.38 billion USD in 2025, and is expected to reach 13.55 billion USD by 2029, growing at a CAGR of 6.88% during the forecast period (2025-2029).
India's CNG vehicles India market is experiencing a transformative shift driven by the convergence of environmental consciousness and economic pragmatism. The industry landscape is dominated by established players, with Maruti Suzuki maintaining a commanding 69.72% CNG market share in India in 2023, reflecting strong consumer trust in traditional manufacturers transitioning to alternative fuel vehicles. The market's evolution is further supported by robust infrastructure development, evidenced by the significant expansion of publicly available charging stations, which reached 10,900 units in 2022. This infrastructure growth has been instrumental in boosting consumer confidence and facilitating wider adoption of CNG cars in India across various segments.
Technological advancements in CNG vehicles India manufacturing have been marked by significant innovations and strategic collaborations. In June 2023, BHEL and VE Commercial Vehicles formed a strategic partnership for the development and deployment of Type-IV Cylinders, demonstrating the industry's commitment to advancing CNG technology. The sector has also witnessed remarkable progress in cost optimization, with battery pack prices declining to 171 USD/kWh in 2023, making the CNG powered vehicles market increasingly cost-competitive. These developments have been complemented by manufacturers' aggressive product launches, exemplified by Maruti Suzuki's introduction of the FRONX S-CNG in July 2023 and Tata Motors' launch of the Altroz iCNG with twin-cylinder technology in May 2023.
The market is experiencing a notable shift in consumer preferences, particularly in the commercial vehicle sector. In June 2023, Ashok Leyland announced plans to expand its alternative fuel portfolio, including the development of four new CNG vehicle models, highlighting the industry's response to growing CNG demand in India for sustainable transportation solutions. This transformation is particularly evident in the used car market, which reached a significant value of USD 32,877.7 million in 2022, indicating strong consumer interest in both new and pre-owned CNG cars in India. The trend reflects a broader market maturation where CNG vehicles are increasingly viewed as practical alternatives to conventional fuel vehicles.
The industry's evolution is characterized by increasing sophistication in vehicle technology and manufacturing processes. Manufacturers are focusing on developing advanced CNG systems that offer improved performance, reliability, and safety features. This technological progression is evident in the introduction of dual-fuel capabilities, enhanced fuel management systems, and improved storage solutions. The market has also witnessed the emergence of specialized service networks and maintenance infrastructure, ensuring the long-term sustainability of CNG vehicles India operations. These developments are complemented by the integration of digital technologies for monitoring fuel efficiency and vehicle performance, making CNG vehicles more attractive to both individual and fleet operators.
India CNG Vehicles Market Trends and Insights
India's auto interest rates have shown a consistent downward trend, driven by RBI's measures and evolving lending practices
- In recent times, India's auto interest rate stood at approximately 8.567%, marking a decline from the 8.698% observed in 2021. This slight decrement of about 1.5% continues the trend from the prior year, wherein rates reduced from 9.15% in 2019 to 8.698% in 2021. Factors underpinning these dynamics may encompass monetary policy decisions by the Reserve Bank of India (RBI), domestic credit demand, and broader macroeconomic conditions.
- During 2017-2023, India's auto interest rate was observed at 9.508%. Over the subsequent years, the rate experienced minor fluctuations, descending slightly to 9.454% in 2018 and then marginally ascending to 9.466% in 2019. However, a more significant decline was observed from 2019 onwards, culminating at 8.567% in 2022. Reports from the RBI suggest that these shifts could be attributed to a combination of monetary easing measures, evolving lending practices, and attempts to bolster economic growth in the face of challenges such as the global pandemic.
- The recent trend analysis of India's auto interest rates anticipates a continued trend of relatively lower interest rates in the coming years. The current decrease to 8.567% in 2022, building on the decline from 9.15% in 2019, reflects a deliberate effort by the Reserve Bank of India (RBI) to stimulate economic growth. This downward pressure on rates is likely to persist as the RBI continues to employ monetary easing measures and lending practices evolve to support credit demand.


Government initiatives and stringent norms drive rapid growth in the electric vehicle market in India
- India's electric vehicle (EV) market is in a growth phase, with the government actively formulating strategies to combat pollution. The Fame India scheme, launched in 2015, has played a pivotal role in driving vehicle electrification. Building on its success, Fame Phase 2, active till April 2022, further bolstered EV sales, especially in 2021, with the government offering subsidies like INR 10,000 grants for electric cars with battery capacities up to 15 kWh.
- State governments across India are increasingly incorporating electric buses into their fleets, aiming to transition from internal combustion engine (ICE) buses. This move not only cuts operational costs but also curbs carbon emissions and improves air quality. In a notable move, the Delhi government greenlit the procurement of 300 new low-floor electric (AC) buses in March 2021, with 100 of them hitting the roads in January 2022. These initiatives contributed to a significant 62.58% surge in demand for electric commercial vehicles in India in 2022 over 2021.
- The demand for electric cars has surged in recent times, driven by the government's introduction of stringent norms. In August 2021, the Indian government unveiled the Vehicle Scrappage Policy, targeting the phasing out of polluting and unfit vehicles, irrespective of their age. This policy, set to be implemented by 2024, is steering consumers toward electric cars. Additionally, the government has set an ambitious target of having 30% of all cars in India electrified by 2030. These initiatives are poised to propel electric car sales during the 2024-2030 period in India.

OTHER KEY INDUSTRY TRENDS COVERED IN THE REPORT
- India's population, driven by factors like a young demographic and improved healthcare, is projected to reach 1,522.77 million by 2030, reflecting steady growth
- The consumer spending for vehicle purchases in Asia-Pacific, as exemplified by India, shows signs of cautious optimism during 2022-2023, following a period of volatility
- The combined revenue from shared rides in India is expected to rise consistently driven by factors like technological advancements, urbanization, and shifting consumer preferences
- Electric vehicle sales in India increased because of the falling battery prices and government incentives
- The Indian vehicle market shows resilience with a strong recovery in consumer spending and vehicle purchases
- The numerous tax hikes in the country were expected to increase fuel prices in 2023
- India's GDP per capita is expected to sustain growth, reaching USD 4,205.47 by 2030
- India's journey toward lower inflation sets the stage for economic resilience and investor confidence
- India's electric vehicle charging station market surges with 6,800 slow charging and 4,100 fast charging stations in 2022
- Various new entries and new product launches may accelerate the battery pack market in India
- The used car sales market in India presents a landscape teeming with opportunities and growth
- Suzuki and Hyundai lead India's HEV sector, while Toyota and Renault face declining numbers
Segment Analysis: Vehicle Type
Light Commercial Pick-up Trucks Segment in India CNG Vehicles Market
Light Commercial Pick-up Trucks dominate the India CNG vehicles market, holding approximately 41% market share in 2024. This segment's leadership position is driven by several key factors, including lower operational costs compared to diesel variants, reduced emissions making them environmentally friendly, and strong government incentives promoting CNG commercial vehicle adoption. The segment has also benefited from the expanding CNG infrastructure network across major transportation corridors and industrial hubs in India. Additionally, the segment demonstrates robust growth potential with a projected growth rate of nearly 10% during 2024-2029, driven by increasing demand for last-mile delivery solutions, rising e-commerce activities, and growing adoption of CNG trucks by fleet operators looking to optimize their operational costs while meeting stringent emission norms.
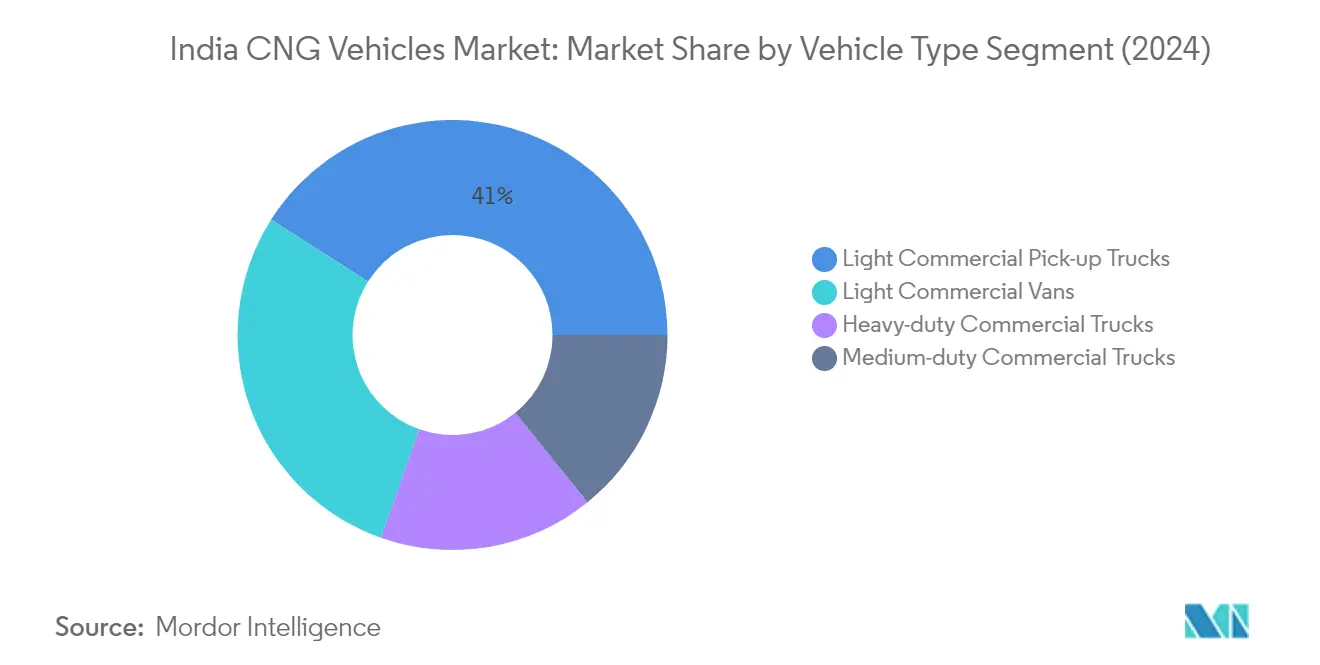

Remaining Segments in Vehicle Type
The other segments in the India CNG vehicles market include Light Commercial Vans, Heavy-duty Commercial Trucks, and Medium-duty Commercial Trucks, each serving distinct transportation needs. Light Commercial Vans are particularly popular in urban delivery operations and intracity logistics due to their maneuverability and fuel efficiency. Heavy-duty Commercial Trucks cater to long-haul transportation and heavy cargo movement, with CNG trucks in India gaining traction among fleet operators looking to reduce their carbon footprint. Medium-duty Commercial Trucks serve the intermediate segment, finding applications in regional distribution and specialized transportation services, with manufacturers increasingly offering CNG variants to meet diverse customer requirements and environmental regulations. The commercial natural gas vehicles market is witnessing a shift as the light and heavy duty natural gas vehicle market expands, driven by these segments adapting to sustainable practices.
Competitive Landscape
Top Companies in India CNG Vehicles Market
The Indian CNG vehicles market is characterized by intense competition and continuous innovation among key players, including Maruti Suzuki, Tata Motors, Hyundai Motor India, Mahindra & Mahindra, and VE Commercial Vehicles. Companies are focusing on expanding their CNG car manufacturers in India portfolios through new model launches and variant additions across passenger and commercial vehicle segments. Product innovation remains at the forefront, with manufacturers developing advanced CNG technologies, improving fuel efficiency, and enhancing vehicle performance. Operational agility is demonstrated through rapid adaptation to market demands, with companies strategically positioning their manufacturing facilities near key markets and CNG infrastructure hubs. Strategic moves include partnerships for technology development, joint ventures for manufacturing, and collaborations for expanding CNG infrastructure. Market expansion strategies involve strengthening dealer networks, improving after-sales service capabilities, and penetrating tier-2 and tier-3 cities.
Domestic Players Lead Market with Innovation
The competitive landscape is dominated by domestic manufacturers, with Maruti Suzuki and Tata Motors holding significant CNG vehicles market share in India through their extensive product portfolios and nationwide presence. These local players leverage their deep understanding of Indian market dynamics, established distribution networks, and strong brand recognition to maintain their leadership positions. The market shows high consolidation, with the top three players accounting for the majority of market share, while smaller players focus on specific vehicle segments or regional markets. The presence of global automotive giants like Hyundai adds an international dimension to the competition, bringing global technologies and practices to the Indian market.
The market exhibits limited merger and acquisition activity, with companies preferring organic growth through capacity expansion and product development. Companies are focusing on vertical integration strategies to control costs and maintain quality standards. The competitive dynamics are shaped by factors such as manufacturing capabilities, distribution reach, after-sales service network, and the ability to offer cost-effective CNG solutions. Local manufacturing presence and the ability to customize products for Indian conditions have become crucial differentiators in the market.
Innovation and Infrastructure Drive Future Success
Success in the Indian CNG vehicles market increasingly depends on manufacturers' ability to develop innovative products that balance performance with cost-effectiveness. Companies need to focus on developing advanced CNG technologies, improving fuel efficiency, and enhancing vehicle performance while maintaining competitive pricing. Building strong relationships with CNG infrastructure providers and participating in the expansion of CNG station networks will be crucial for market growth. Manufacturers must also invest in research and development to address technical challenges and improve overall vehicle performance while maintaining compliance with evolving emission norms.
For contenders looking to gain market share, focusing on underserved segments and regions with growing CNG infrastructure presents significant opportunities. Success will depend on developing region-specific strategies, building strong dealer networks, and offering competitive financing options. The regulatory environment continues to favor CNG vehicles through various incentives and policies promoting cleaner fuels, creating a supportive framework for market growth. Companies must also address the challenges of end-user concerns regarding CNG vehicle performance, maintenance, and resale value through improved technology and after-sales support. Building consumer confidence through transparent communication about CNG technology benefits and safety features will be essential for market expansion. Additionally, the integration of natural gas automotive technologies and enhancements in CNG fuel system design are pivotal for future advancements.
India CNG Vehicles Industry Leaders
Ashok Leyland Limited
Hyundai Motor India Limited
Mahindra & Mahindra Limited
Maruti Suzuki India Limited
Tata Motors Limited
- *Disclaimer: Major Players sorted in no particular order


Recent Industry Developments
- August 2023: Tata Motors introduced upgraded CNG variants for its Tiago and Tigor models, along with the launch of the new Punch iCNG. The Tiago iCNG is priced between USD 8,750 and USD 10,800, while the Tigor iCNG is priced between USD 10,376 and USD 11,879. The Punch iCNG is priced from USD 11,221 to USD 15,334.
- July 2023: Maruti Suzuki India Limited introduced FRONX S-CNG in its premium retail channel NEXA for a starting price of INR 841.5 thousand (USD 11,462.64) and going up to INR 927.5 thousand (USD12,630.14).
- July 2023: Hyundai Motor India Limited (HMIL) launched the compact SUV Exter for a price of INR 599.9 thousand (USD 8,113.76), going up to INR 932 thousand (USD 12,470.72). It comes equipped with a 1.2 l Kappa gasoline, a 4-cylinder engine (E20 fuel ready) with an option to choose from 3 powertrains that are manual transmission (MT), automated manual transmission (AMT), and gasoline and CNG engine with manual transmission.


India CNG Vehicles Market Report Scope
Commercial Vehicles are covered as segments by Vehicle Type.| Commercial Vehicles | Light Commercial Vehicles | Light Commercial Pick-up Trucks |
| Light Commercial Vans | ||
| Trucks | Heavy-duty Commercial Trucks | |
| Medium-duty Commercial Trucks | ||
| Vehicle Type | Commercial Vehicles | Light Commercial Vehicles | Light Commercial Pick-up Trucks |
| Light Commercial Vans | |||
| Trucks | Heavy-duty Commercial Trucks | ||
| Medium-duty Commercial Trucks | |||


Market Definition
- Vehicle Type - The category includes passenger cars and commercial vehicles.
- Vehicle Body Type - Under Passenger Cars, the category includes Hatchbacks, Sedans, Sports Utility Vehicles, and Multi-purpose Vehicles; for Commercial Vehicles, it covers Light Commercial Pick-up Trucks, Light Commercial Vans, Medium-duty Commercial Trucks, Heavy-duty Commercial Trucks, and Medium and Heavy Duty Buses.
- Fuel Category - The category exclusively covers Compressed Natural Gas (CNG).
| Keyword | Definition |
|---|---|
| Electric Vehicle (EV) | A vehicle which uses one or more electric motors for propulsion. Includes cars, buses, and trucks. This term includes all-electric vehicles or battery electric vehicles and plug-in hybrid electric vehicles. |
| BEV | A BEV relies completely on a battery and a motor for propulsion. The battery in the vehicle must be charged by plugging it into an outlet or public charging station. BEVs do not have an ICE and hence are pollution-free. They have a low cost of operation and reduced engine noise as compared to conventional fuel engines. However, they have a shorter range and higher prices than their equivalent gasoline models. |
| PEV | A plug-in electric vehicle is an electric vehicle that can be externally charged and generally includes all-electric vehicles as well as plug-in hybrids. |
| Plug-in Hybrid EV | A vehicle that can be powered either by an ICE or an electric motor. In contrast to normal hybrid EVs, they can be charged externally. |
| Internal combustion engine | An engine in which the burning of fuels occurs in a confined space called a combustion chamber. Usually run with gasoline/petrol or diesel. |
| Hybrid EV | A vehicle powered by an ICE in combination with one or more electric motors that use energy stored in batteries. These are continually recharged with power from the ICE and regenerative braking. |
| Commercial Vehicles | Commercial vehicles are motorized road vehicles designed for transporting people or goods. The category includes light commercial vehicles (LCVs) and medium and heavy-duty vehicles (M&HCV). |
| Passenger Vehicles | Passenger cars are electric motor– or engine-driven vehicles with at least four wheels. These vehicles are used for the transport of passengers and comprise no more than eight seats in addition to the driver’s seat. |
| Light Commercial Vehicles | Commercial vehicles that weigh less than 6,000 lb (Class 1) and in the range of 6,001–10,000 lb (Class 2) are covered under this category. |
| M&HDT | Commercial vehicles that weigh in the range of 10,001–14,000 lb (Class 3), 14,001–16,000 lb (Class 4), 16,001–19,500 lb (Class 5), 19,501–26,000 lb (Class 6), 26,001–33,000 lb (Class 7) and above 33,001 lb (Class 8) are covered under this category. |
| Bus | A mode of transportation that typically refers to a large vehicle designed to carry passengers over long distances. This includes transit bus, school bus, shuttle bus, and trolleybuses. |
| Diesel | It includes vehicles that use diesel as their primary fuel. A diesel engine vehicle have a compression-ignited injection system rather than the spark-ignited system used by most gasoline vehicles. In such vehicles, fuel is injected into the combustion chamber and ignited by the high temperature achieved when gas is greatly compressed. |
| Gasoline | It includes vehicles that use gas/petrol as their primary fuel. A gasoline car typically uses a spark-ignited internal combustion engine. In such vehicles, fuel is injected into either the intake manifold or the combustion chamber, where it is combined with air, and the air/fuel mixture is ignited by the spark from a spark plug. |
| LPG | It includes vehicles that use LPG as their primary fuel. Both dedicated and bi-fuel LPG vehicles are considered under the scope of the study. |
| CNG | It includes vehicles that use CNG as their primary fuel. These are vehicles that operate like gasoline-powered vehicles with spark-ignited internal combustion engines. |
| HEV | All the electric vehicles that use batteries and an internal combustion engine (ICE) as their primary source for propulsion are considered under this category. HEVs generally use a diesel-electric powertrain and are also known as hybrid diesel-electric vehicles. An HEV converts the vehicle momentum (kinetic energy) into electricity that recharges the battery when the vehicle slows down or stops. The battery of HEV cannot be charged using plug-in devices. |
| PHEV | PHEVs are powered by a battery as well as an ICE. The battery can be charged through either regenerative breaking using the ICE or by plugging into some external charging source. PHEVs have a better range than BEVs but are comparatively less eco-friendly. |
| Hatchback | These are compact-sized cars with a hatch-type door provided at the rear end. |
| Sedan | These are usually two- or four-door passenger cars, with a separate area provided at the rear end for luggage. |
| SUV | Popularly known as SUVs, these cars come with four-wheel drive, and usually have high ground clearance. These cars can also be used as off-road vehicles. |
| MPV | These are multi-purpose vehicles (also called minivans) designed to carry a larger number of passengers. They carry between five and seven people and have room for luggage too. They are usually taller than the average family saloon car, to provide greater headroom and ease of access, and they are usually front-wheel drive. |


Research Methodology
Mordor Intelligence follows a four-step methodology in all its reports.
- Step-1: Identify Key Variables: To build a robust forecasting methodology, the variables and factors identified in Step-1 are tested against available historical market numbers. Through an iterative process, the variables required for market forecast are set and the model is built based on these variables.
- Step-2: Build a Market Model: Market-size estimations for the historical and forecast years have been provided in revenue and volume terms. Market revenue is calculated by multiplying the sales volume with their respective average selling price (ASP). While estimating ASP factors like average inflation, market demand shift, manufacturing cost, technological advancement, and varying consumer preference, among others have been taken into account.
- Step-3: Validate and Finalize: In this important step, all market numbers, variables, and analyst calls are validated through an extensive network of primary research experts from the market studied. The respondents are selected across levels and functions to generate a holistic picture of the market studied.
- Step-4: Research Outputs: Syndicated Reports, Custom Consulting Assignments, Databases & Subscription Platforms.


