Cloud Point-of-Sale (PoS) Market Size and Share
Market Overview
| Study Period | 2020 - 2031 |
|---|---|
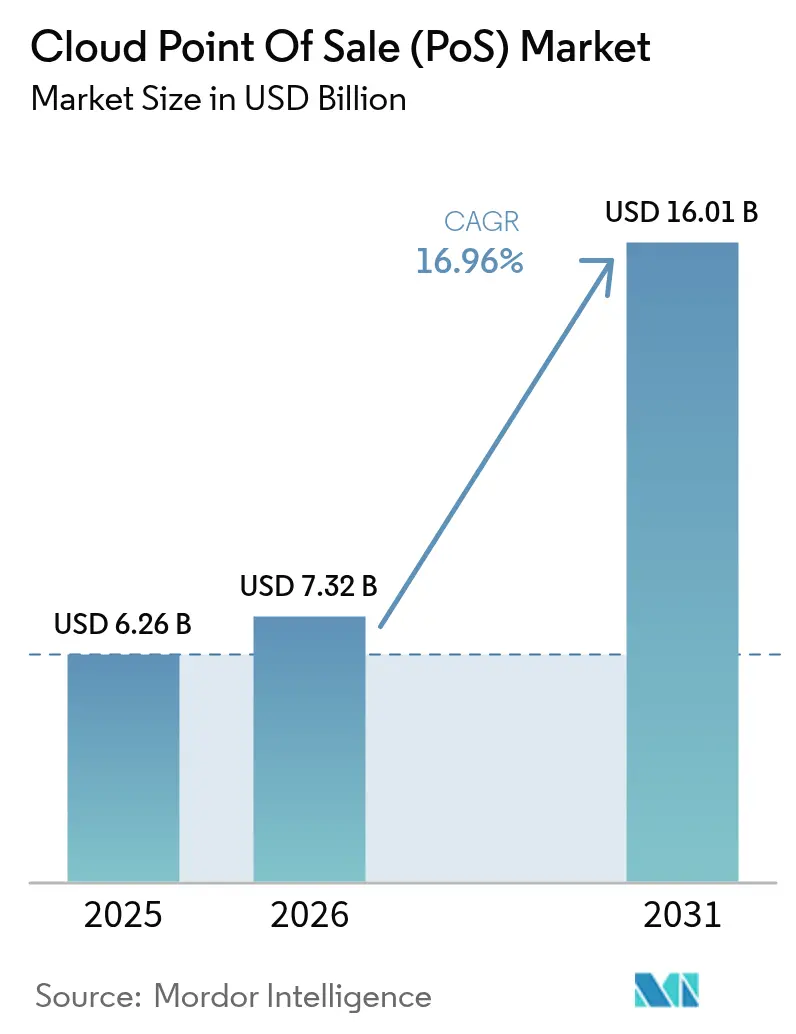
| Market Size (2026) | USD 7.32 Billion |
| Market Size (2031) | USD 16.01 Billion |
| Growth Rate (2026 - 2031) | 16.96% CAGR |
| Fastest Growing Market | Asia-Pacific |
| Largest Market | North America |
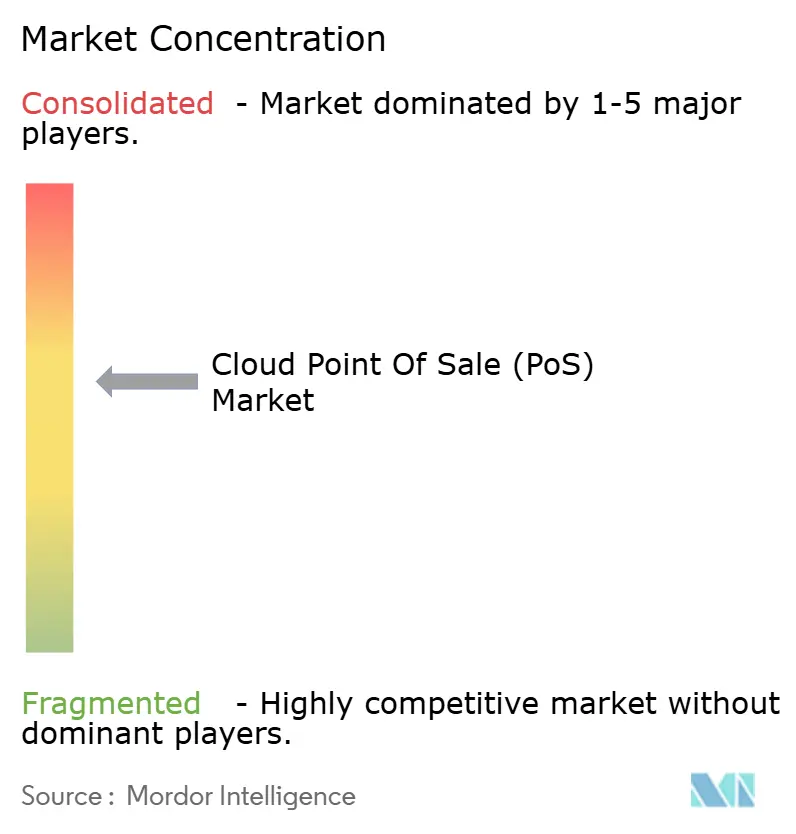
| Market Concentration | Medium |
Major Players *Disclaimer: Major Players sorted in no particular order Image © Mordor Intelligence. Reuse requires attribution under CC BY 4.0. | |
Cloud Point-of-Sale (PoS) Market Analysis by Mordor Intelligence
Cloud point of sale market size in 2026 is estimated at USD 7.32 billion, growing from 2025 value of USD 6.26 billion with 2031 projections showing USD 16.01 billion, growing at 16.96% CAGR over 2026-2031. Greater smartphone usage, seamless digital payment experiences, and real-time data visibility continue to propel adoption. Retailers are swapping static tills for mobile terminals to remove checkout queues, while hospitality operators rely on unified platforms to blend ordering, payments, and loyalty programs. Governments are tightening rules on cash handling and encouraging electronic transactions, which further nudges merchants toward cloud solutions. Vendors are responding by embedding artificial intelligence that transforms transaction logs into predictive insights, helping operators trim stockouts, personalize offers, and boost margins.
Key Report Takeaways
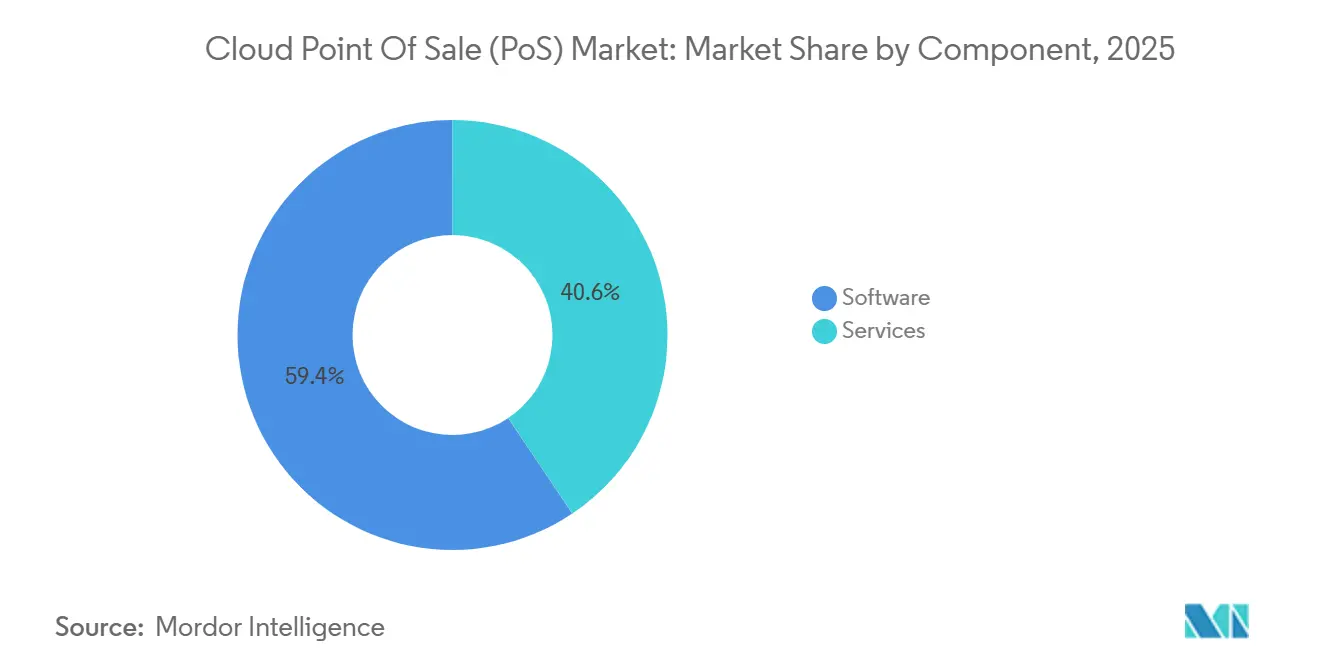
- By component, software held 59.40% of the cloud point of sale market share in 2025, while services are forecast to grow at a 20.95% CAGR through 2031.
- By PoS type, mobile solutions led with 57.20% of the cloud point of sale market size in 2025; fixed systems will expand at a slower 12.41% CAGR to 2031.
- By deployment model, public cloud accounted for 71.40% of 2025 revenue, whereas hybrid cloud is set to record the fastest 23.74% CAGR through 2031.
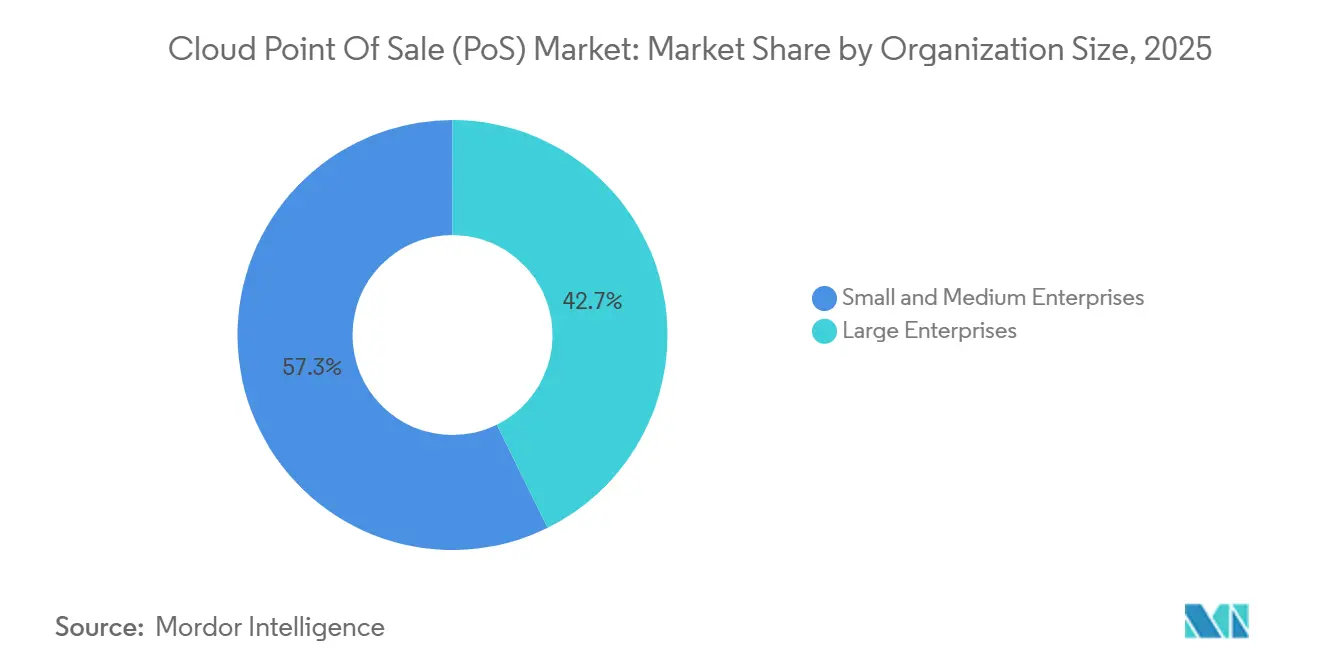
- By organization size, SMEs commanded a 57.30% share of 2025 revenue, while large enterprises are projected to grow at an 18.87% CAGR over the forecast horizon.
- By end-user industry, retail & consumer goods contributed 38.40% of 2025 revenue; healthcare is the quickest climber with a 21.37% CAGR to 2031.
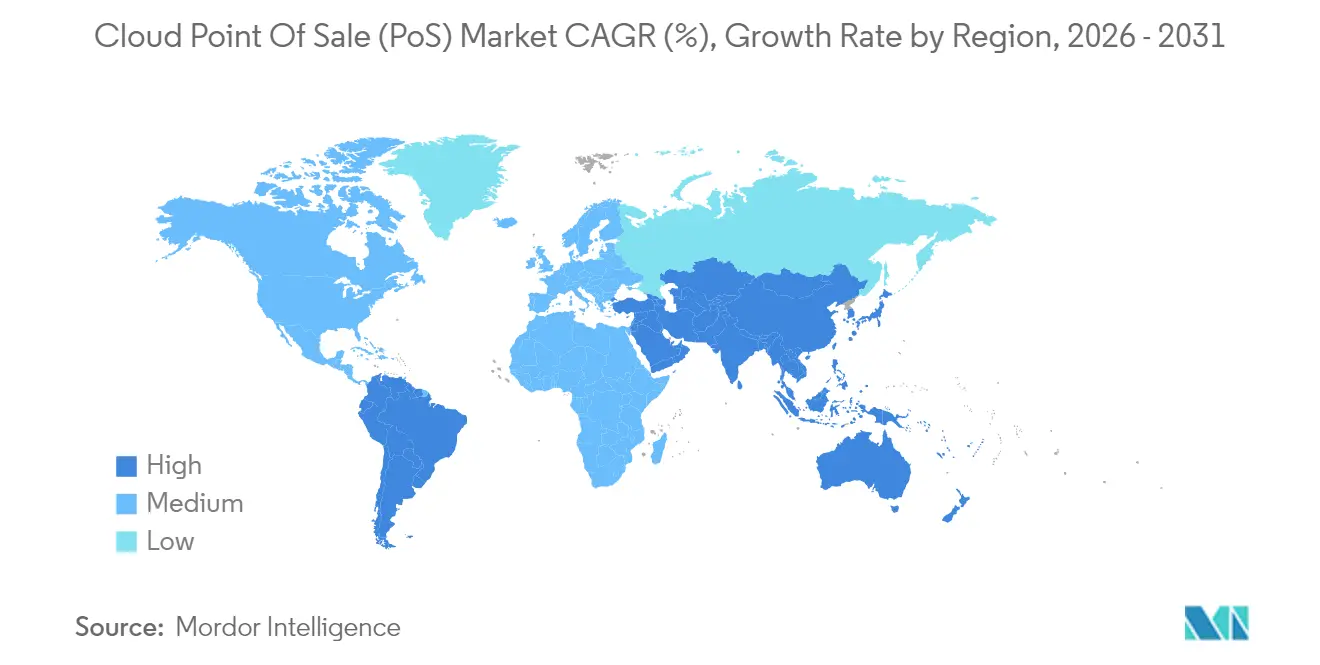
- By geography, North America contributed 34.70% of 2025 revenue; Asia-Pacific is the quickest climber with a 19.92% CAGR to 2031.
Note: Market size and forecast figures in this report are generated using Mordor Intelligence’s proprietary estimation framework, updated with the latest available data and insights as of 2026.
Global Cloud Point-of-Sale (PoS) Market Trends and Insights
Drivers Impact Analysis*
| Driver | (~) % Impact on CAGR Forecast | Geographic Relevance | Impact Timeline |
|---|---|---|---|
| Cashless-transaction momentum | +5.2% | Global, with highest impact in North America and Europe | Short term (≤ 2 years) |
| Mobile-first commerce adoption | +4.7% | Global, with significant impact in Asia-Pacific | Medium term (2-4 years) |
| Omnichannel analytics demand | +3.8% | North America, Europe, and developed APAC markets | Medium term (2-4 years) |
| Regulatory push for e-payments | +2.9% | Europe, Asia-Pacific, and Latin America | Long term (≥ 4 years) |
| AI-driven inventory optimization tools | +2.1% | North America, Europe | Medium term (2-4 years) |
| SaaS revenue-share pricing models | +1.8% | Global | Short term (≤ 2 years) |
| Source: Mordor Intelligence | |||
Cashless-transaction momentum
Only 10% of in-store payments are expected to remain cash-based by 2025, a tipping point that forces merchants to accept cards, mobile wallets, and account-to-account payments. [1]Castles Technology, “POS, an Intersection of Innovation and Experience,” castlestech.com Cloud PoS platforms let operators add new tenders overnight without swapping hardware, making them the default choice for future-proofing payment acceptance. The shift is most visible in North America, where contactless cards dominate, and in Europe, where regulators restrict cash thresholds. Biometric authentication is joining the mix, allowing face or fingerprint-verified payments that boost trust and speed. As usage grows, acquirers lower interchange fees for digital transactions, widening the total addressable cloud point of sale market.
Mobile-first commerce adoption
Mobile commerce will surpass USD 728 billion in 2025, accounting for nearly half of U.S. retail e-commerce sales. Such volumes demand mobile PoS hardware that turns any showroom corner, curbside location, or delivery van into a checkout point. The mPOS segment, valued at USD 44.26 billion in 2024, is projected to reach USD 80.58 billion by 2029. Asia-Pacific retailers frequently leapfrog fixed terminals and rely on QR or NFC phone payments that integrate seamlessly with cloud back ends. [2]Silkpay, “Boosting Retail: The Rise of mPOS Systems in 2024,” silkpay.us Retailers now view mPOS as a customer-experience lever—line-busting, delivering endless-aisle lookups, and facilitating personalised promotions that close sales faster. These factors collectively expand the cloud point of sale market while altering the traditional checkout footprint.
Omnichannel analytics demand
Eighty-five percent of operators already feed PoS data into digital engagement tools, using unified dashboards to understand buying paths and refine marketing. [3]Hospitality Tech, “2024 POS Software Trends Study,” hospitalitytech.com Cloud architectures facilitate the secure pooling of physical-store and online-cart data, giving merchants a 360-degree customer view. AI layers segment shoppers, predict basket sizes, and flag at-risk inventory before stockouts occur. Early adopters report double-digit lifts in repeat purchase rates, validating omnichannel analytics as a competitive necessity. Consequently, analytics-ready platforms widen the cloud point of sale market appeal among growth-oriented retailers.
Regulatory push for e-payments
Policy makers, from the European Banking Authority to Indian regulators, steadily tighten e-payment rules. Measures such as the EU Payments Services Directive 2 mandate strong customer authentication and transaction logging. Small merchants often lack the resources to upgrade legacy servers, so they adopt cloud platforms that roll out compliance updates automatically. [4]Fiskaly, “RKSV-Compliant POS Systems: A Guide for Providers,” fiskaly.com In Asia-Pacific, governments issue subsidies for QR-coded payments, a further catalyst for moving to managed PoS suites. Over the long haul, compliance burden converts into a tailwind for the cloud point of sale market as vendors position themselves as risk-mitigation partners.
Restraints Impact Analysis*
| Restraint | (~) % Impact on CAGR Forecast | Geographic Relevance | Impact Timeline |
|---|---|---|---|
| Data-security & compliance gaps | -2.8% | Global, with highest impact in Europe and North America | Medium term (2-4 years) |
| Bandwidth reliability in emerging markets | -2.3% | Asia-Pacific, Africa, and parts of Latin America | Long term (≥ 4 years) |
| Fragmented cross-border payment rules | -1.9% | Global, with highest impact on multinational retailers | Medium term (2-4 years) |
| Rising cyber-insurance premiums | -1.6% | North America, Europe | Short term (≤ 2 years) |
| Source: Mordor Intelligence | |||
Data-security and compliance gaps
High-profile breaches and PCI DSS penalties keep many enterprises on the fence about full cloud migration. Larger chains running legacy on-premise servers fear data residency risks even though modern PoS suites encrypt data in motion and at rest. Vendors counter with tokenisation, zero-trust architectures, and dedicated compliance teams, yet the perception gap lingers. Retailers in pharmaceuticals or luxury goods, where customer data sensitivity runs high, often insist on hybrid deployments, dampening near-term growth for public-cloud configurations within the cloud point of sale market.
Bandwidth reliability in emerging markets
Transaction failures during connectivity drops directly hit revenue and customer satisfaction. Rural outlets in Southeast Asia and sub-Saharan Africa often depend on 3G or unstable fibre lines. Hybrid PoS solutions that buffer transactions locally then sync later exist, but reconciliation complexity discourages adoption. Until telecom infrastructure matures, intermittent bandwidth will restrain the cloud point of sale market, especially for pure-cloud vendors.
*Our forecasts treat driver/restraint impacts as directional, not additive. The impact forecasts reflect baseline growth, mix effects, and variable interactions.
Segment Analysis
By Component: Software Dominates While Services Accelerate
The software segment captured 59.40% of the cloud point of sale market share in 2025, underscoring its role as the transaction engine and analytics hub. Recurring upgrades, real-time patches, and remote feature activation create sustained value without hardware refresh. Services, from implementation to managed analytics, are on a 20.95% CAGR climb that will enlarge the cloud point of sale market size for advisory and outsourcing specialists.
Modern suites bundle inventory control, staff scheduling, and CRM within a unified interface, reframing PoS software as the command centre for daily operations. Merchants lacking in-house IT staff turn to service integrators for deployment, custom workflows, and on-call support. As more retailers push omnichannel ambitions, demand for tailored integrations with last-mile delivery networks and ERP systems bolsters the services uptick, further expanding the cloud point of sale market.


By PoS Type: Mobile Solutions Redefine Transaction Locations
Mobile PoS solutions held 57.20% of 2025 revenue, a lead they will likely maintain thanks to a projected 22.84% CAGR through 2031. Retailers deploy tablet or handheld devices on shop floors, at pop-ups, and for curbside pick-ups, proving the flexibility that underpins cloud point of sale market momentum. Fixed terminals remain vital in high-throughput grocery lanes, but many now operate as cloud-linked nodes to harness centralised analytics.
Hardware advances—ruggedised casings, extended battery cycles, and cloud-native OS updates—make mobile units enterprise-grade. Half of surveyed retail executives plan mPOS rollouts to heighten service levels. In hospitality, tableside ordering accelerates meal turns while boosting gratuity rates. Such first-hand ROI evidence elevates mobile devices from a nice-to-have to a core pillar of the cloud point of sale market.
By Deployment Model: Hybrid Cloud Gains Momentum
Public cloud still commands 71.40% of installations thanks to its low entry cost, but the hybrid approach is forecast to clock the fastest 23.74% CAGR. Large chains keep sensitive data and fail-safe processing on local servers while offloading analytics and updates to hosted instances. This duality resolves data-sovereignty anxieties without sacrificing cloud scale, broadening the cloud point of sale market size for vendors that offer seamless split-architecture stacks.
Hybrid rollouts mitigate outage risks with automatic switchover modes, a feature prized by supermarkets and fuel stations where every minute of downtime erodes revenue. Conversely, private-cloud builds appeal to banks and airlines with stringent in-house compliance mandates. Continuous hardening of public-cloud security may gradually blur distinctions, but diversity in deployment options is set to remain a selling point throughout the cloud point of sale market.
By Organization Size: SMEs Lead, Large Enterprises Accelerate
SMEs accounted for 57.30% of 2025 billings, embracing subscription models that eliminate large upfront license costs. Turnkey bundles equip independent retailers, cafés, and salons with enterprise-grade tools, democratising capabilities once reserved for chains. Meanwhile, large enterprises are onboarding at a 18.87% CAGR, drawn by platform-wide updates and global-store orchestration.
For small firms, cloud PoS means automatic backups and low IT overhead—critical in an environment where owner-operators juggle multiple roles. Large chains, frustrated by patchy legacy stacks and siloed data, increasingly view cloud migration as central to broader digital transformation. Consolidating dozens of custom builds onto a unified SaaS stack slashes maintenance spend and empowers real-time HQ oversight, reinforcing the long-run expansion of the cloud point of sale market.
By End-user Industry: Healthcare Disrupts Retail Dominance
Retail and consumer goods retained a 38.40% hold on 2025 revenue thanks to dense transaction volumes and loyalty-driven business models. Yet healthcare is rushing ahead with a 21.37% CAGR as providers embed card-on-file capabilities and EHR links that shrink billing cycles. Hospitals and clinics increasingly treat payment experience as part of patient care, injecting fresh momentum into the cloud point of sale market.
Quick-service restaurants adopt cloud suites to streamline kitchen operations, while entertainment venues combine ticketing, concessions, and merchandising under one pane of glass. Transportation and logistics operators feed depot data into central ERP hubs, reinforcing multi-industry applicability of cloud PoS. This vertical diversification shields the cloud point of sale industry from sector-specific downturns, keeping its growth curve resilient.
Geography Analysis
North America led with 34.70% of 2025 sales, fueled by tech-savvy consumers and vendor concentration. U.S. restaurant chains such as those running Toast saw notable performance gains after integrating ordering, payments, and loyalty on a single stack. Clear standards around tokenisation and contactless transactions also fast-tracked platform rollouts, setting a blueprint for the wider cloud point of sale market.
Asia-Pacific is the fastest climber, projected at 19.92% CAGR to 2031. China’s Alipay and WeChat Pay ecosystems push merchants toward native integrations, while Japan offsets labour shortages with self-checkout kiosks. India’s digitisation incentives for SMEs unlock new footholds for regional vendors, amplifying mPOS use in tier-2 towns. As telecom upgrades narrow bandwidth gaps, cross-border commerce in the region will enlarge the cloud point of sale market size for multilingual, multi-currency suites.
Europe commands mature but regulation-driven demand. Mandates such as Germany’s Kassensicherungsverordnung and Austria’s RKSV require secure fiscal memory and tamper-proof logs. Many merchants opt for certified cloud stacks that deliver compliance updates remotely, buoying the cloud point of sale market. Latin America, the Middle East, and Africa remain nascent yet promising: improving wireless coverage and government fintech roadmaps should unlock double-digit growth, especially through hybrid offline-first architectures.

Competitive Landscape
The market is moderately fragmented. Tier-one vendors such as Block (Square), Shopify, and Oracle target multi-vertical merchants with extensible app stores and payment gateways. Niche leaders like Toast and Lightspeed specialise in hospitality and specialty retail, tailoring workflows to sector nuances. Innovations in artificial intelligence and predictive analytics act as key differentiators, guiding merchant decisions toward platforms that translate sales data into actionable insights.
Strategic alliances shape positioning. Shift4 Payments’ 2024 acquisition of Global Blue expanded duty-free refund handling, giving it a cross-border edge and lifting gross revenue by 30%. Shopify’s 2025 Summer Editions extended payment coverage to 16 countries, reinforcing omnichannel ambitions. Oracle’s integrated hospitality stack couples kitchen display, loyalty, and analytics, streamlining franchise rollouts. These moves intensify competition across the cloud point of sale market.
White-space opportunities remain in healthcare, automotive services, and regulated luxury retail. Vendors pursuing revenue-share pricing align growth incentives with merchant success, securing recurring annuities. AI-enabled fraud detection and voice-activated ordering are emerging battlegrounds, with early pilots indicating measurable labour savings. As functionality converges, brand reputation, ecosystem breadth, and compliance agility will dictate long-term winners in the cloud point of sale market.
Cloud Point-of-Sale (PoS) Industry Leaders
Block, Inc. (Square)
Shopify Inc.
Intuit Inc.
Lightspeed Commerce Inc.
Clover Network Inc. (Fiserv)
- *Disclaimer: Major Players sorted in no particular order

Recent Industry Developments
- May 2025: Shopify released its Summer Editions 2025 update, adding faster navigation and expanding global payment processing to 16 new countries.
- April 2025: Oracle unveiled an integrated SaaS stack for varied restaurant formats, enhancing operational efficiency.
- March 2025: Shift4 Payments acquired Global Blue Group to broaden international reach and tax-free shopping capabilities.
- February 2025: PAR Technology introduced AI-driven drive-thru automation for quick-service restaurants.


Research Methodology Framework and Report Scope
Market Definitions and Key Coverage
Our study defines the cloud point-of-sale market as all software, subscription services, and essential lightweight peripherals that process and store transactional data on remote servers accessed over the public, private, or hybrid cloud. The model covers fixed and mobile deployments that accept card, wallet, or QR payments and integrate inventory, CRM, and analytics modules.
Scope exclusions include pure on-premise POS systems, general payment terminals sold without cloud connectivity, and consulting revenue not bundled with a cloud POS license; these are outside our numbers.
Segmentation Overview
- By Component
- Software
- Services
- By PoS Type
- Fixed PoS
- Mobile / mPoS
- By Deployment Model
- Public Cloud
- Private Cloud
- Hybrid Cloud
- By Organization Size
- Small and Medium Enterprises (SMEs)
- Large Enterprises
- By End-user Industry
- Retail and Consumer Goods
- Hospitality and Restaurants
- Healthcare
- Entertainment and Leisure
- Transportation and Logistics
- Other End-user Industries
- By Geography
- North America
- United States
- Canada
- Mexico
- Europe
- Germany
- United Kingdom
- France
- Italy
- Rest of Europe
- Asia-Pacific
- China
- India
- Japan
- South Korea
- Rest of Asia-Pacific
- South America
- Brazil
- Argentina
- Rest of South America
- Middle East and Africa
- Middle East
- Saudi Arabia
- United Arab Emirates
- Rest of Middle East
- Africa
- South Africa
- Nigeria
- Rest of Africa
- Middle East
- North America
Detailed Research Methodology and Data Validation
Primary Research
We interviewed cloud POS software architects, tier-1 retailers, independent restaurateurs, and payment-gateway partners across North America, Europe, and Asia-Pacific. Conversations tested adoption rates, average seat licensing costs, and the share of transactions routed through cloud dashboards, filling gaps left by public statistics and aligning model assumptions with ground reality.
Desk Research
Mordor analysts first collated baseline data from tier-1 sources such as the U.S. Census Retail Indicators, Eurostat Digital Economy tables, RBI digital payments dashboards, and trade association releases from entities such as the National Retail Federation and the Asia-Pacific Council of Shopping Centers. Complementary insights came from company 10-Ks, investor decks, patent alerts in Questel, and shipment data in Volza that reveal hardware flows underlying cloud migrations. Subscription metrics from D&B Hoovers and curated news in Dow Jones Factiva helped quantify vendor scale, while patent citations guided us toward emerging features like tap-to-phone. The sources listed are illustrative; many additional public and paid references informed data collection, cross-checks, and clarifications.
Market-Sizing & Forecasting
A top-down reconstruction built global revenue from retail and hospitality transaction volumes, cloud penetration rates, and average subscription fees. Results were corroborated with selective bottom-up supplier roll-ups and channel checks to tune regional splits. Key variables include digital wallet share of checkout, annual SaaS price revisions, SME cloud adoption, regulatory pushes for e-receipt retention, and the spread of NFC-enabled smartphones. Forecasts to 2030 use multivariate regression blended with ARIMA for seasonality, and expert consensus adjusts scenario outliers. Any regional data void was bridged through logical proxies such as card-in-force growth before final triangulation.
Data Validation & Update Cycle
Outputs pass anomaly screening, senior-analyst peer review, and variance checks against independent indicators like payment network volumes. The report refreshes yearly, and interim revisions trigger when material events, such as large M&A or regulatory mandates, shift market fundamentals. A last-mile review ensures clients receive the freshest view.
Why Mordor's Cloud Point of Sale Baseline Commands Reliability
Published estimates often diverge because firms pick different product mixes, pricing ladders, base years, or refresh speeds. Our disciplined scoping and constant primary pulse checks minimize those gaps.
Key gap drivers include whether hardware sales are bundled, how aggressively mobile POS futures are modeled, currency conversion cut-offs, and the cadence at which SME churn is re-surveyed. Mordor keeps hardware separate, reports cloud revenue only, and updates models every twelve months, which is not common practice elsewhere.
Benchmark comparison
| Market Size | Anonymized source | Primary gap driver |
|---|---|---|
| USD 6.26 B (2025) | Mordor Intelligence | |
| USD 8.34 B (2025) | Regional Consultancy A | Includes hybrid and on-premise modules, limited primary validation |
| USD 6.50 B (2024) | Industry Journal B | Relies on license downloads, omits services revenue, earlier base year |
The comparison shows that once differing scopes and timing are adjusted, Mordor's 2025 baseline offers a balanced, transparent figure rooted in clear variables and repeatable steps, giving decision-makers a dependable reference.


Key Questions Answered in the Report
What is the current value of the cloud point of sale market?
The market is valued at USD 7.32 billion in 2026 and is projected to reach USD 16.01 billion by 2031.
Which region grows fastest in the cloud point of sale market?
Asia-Pacific is forecast to expand at a 19.92% CAGR, driven by mobile payments adoption and government e-payment initiatives.
Why are hybrid cloud deployments gaining popularity?
They combine public-cloud flexibility with on-premise control, satisfying data-sovereignty and uptime requirements in regulated or bandwidth-challenged environments.
How does artificial intelligence enhance cloud PoS platforms?
AI automates inventory optimisation, predicts customer behaviour, and flags fraud, allowing merchants to boost margins and personalise service.
Which industry vertical shows the fastest cloud PoS adoption?
Healthcare is advancing at a 21.37% CAGR as providers integrate billing with electronic health records for smoother patient experiences.
Page last updated on:


