
Market Overview
| Study Period | 2020 - 2031 |
|---|---|
| Forecast Data Period | 2026 - 2031 |
| Base Year Market Size (2025) | 23.62 Million units |
| Market Volume (2026) | 26.58 Million units |
| Market Volume (2031) | 47.98 Million units |
| Growth Rate (2026 - 2031) | 12.55 % |
| Market Concentration | Medium |
Major Players *Disclaimer: Major Players sorted in no particular order Image © Mordor Intelligence. Reuse requires attribution under CC BY 4.0. | |
Europe POS Terminal Market Analysis by Mordor Intelligence
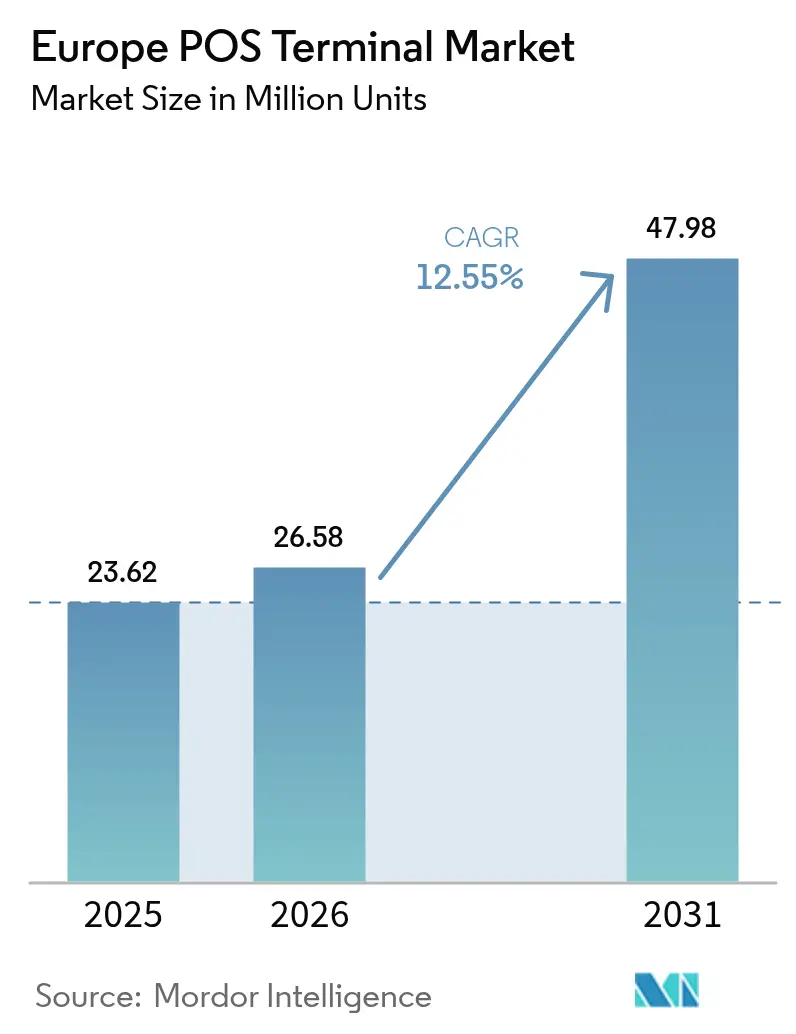
The Europe POS terminal market size was valued at USD 23.62 million units in 2025 and estimated to grow from USD 26.58 million units in 2026 to reach USD 47.98 million units by 2031, at a CAGR of 12.55% during the forecast period (2026-2031). The expansion has been underpinned by accelerated contactless adoption, regulatory mandates that force periodic hardware refresh, and merchants’ search for unified payment infrastructure that lowers total cost of ownership. Strong consumer preference for tap-to-pay, transit system digitization, and subsidy-backed roll-outs in smaller cities have collectively pushed shipment volumes higher in Western and Central Europe. Vendors that combine Android-based terminals, cloud analytics, and subscription billing have captured wallet share as merchants prioritize ROI. Meanwhile, SoftPOS introductions have broadened the addressable base by turning smartphones into certified acceptance points, challenging legacy fixed units but also enlarging overall payment acceptance capacity.
Key Report Takeaways
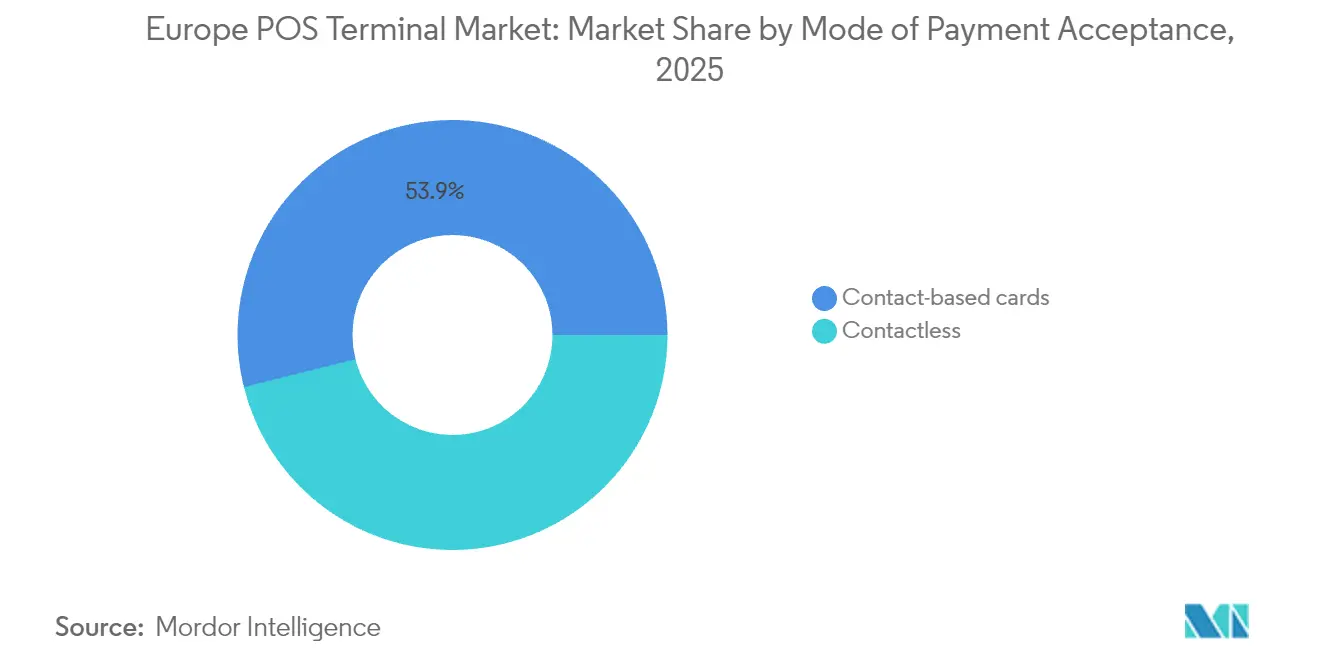
- By mode of payment acceptance, contact-based solutions held 53.90% of Europe POS terminal market share in 2025, while contactless devices are projected to register a 12.65% CAGR through 2031.
- By POS type, fixed systems dominated with 58.20% share of the Europe POS terminal market size in 2025; mobile and portable units are advancing at a 13.05% CAGR to 2031.
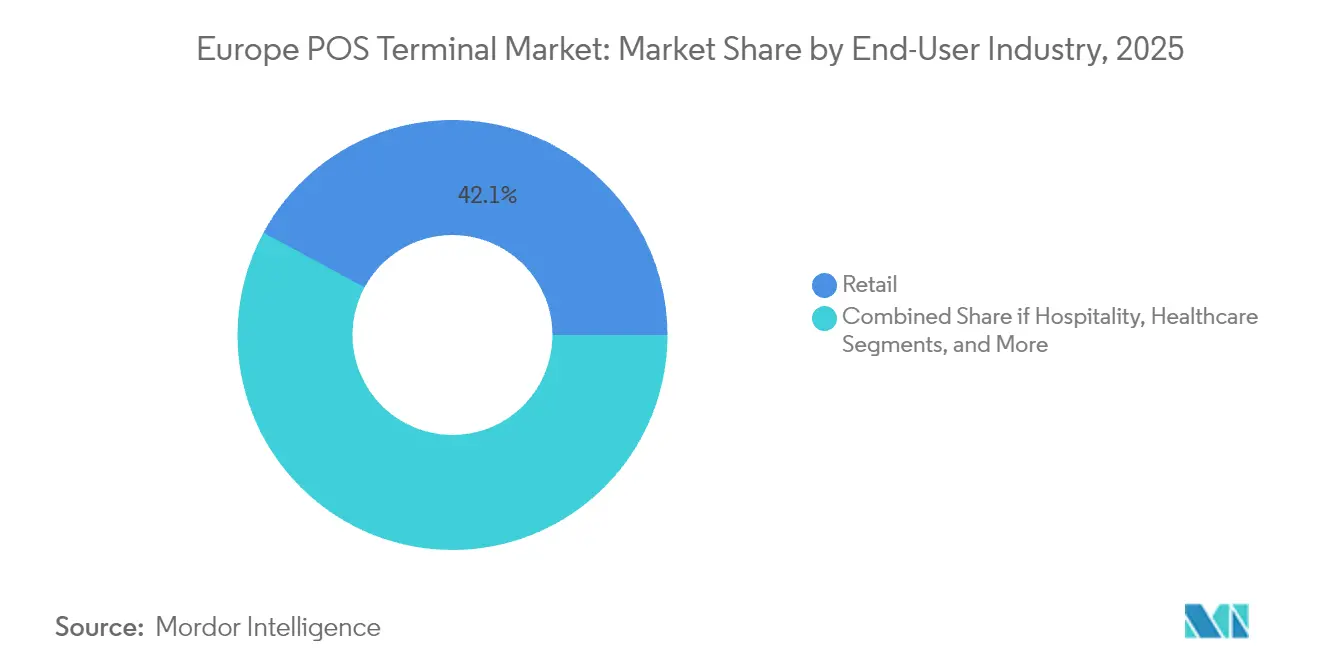
- By end-user, retail led with 42.10% revenue share in 2025; transportation and logistics is forecast to expand at a 13.35% CAGR through 2031.
Note: Market size and forecast figures in this report are generated using Mordor Intelligence’s proprietary estimation framework, updated with the latest available data and insights as of 2026.
Market Trends and Insights
Drivers Impact Analysis of Europe POS Terminal Market*
| Drivers Impact Analysis | (~) % Impact on CAGR Forecast | Geographic Relevance | Impact Timeline |
|---|---|---|---|
| PIDF subsidies accelerating Tier-3-Tier-6 roll-outs | +2.1% | Western Europe, Central Europe | Medium term (2-4 years) |
| Surging credit-card base (>100 million) lifts card-swipe volumes | +3.2% | EU-wide, UK | Short term (≤ 2 years) |
| Omni-payment Android POS integration | +2.8% | Nordics, DACH | Medium term (2-4 years) |
| GST e-invoice compliance driving real-time POS upgrades | +1.9% | Italy, France | Long term (≥ 4 years) |
| Smart-mall boom in Tier-2/3 cities raises fixed-POS demand | +1.7% | Germany, Spain, Poland | Medium term (2-4 years) |
| Advanced analytics/AI add-ons boosting retailer ROI | +1.3% | EU-wide | Long term (≥ 4 years) |
| Source: Mordor Intelligence | |||
PIDF subsidies accelerating Tier-3-Tier-6 roll-outs
Payment Infrastructure Development Fund programs lowered merchant on-boarding cost and spurred shipments into previously under-served rural districts. Worldline alone enrolled 6,300 micro-merchants on its Tap on Mobile platform during H1 2024, signaling how subsidy alignment quickly converts latent demand into active transaction volumes.[1]Worldline, “Q1 2025 Revenue,” worldline.com The subsidy window created a new recurring revenue stream as newly digitized merchants required value-added services such as analytics and inventory modules.
Surging credit-card base lifts card-swipe volumes
The European card base surpassed 100 million active cards in 2024, feeding higher card-present volumes and reinforcing merchant economics for upgrading POS estates.[2]Shift4, “Shift4 Acquires Majority Stake in Vectron Systems AG,” shift4.com Higher swipe density improved acquirer margins, encouraged loyalty-program integration, and strengthened the business case for contactless limits expansion.
Omni-payment Android POS integration
Ingenico, Verifone, and PAX Global released Android devices that combine EMV cards, QR, and BNPL acceptance in one unit, trimming counter clutter and support costs. Retailers in the Nordics adopted these terminals early, finding that unified interfaces cut average checkout time by 12 seconds per customer. Vendors consequently bundled subscription software, tilting revenue mix toward recurring income.
GST e-invoice compliance driving real-time POS upgrades
Italy’s mandate that fiscal registers and POS report VAT invoices in real time from January 2026 prompted merchants to replace non-compliant hardware. Pilot migrations in Milan and Rome in late 2024 proved that compliant endpoints reduced tax-filing labor by 15 hours per month and increased vendor service calls, benefitting after-sales revenue streams. Vendors with certified fiscal printers gained deterministic demand forecasting over the next four years.
Restraints Impact Analysis of Europe POS Terminal Market*
| Restraints Impact Analysis | (~) % Impact on CAGR Forecast | Geographic Relevance | Impact Timeline |
|---|---|---|---|
| Zero-MDR UPI erodes small-merchant economics | -2.4% | EU markets adopting instant payments | Short term (≤ 2 years) |
| QR-code ubiquity dampens new POS demand | -1.8% | Urban EU | Medium term (2-4 years) |
| High total cost of ownership for micro-merchants | -1.1% | Southern and Eastern Europe | Long term (≥ 4 years) |
| Draft PA-Offline rules raise compliance cost | -0.7% | Harmonized EU markets | Medium term (2-4 years) |
| Source: Mordor Intelligence | |||
Zero-MDR UPI erodes small-merchant economics
When regulators capped merchant discount at zero for instant payments, micro-merchants pivoted toward fee-free QR alternatives, slashing hardware rentals. Acquirers saw service fee compression, and POS suppliers lost first-unit sales in the café and kiosk segment.[3]Modern Treasury, “QR Codes for Payments Guide,” moderntreasury.com Larger chains, however, continued to rely on card rails because of richer data capture and chargeback management, tempering the downside.
QR-code ubiquity dampens new POS demand
Public transport and quick-service restaurants rolled out dynamic QR check-out flows that avoid EMV terminals altogether. In Amsterdam, OVpay’s open-loop QR code captured 15.2% of single-ride payments by June 2024, demonstrating consumer willingness to bypass traditional terminals. POS vendors responded by embedding QR modules into displays, but entry-level hardware sales still decelerated.
*Our forecasts treat driver/restraint impacts as directional, not additive. The impact forecasts reflect baseline growth, mix effects, and variable interactions.
Europe POS Terminal Market Segment Analysis
By Mode of Payment Acceptance:
Contactless Surge Reshapes InfrastructureContactless units delivered 12.65% CAGR through 2031 even though contact-based devices held a 53.90% Europe POS terminal market share in 2025. The higher limit for tap-to-pay without PIN in the EEA trimmed checkout friction, and transit systems such as Brussels STIB recorded 57% contactless adoption for single rides in 2024. Europe POS terminal market size expansion within this segment was further propelled by wallet providers like Apple Pay and Google Pay adding loyalty receipt delivery, raising merchant acceptance incentives.
Legacy contact-based terminals remained indispensable for high-ticket transactions and markets with older banking cards. Nonetheless, multi-interface devices such as Verifone’s P400 allowed merchants to replace dual hardware with one converged pinpad, moderating the cannibalization rate. As payment security upgrades migrate toward biometric user verification by 2028, contactless share is projected to edge past the 60% threshold, cementing its role as the principal growth engine of the Europe POS terminal market.



By POS Type:
Mobile Solutions Drive Deployment FlexibilityFixed systems controlled 58.20% of Europe POS terminal market share in 2025, but mobile and portable models are forecast to log a 13.05% CAGR, mirroring the continent’s shift toward service-anywhere commerce. Hospitality chains in Spain piloted PAX A50 Android handhelds linked to cloud back-office suites and reported a 9% sales uplift due to faster table-side ordering. The Europe POS terminal market size in mobile sub-segments is thus scaling disproportionately to transaction volumes as service providers bundle SaaS.
Fixed lanes continued to dominate grocery and fashion anchors thanks to wide peripheral support-scales, scanners, and fiscal printers. Retailers converted investment into predictive analytics by routing SKU-level data to AI engines, enabling shrinkage detection and price-elasticity modeling. Consequently, vendors that fused high-performance fixed units with cloud dashboards insulated their install base from mobile substitution, keeping replacement revenue steady.
By End-User Industry:
Transportation Leads Digital TransformationRetail captured 42.10% of 2025 revenue; still, transportation and logistics is expected to expand at 13.35% CAGR to 2031 as operators digitize fare collection. Netherlands’ nationwide EMV open-loop rollout, OVpay, validated passenger readiness by securing 15.2% share of transit transactions in the first six months of 2024. Europe POS terminal market size in this vertical is forecast to nearly triple by 2031 as metro, rail, and ferry systems converge on account-based ticketing.
Retailers grappled with shrinking margins amid e-commerce competition, driving them to demand integrated loyalty, mixed-basket analytics, and BNPL support from terminals. Logistics hubs adopted ruggedized Android POS for proof-of-delivery and real-time invoicing, compressing accounts-receivable cycles by two days. Healthcare followed, deploying PCI P2PE-certified pinpads that interface with patient record systems to speed insurance co-payment processing.
Geography Analysis
Western Europe POS Terminal Market
Western Europe led deployment density, anchored by Germany, France, and the Netherlands, where PSD2 rules and mature acquirer networks accelerated hardware refresh. Germany’s tier-2 city smart-mall projects installed fixed lanes with centralized loyalty and energy-management integration in late 2024, boosting demand for enterprise-grade devices. France’s Banque de France incentives for small merchants adopting contactless hardware in 2024 broadened acceptance in rural communes.
Central and Eastern Europe POS Terminal Market
Central and Eastern Europe exhibited faster shipment growth from a lower base. Italy’s regulation mandating POS-fiscal register integration from January 2026 ensured a significant uptick in compliant terminals, with pilot programs in Lombardy driving 18% quarter-on-quarter growth in Q2 2025. Poland’s cashless program reimbursed up to PLN 1,000 (USD 250) of terminal cost in 2024, catalyzing micro-merchant uptake.
Nordics, United Kingdom and Iberia POS Terminal Market
Nordic markets sustained virtually cashless ecosystems, leading SoftPOS penetration. Sweden trialed biometric fingerprints on Android devices in early 2025, trimming fraud rates by 0.03 percentage points. The United Kingdom, buoyed by fintech innovation, blended SoftPOS and legacy chip-and-PIN, while tourism-heavy Spain and Portugal reinstated 2019 visitor volumes, reviving hospitality terminal installations. Collectively, heterogeneity in regulatory cadence ensures that the Europe POS terminal market remains a multi-speed arena where vendor localization capability dictates share gains.
Regulatory Landscape
European POS deployments are shaped by payments-security and interoperability requirements, including PCI standards (for example, PCI DSS and PCI MPoC in 2025) alongside country-level fiscalisation mandates that drive periodic device refresh. A major 2026 regulatory anchor for terminal roadmaps is the Eurosystem digital euro workstream. In April 2026, the European Central Bank signed agreements with the European Cards Payments Association (ECPC), nexo standards, and the Berlin Group to reuse existing European technical standards for digital euro POS and online payments, and the digital euro specifications explicitly recognize both hardware-based terminals and software-based acceptance (SoftPOS) on commercial off-the-shelf devices.
Alongside this, the EU Payment Services Package (PSD3/PSR) remains in legislative negotiation during mid-2026, but drafts point to strengthened interoperability principles for payment initiation and acceptance. These include clearer access rights for payment and technical service providers to mobile device features needed to execute payment transactions. Taken together with Italy's mandatory POS-fiscal register integration from January 2026 (cited as a driver of in-country compliance cycles), the policy direction favors certified, updateable platforms, often Android-based, that can absorb scheme, security, and fiscal rule changes without full estate replacement at each update point.
Value Chain Analysis
The Europe POS terminal value chain spans component suppliers and OEM/ODM manufacturing, device OS and middleware stacks, security and certification bodies, acquirers/payment service providers, and merchant-facing distribution, installation, and field service. Hardware production and assembly is supported by Europe-active manufacturers and solution providers such as AURES Group, ANKER Group, and Partner Tech Europe. On the software side, terminal stacks increasingly include device management, remote updates, and analytics, typically monetized through payment service providers and ISV channels.
Interoperability and scheme alignment are coordinated through pan-European bodies that shape functional and message-level specifications used by acquirers and terminal providers. The European Payments Council (EPC) manages SEPA schemes, and the European Payments Stakeholders Group (EPSG) operates as a standardisation forum. EPSG closed the public consultation for the revised SEPA Payments Standardisation Volume (version 10.5) on 10 March 2026. This structure leaves a compliance-heavy downstream segment (certification, key management, and security audits) and supports services revenue tied to deployment and lifecycle management, particularly where national fiscalisation rules and payment-security requirements diverge across countries.
Competitive Landscape
Competition remained moderately concentrated: the top five vendors accounted for 52% of 2024 shipments. Worldline’s merchant services revenue reached EUR 1,658 million (USD 1,953 Million) in H1 2024, illustrating the scale required to bundle acquiring, hardware, and analytics. Shift4’s acquisition of Vectron Systems AG in 2024 brought 65,000 food-service terminals onto its omnichannel cloud, signaling a trend toward geographic bolt-ons.
Verifone secured USD 235 million in preferred equity in April 2025, channeling funds toward biometric pinpad R&D and SMB vertical SaaS, which is expected to lift its cloud attachment rate from 22% to 35% by 2027. PAX Global diversified revenue by adding PagoBANCOMAT and SIBS certifications, enabling pan-regional hardware supply without bespoke SKUs.
Emerging challengers exploited SoftPOS to bypass traditional certification overhead; yet, stringent PCI MPoC guidelines effective 2025 imposed security compliance that favored incumbents with established audit processes. Hardware makers therefore repositioned as platform orchestrators, bundling device management, remote key injection, and micro-lending to capture lifetime value rather than one-time margin.
Europe POS Terminal Industry Leaders
Ingenico S.A.
Worldline S.A.
Verifone Systems, Inc.
PAX Technology Limited
NCR Corporation
- *Disclaimer: Major Players sorted in no particular order

Europe POS Terminal Market Companies Covered in this Report
- Ingenico S.A.
- Worldline S.A.
- Verifone Systems, Inc.
- PAX Technology Limited
- NCR Corporation
- Diebold Nixdorf Incorporated
- Toshiba Corporation
- HP Inc.
- Castles Technology Co., Ltd.
- Adyen N.V.
- Stripe, Inc.
- SumUp Payments Limited
- Block, Inc. (Square)
- Fiserv, Inc. (Clover Network, LLC)
- Elavon, Inc.
- EVO Payments, Inc.
- Nexi S.p.A.
- myPOS Europe Ltd.
- Yavin SAS
- PayPal Holdings, Inc. (Zettle)

Market Opportunities and Future Outlook
One near-term opportunity is multi-rail, standards-aligned acceptance that reduces cross-border complexity for merchants operating across multiple European markets. In April 2026, the ECB signed agreements with ECPC, nexo standards, and the Berlin Group to reuse open technical standards (including CPACE for NFC interactions and nexo for connectivity) in the digital euro acceptance context. Vendors that already ship updateable, multi-interface terminals and SoftPOS stacks can use these platforms to add incremental compliance layers rather than build country- or scheme-specific solutions.
A second whitespace area is the convergence of instant payments, identity, and fraud controls into the checkout experience, which shifts spending toward software and cloud attachments on the installed base rather than only new hardware unit sales. The EPC reported broad deployment momentum for Verification of Payee (VOP) by December 2025, and the EPC continued its rulebook change cycle with public consultation on 2026 Change Requests concluding on June 11, 2026. For POS vendors and PSPs, these scheme updates create packaging opportunities around real-time account-to-account payments acceptance, payer confirmation flows, and unified merchant reporting, especially for verticals already working through infrastructure upgrades such as transportation digitization and Italy's January 2026 fiscal integration requirement.
Recent Industry Developments in Europe POS Terminal Market
- July 2026: Worldline completed a live agent-driven payment transaction in Germany with Visa, following its participation in Visa's Agentic Ready Programme. The work advances production-ready workflows for payments initiated by merchant AI agents, raising requirements for terminal and gateway software to handle authentication, consent, and exception management across European deployments.
- June 2026: Worldline executed what it described as Europe's first end-to-end agentic payment transaction in production between an ING cardholder and a merchant in the Netherlands using the Mastercard network. Demonstrating a production transaction, not only a lab test, increases emphasis on POS and acquiring platforms that can support new interaction models while maintaining scheme compliance and security controls.
- March 2026: Ingenico and Visa announced a collaboration to combine AXIUM Android-based smart POS terminals with the Visa Acceptance Platform to accelerate unified commerce deployments. The partnership tightens integration between terminal hardware, cloud device management, and acceptance routing, supporting faster rollouts of multi-tender features such as wallets and BNPL across merchant estates.


Europe POS Terminal Market Report Scope and Research Methodology
Market Definition and Coverage
This market covers POS payment terminals used for in-person acceptance across Europe, counted as devices shipped or deployed in a given year and expressed in million units. POS terminals are treated as merchant-facing payment acceptance hardware used at checkout or on-the-go.
Scope exclusions: We exclude pure e-commerce payment gateways and other online-only checkout software that does not require a card-present terminal device.
Segments Covered in This Report
- By Mode of Payment Acceptance
- Contact-based
- Contactless
- By POS Type
- Fixed Point-of-Sale Systems
- Mobile / Portable Point-of-Sale Systems
- By End-User Industry
- Retail
- Hospitality
- Healthcare
- Transportation and Logistics
- Other End-user Industries
- By Country
- Germany
- United Kingdom
- France
- Italy
- Spain
- Rest of Europe
Data Sources, Market Sizing, and Validation
Desk Research
Desk work started with public payment and card-present acceptance indicators, because they help bound how many terminals can realistically be needed across Europe. Sources reviewed included official statistics and central bank payment reports such as the European Central Bank, national central banks, and Eurostat, along with merchant acceptance updates from schemes and associations such as the European Payments Council.
We also used company annual reports, investor presentations, and reputable press coverage to track product launches, distribution models, and replacement cycles for contactless and Android-based devices. For trade flows and device availability checks, we referenced import and export statistics and customs releases where useful, and a paid subscription covering company financials and intelligence helped normalize fragmented disclosures into comparable inputs. The sources listed here are illustrative rather than exhaustive, since many other public documents were also used to collect, cross-check, and clarify assumptions.
Primary Interviews and Surveys
Primary work focused on validating terminal demand drivers that desk sources cannot fully explain, especially refresh timing, merchant mix shifts, and SoftPOS substitution risk. We spoke with participants across the Europe ecosystem, including terminal suppliers, payment service providers, acquirers, and merchant-side operations leaders, and then used these inputs to confirm adoption patterns across large and small merchants in major European countries.
Distribution of primary research fieldwork respondents
| Company type | Respondent position |
|---|---|
| Top tier: 26% | CXOs: 14% |
| Mid tier: 56% | Functional/Unit leaders: 36% |
| Smaller Players: 18% | Managers: 50% |
Market-Sizing & Forecasting
Sizing was built using a top-down and bottom-up approach, starting from Europe-level payment acceptance signals and then narrowing to the terminal device pool that supports card-present transactions. For the top-down side, we reconstructed annual terminal needs using merchant location counts, penetration of card acceptance, and typical terminals-per-location ratios, then adjusted for replacement cycles tied to contactless upgrades and security or certification refresh.
To keep totals realistic, we corroborated results with selective bottom-up approximations such as sampled supplier and acquirer roll-ups, channel checks on shipments, and unit ASP patterns only to sanity-check direction, not to force a full vendor sum. Inputs that mattered most included contactless transaction share, upgrade timelines set by schemes or regulators, growth in micro-merchant acceptance, the split between fixed versus mobile devices, and observed replacement intervals by merchant type. Forecasts were developed using scenario analysis, where adoption rates and refresh timing were varied within ranges agreed during interviews, then rolled into country totals and summed back to the Europe number. Where direct unit disclosures were missing, gaps were handled by applying country-level merchant counts and acceptance penetration to derive implied terminal requirements, then reconciling those with interview-led shipment expectations.
Data Validation & Update Cycle
Validation was done through several passes, because early model runs can drift if a single country assumption is too aggressive. We checked outputs against independent signals such as changes in card-present transaction volumes, merchant acceptance expansion, and device refresh announcements, and reviewed anomalies again before internal sign-off.
If a variance looked structural, such as an unusually high implied terminals-per-merchant ratio, we re-contacted sources to confirm whether it was driven by multi-lane retail, hospitality mobility needs, or outdated replacement assumptions. Reports are refreshed annually, and interim updates are made when material events occur that can shift device cycles or merchant acceptance trends. Before delivery, a final review pass is completed so clients receive the latest updated view.
Mordor Intelligence's Europe Pos Terminal Market Size Compared With Other Published Estimates
Published market sizes for Europe POS terminals can vary even when everyone is talking about the same device category, because the counted unit can change and the line between terminals, software-only acceptance, and payment infrastructure is not always handled consistently. Differences also show up when some publishers prioritize shipment flow, others prioritize installed base, and the refresh cadence used for upgrades is not aligned.
Acceptance growth signals from central bank payment statistics and country-level merchant footprint checks are what keep Mordor Intelligence tied to an annual units count that nets out inactive devices and applies replacement timing consistently across major European countries.
Benchmark comparison
| Source | Market Size | Gaps in Research Methodology |
|---|---|---|
| Mordor Intelligence | USD 23.62 M (2025) | |
| Industry Association A | USD 29.10 M (2025) | Often closer to an installed base style count, where multi-terminal merchants and older devices remain included, and replacement timing is not netted out year by year. |
| Trade Journal B | USD 20.40 M (2025) | May lean on shipment-only reporting from a limited set of channels, which can undercount countries with heavier acquirer bundling and can miss gray-to-formal upgrades in micro-merchant acceptance. |
The spread in figures is mainly explained by whether the number represents shipments, active deployments, or a broader device base that includes older terminals, and by how refresh cycles are timed across countries. When the counting rules are mapped back to merchant locations, acceptance penetration, and upgrade cycles, the resulting total is easier to replicate and audit.


Key Questions Answered in the Report
How large was the Europe POS terminal market in 2026?
It was valued at USD 26.58 million units in 2026.
What CAGR is forecast for Europe POS terminal shipments between 2026 and 2031?
Shipments are projected to grow at a 12.55% CAGR over the period.
Which POS type is recording the fastest growth?
Mobile and portable devices are advancing at a 13.05% CAGR through 2031.
Which end-user vertical shows the strongest upside?
Transportation and logistics is forecast to expand at a 13.35% CAGR, outpacing other sectors.
What regulatory shift will shape Italian demand after 2026?
Mandatory POS-fiscal register integration beginning January 2026 will trigger hardware refresh cycles.
Which vendors lead the competitive field?
Worldline, Ingenico, and Verifone together accounted for 38% of 2024 shipments.
Page last updated on:


 Your data is secure and never sold or shared.


