Market Overview
| Study Period | 2020 - 2031 |
|---|---|
| Forecast Data Period | 2026 - 2031 |
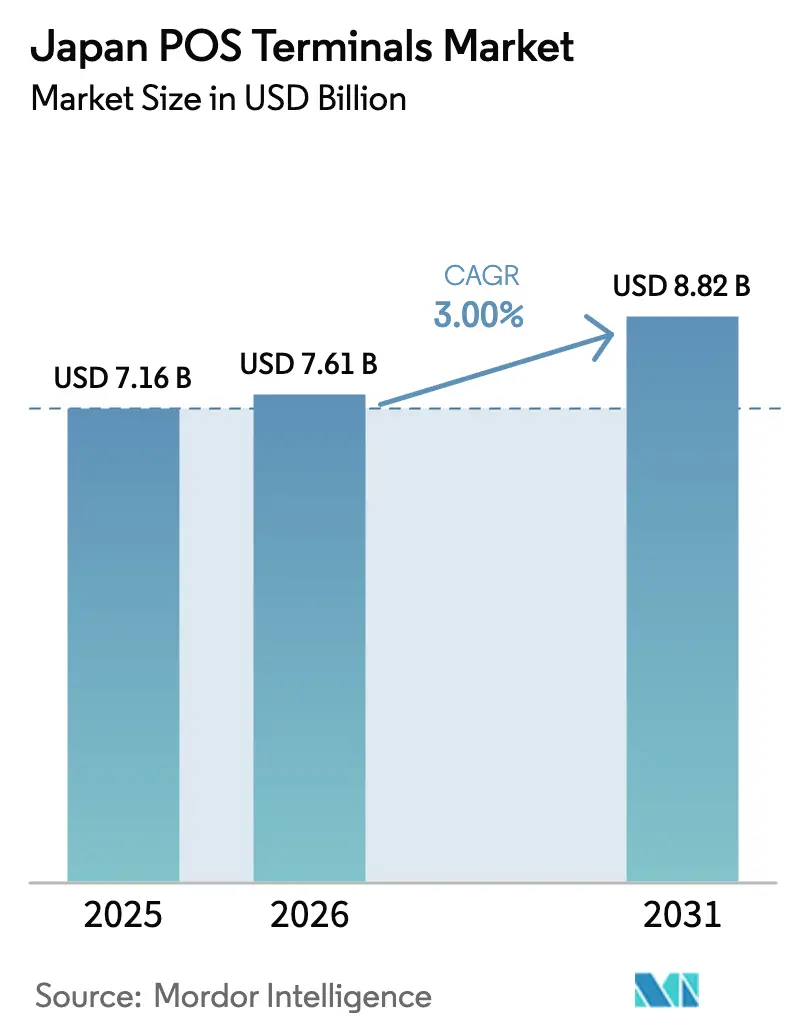
| Base Year Market Size (2025) | USD 7.16 Billion |
| Market Size (2026) | USD 7.61 Billion |
| Market Size (2031) | USD 8.82 Billion |
| Growth Rate (2026 - 2031) | 3.00% CAGR |
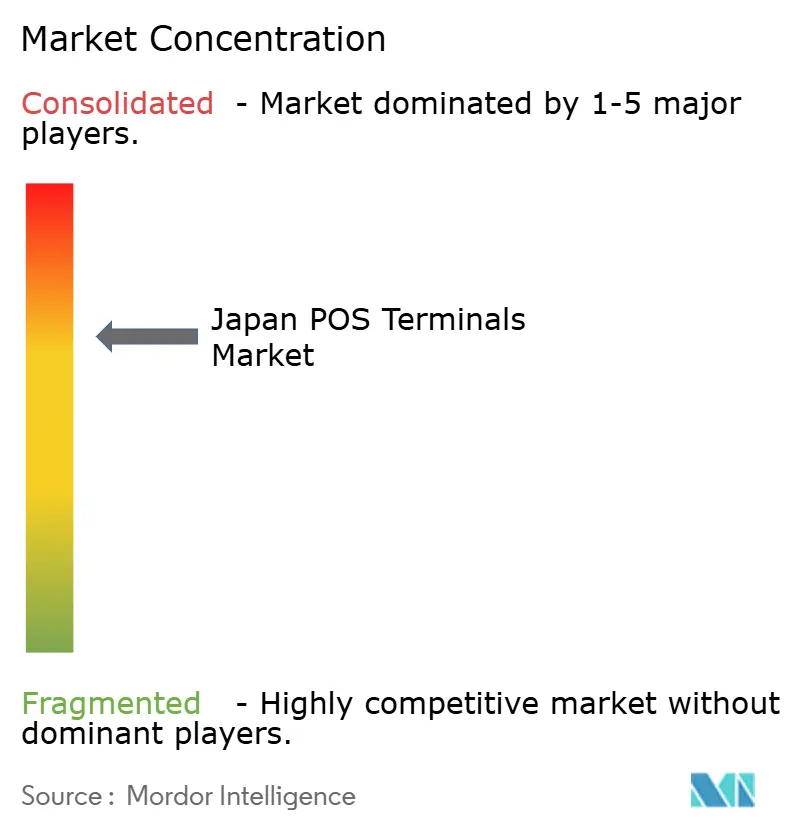
| Market Concentration | Medium |
Major Players *Disclaimer: Major Players sorted in no particular order Image © Mordor Intelligence. Reuse requires attribution under CC BY 4.0. | |
Japan POS Terminals Market Analysis by Mordor Intelligence
The Japan POS Terminals Market size was valued at USD 7.16 billion in 2025 and is estimated to grow from USD 7.61 billion in 2026 to reach USD 8.82 billion by 2031, at a CAGR of 3% during the forecast period (2026-2031). Heightened government backing for a 40% cashless ratio, rising contactless preference in travel and quick-service retail, and vendor commitments to AI-driven edge analytics combine to keep the growth curve intact. Rapid My-Number card integration widens the user base and deepens functional requirements, prompting merchants to favor terminals that merge identity verification with payment acceptance. Semiconductor supply stabilization since late-2024 shortens delivery lead times, allowing retailers to accelerate upgrade projects that had stalled during the prolonged chip crunch.[1]JEITA, “Semiconductor Market Outlook and Supply Chain Recovery,” jeita.or.jp Advancing 5G coverage further boosts mobile POS performance, enabling cloud synchronization and real-time analytics even in previously underserved areas. These intertwined factors cement the upward trajectory of the Japan POS terminals market while offering differentiated entry points for both hardware and software specialists.
Key Report Takeaways
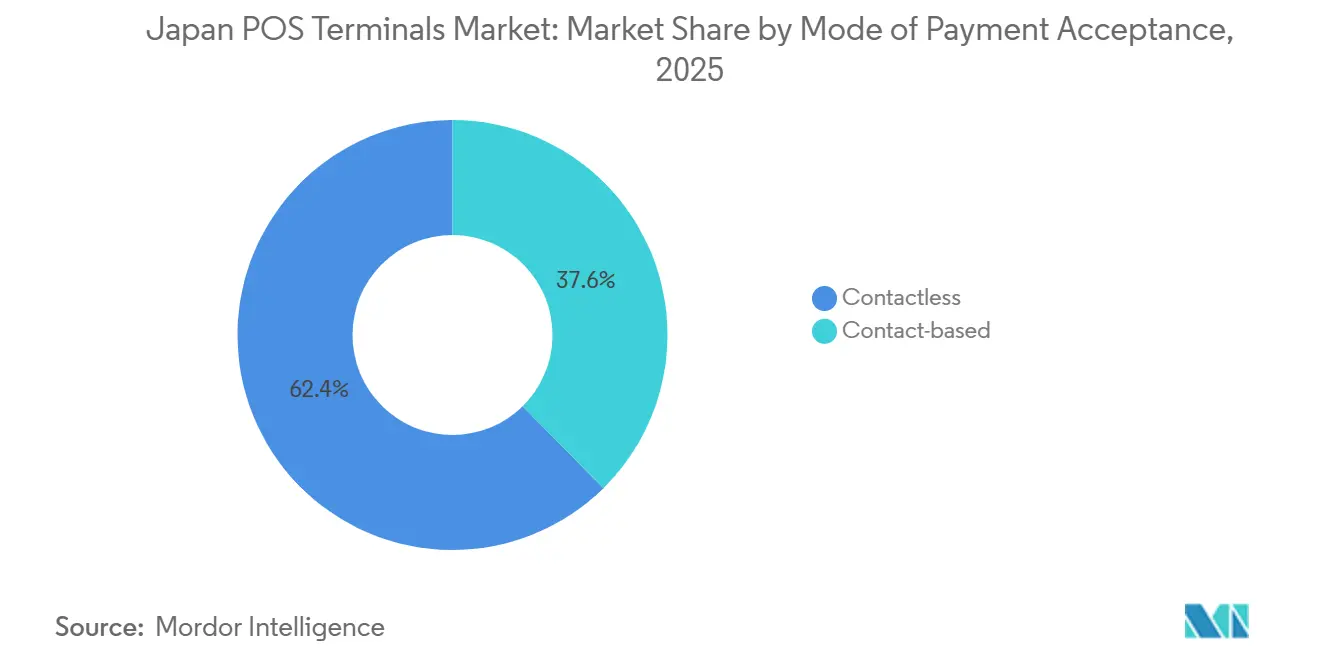
- By mode of payment, contactless solutions held 62.38% of the Japan POS terminals market share in 2025, and are projected to post a 4.70% CAGR through 2031.
- By POS type, fixed point-of-sale systems commanded 71.71% share of the Japan POS terminals market size in 2025, and mobile and portable point-of-sale systems are forecast to expand at a 5.76% CAGR between 2026-2031.
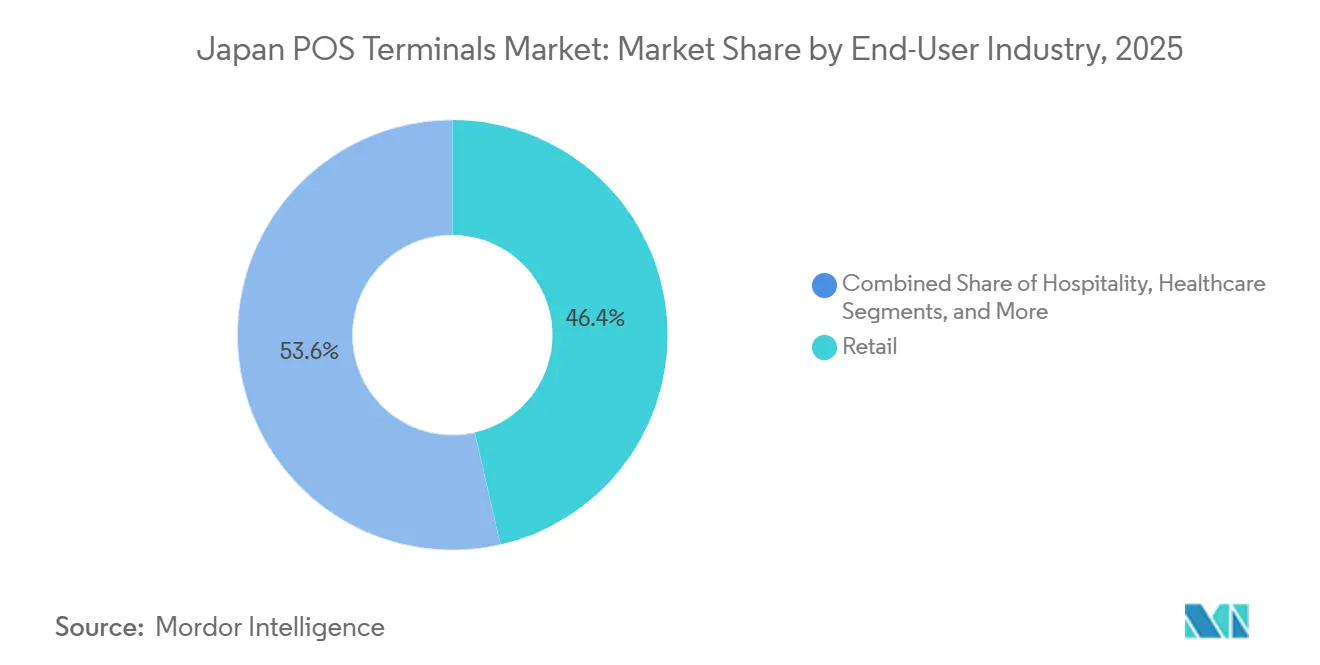
- By end-user, retail accounted for 46.39% of revenue share in 2025 in the Japan POS terminals market, and healthcare is expected to advance at a 4.42% CAGR through 2031.
Note: Market size and forecast figures in this report are generated using Mordor Intelligence’s proprietary estimation framework, updated with the latest available data and insights as of 2026.
Japan POS Terminals Market Trends and Insights
Drivers Impact Analysis*
| Driver | (~) % Impact on CAGR Forecast | Geographic Relevance | Impact Timeline |
|---|---|---|---|
| Boom in mobile POS (m-POS) adoption across SMEs | +2.1% | National, with concentration in urban centers | Medium term (2-4 years) |
| Surge in "My-Number" linked cashless incentive programs | +1.8% | National, with early gains in convenience stores and medical facilities | Short term (≤ 2 years) |
| Growing QR-code interoperability (JPQR) framework | +1.5% | National, with ASEAN cross-border expansion | Medium term (2-4 years) |
| Upgrade cycle driven by PCI PTS v6.0 compliance deadline | +1.3% | National, affecting all card-accepting merchants | Short term (≤ 2 years) |
| Integration of POS with tax-free shopping platforms for inbound tourism | +0.9% | National, with concentration in tourist destinations | Medium term (2-4 years) |
| AI-driven loss-prevention analytics embedded into POS terminals | +0.7% | National, primarily in retail and hospitality sectors | Long term (≥ 4 years) |
| Source: Mordor Intelligence | |||
Boom in Mobile POS Adoption Across SMEs
Mobile POS installations climbed from 99,000 stores in 2015 to 350,000 stores by 2020 and have kept climbing as small and midsize merchants hunt for cost-efficient digital tools. Sumitomo Mitsui Card’s “next stera” roadmap seeks 1 million deployments by 2030, highlighting the scale of latent demand. Japan’s first MPoC-certified SoftPOS, launched through a Soft Space and GMO Financial Gate alliance, turns standard smartphones into secure payment devices.[2]GMO Financial Gate, “Soft Space and GMO-FG Capital Alliance,” gmo-fg.com Merchant appetite is lifted by lower hardware outlays, shorter rollout times, and value-added analytics that fixed terminals struggle to match. Regulatory pressure nudges the same direction because PCI DSS v4.0 encourages cloud orchestration over on-premise software. Together, economics and compliance converge to keep mobile POS at the core of the Japan POS terminals market expansion.
Surge in My-Number Linked Cashless Incentive Programs
The Cabinet Office aims for a 40% cashless ratio by 2025 and channels subsidies toward terminals capable of authenticating My-Number cards. Hospitals receive dedicated support to replace legacy machines so that insurance data, identity checks, and payment flows merge on one screen. Convenience chains mirror the push, retrofitting thousands of lanes to accept card-based identity verification at checkout. Local governments run QR campaigns tailored for seniors, reducing perceived complexity and stimulating terminal upgrades in community pharmacies and local grocers. Functionality now extends to automated tax reporting and loyalty aggregation, placing fresh performance demands on processors, memory, and encryption modules within each device. As a result, the Japan POS terminals market sees a durable boost anchored not in standard consumer spending cycles but in publicly funded modernization.
Growing QR-Code Interoperability (JPQR) Framework
JPQR’s roadmap toward full ASEAN linkage by 2025 obliges Japanese merchants to decode multiple QR formats and settle in varied currencies.[3]Japan Payment Service Association, “JPQR Framework and ASEAN Expansion,” j-psa.or.jp Vending operators, travel hubs, and luxury retailers upgrade firmware to parse domestic schemes alongside Singapore’s NETS or Thailand’s PromptPay. Tax-free shopping reforms scheduled for 2026 also require serial-number capture through POS for customs clearance, layering another compliance element on every scan. Terminal makers respond by embedding faster image sensors and optimizing QR decoding libraries so that scan times mimic tap-and-go convenience. The framework’s reach into transportation and hospitality extends total addressable volume beyond retail, pulling the Japan POS terminals market deeper into experiential commerce that hinges on speedy QR acceptance.
Upgrade Cycle Driven by PCI PTS v6.0 Compliance Deadline
PCI PTS v5.0 approvals sunset in 2029, yet Japan’s large retailers face an April 2026 deadline to shift to v6.0 hardware. Encryption algorithms, tamper-proof casings, and secure key-injection processes all tighten, rendering many pre-2020 terminals obsolete. Toshiba Tec has already booked replacement projects totaling 100,000 units for marquee chains and forecasts another wave once mid-tier merchants lock budgets. Though the mandate inflates near-term capex, it delivers predictable order flow for compliant vendors and raises entry barriers for low-cost imports that lack domestic certification. The Japan POS terminals market therefore enjoys a regulatory tailwind that reinforces technology refresh cycles.
Restraints Impact Analysis*
| Restraint | (~) % Impact on CAGR Forecast | Geographic Relevance | Impact Timeline |
|---|---|---|---|
| Intensifying domestic data-localization regulations | -1.2% | National, affecting cloud-based POS solutions | Medium term (2-4 years) |
| Persistent preference for cash among senior citizens | -0.8% | National, with higher impact in rural areas | Long term (≥ 4 years) |
| Semiconductor supply-chain volatility post-2025 | -0.6% | National, with supply chain dependencies on APAC | Short term (≤ 2 years) |
| Rising total cost of ownership for omni-channel POS | -0.5% | National, primarily affecting large retail chains | Medium term (2-4 years) |
| Source: Mordor Intelligence | |||
Persistent Preference for Cash Among Senior Citizens
Japan recorded a 39.3% national cashless ratio in 2023, yet age-based divergence remains sharp as seniors cling to physical money.[4]NIRA, “Cashless Payment Adoption Survey,” nira.or.jp Surveys show QR uptake running 35% among the 18-29 cohort but lagging by double digits for those above 60. Rural merchants therefore hesitate to invest in advanced terminals when usage could stay low for years. Local authorities test coupon-backed QR campaigns to coax older shoppers, but success varies by prefecture. Vendors compensate by adding tactile keys and large-font screens, driving bill-of-materials costs upward and trimming gross margins. Consequently, while overall growth stays intact, the Japan POS terminals market must negotiate an entrenched cash culture that bleeds momentum outside metropolitan zones.
Intensifying Domestic Data-Localization Regulations
New Financial Services Agency guidance states that payment data must reside on Japanese soil or on servers meeting equivalent security governance. Global cloud providers either build domestic zones or partner with local carriers, adding expense and operational overhead. SoftPOS vendors relying on offshore processing now restructure architectures, delaying product rollouts. Merchants face higher monthly fees for cloud analytics, tempering appetite for advanced software bundles. Enforcement clarity also remains fluid across credit, prepaid, and QR rails, creating legal ambiguity that slows procurement decisions. These frictions shave growth points from the Japan POS terminals market, especially within micro-merchant segments that prize low operating cost.
*Our forecasts treat driver/restraint impacts as directional, not additive. The impact forecasts reflect baseline growth, mix effects, and variable interactions.
Segment Analysis
By Mode of Payment Acceptance: Rapid Contactless Momentum Narrows the Gap
Contactless acceptance held a 62.38% share of the Japan POS terminals market in 2025 and is now compounding at a 4.70% CAGR, permeating vending, transit, and quick-serve venues. Initiatives such as the rollout of contactless readers across 20,000 ME-20 vending machines each year display how firmware upgrades can modernize sprawling installed bases without wholesale replacement. Once early hardware investment is amortized, merchants note throughput gains that translate into higher transaction volumes per store. Consumers report a preference for tap-and-go below USD 40, accelerating habit formation. As EMV tokenization matures, contactless also extends into mid-ticket categories, eating into contact dominance.
On the horizon, QR and contactless may converge as terminals juggle NFC and camera inputs on the same board. Vendors integrate dual readers plus software routing that picks the optimal rail depending on card scheme or wallet used. This multi-modal design lets chains hedge against evolving consumer tastes while controlling capital outlays. Because upgrade projects now aim for 7-year lifecycles, forward-compatible firmware proves a decisive purchasing factor. Such design choices will recalibrate the balance between contact and contactless through 2031, supporting steady re-ordering inside the Japan POS terminals market.


By POS Type: Mobile Flexibility Reshapes Deployment Economics
Fixed Point-of-Sale systems accrued 71.71% of 2025 revenue, reflecting deep roots in department stores and grocery chains that demand high-speed processing and tight ERP integration. Newer form factors are catching up; mobile and portable Point-of-Sale systems will grow 5.76% annually, catalyzed by SoftPOS models where the only hardware is a commodity smartphone. GMO Financial Gate’s stera tap is a flagship example, permitting large acquirers to onboard micro-merchants via an app download rather than a leased device. For service sectors like home repair or outdoor events, this mobility unshackles staff from counters, cuts queue times, and captures incremental sales.
Fixed devices nevertheless evolve. Toshiba Global Commerce Solutions unveiled the TCx 820 with six display sizes and the MxP Vision kiosk that pairs computer vision with AI item recognition. These systems address shrink management and self-checkout trends that remain beyond a phone’s capabilities. Consequently, both categories coexist, with mobile widening merchant reach and fixed units deepening functionality per square foot. The Japan POS terminals market therefore pivots not from one technology to the other but toward a layered stack where mobile and fixed complement one another depending on ticket size, vertical, and store format.
By End-User Industry: Healthcare Surges on Subsidy-Backed Upgrades
Retail captured 46.39% of 2025 revenue as convenience, department, and drug stores refreshed estates to enable omnichannel click-and-collect flows. Yet healthcare is projected to outpace all other verticals at a 4.42% CAGR, driven by subsidies that offset the cost of My-Number-compliant terminals. Clinics and pharmacies rushing to meet 2025 policy deadlines must embed card readers plus secure ID modules that link treatment data to payment records. Vendors offer modular units with barcode, NFC, and fingerprint add-ons, ensuring future-proofing against additional regulatory layers.
Travel and hospitality also rebound as inbound tourism revives to pre-pandemic levels. Duty-free counters require POS systems that integrate with customs e-declaration APIs, and hotels seek multilingual menus to handle rising flows of ASEAN and European visitors. Transportation hubs integrate retail SKUs into transit payment ecosystems, extending the revenue surface area for each terminal. Education and government offices form a long tail of emerging adopters as citizen-service portals add fee collection through POS endpoints. These widening use cases consolidate demand curves that will keep the Japan POS terminals industry expanding even after retail replacement cycles decelerate.

Geography Analysis
Tokyo and Osaka dominate unit installations owing to dense merchant clusters, sustained tourist inflows, and early engagement with 5G and edge AI pilots. Chain operators prefer to pilot new POS stacks here before rolling them nationwide. The success of 7-Eleven’s 500-store edge AI proof in Kanto illustrated how urban data velocity can unlock layered services that hinge on split-second image processing.
Regional cities such as Fukuoka and Sapporo follow behind, spurred by local grants that mirror national cashless targets. Their share of contactless taps is climbing faster than the national average, albeit from a smaller base, demonstrating convergence over the mid-term. Rural prefectures remain cash strongholds given higher senior ratios; thus merchants retain hybrid lanes that reconcile cash drawers with QR and IC card readers. Supply constraints in early-2024 delayed card issuance for rural transit networks, holding back associated POS procurement until chip supplies improved in September 2024.
Looking forward, Shinkansen station renovations and Expo 2025 Osaka are set to inject large terminal orders tied to retail concessions, ticketing, and hospitality suites. Coastal tourism belts aim for frictionless, tax-free checkout by 2026, prompting investment in multilingual and duty-free compliant terminals. Meanwhile, agriculture cooperatives exploring direct-to-consumer e-commerce are testing portable POS for farmers’ markets, illustrating how peripheral sectors enlarge the geographic footprint of the Japan POS terminals market.
Competitive Landscape
Toshiba Tec holds about 50% domestic share, leveraging the ELERA platform, which added 200 companies and 2,300 stores year-over-year. Its breadth in hardware, middleware, and field services entices enterprise retailers that demand single-vendor accountability. NCR, PAX Global, and Samsung populate the next tier, focusing on specialized niches such as hospitality kiosks or Android-based handhelds. Competitive thrust centers on integrating computer-vision analytics, loyalty orchestration, and cloud dashboards that turn transaction streams into operational insights.
SoftPOS entrants disrupt from the bottom. The GMO Financial Gate and Soft Space alliance moved quickly to secure Japan’s first MPoC stamp, unlocking smartphone acceptance for micro-merchants and creating pressure on low-end hardware sales. Local fintechs NetStars and Recruit aim to bundle acquiring and marketing within unified apps, eroding value held by traditional ISO networks. Semiconductor vendors also step forward; Qualcomm’s tie-up with Toshiba Global Commerce Solutions packages AI inference at the edge, promising sub-200-millisecond object detection for self-checkout.
M&A and joint ventures shape the battlefield. NEC divested its hardware unit to Nihon Mirai Capital, indicating a pivot to software overlays rather than chassis manufacture. Toshiba Tec invested in TOUCH TO GO to gain unmanned micro-market capability, extending reach into grab-and-go formats. Conventional device counts thus tell only part of the story; strategic value accrues to firms that knit together terminals, cloud, and AI. As consolidation inches ahead, the Japan POS terminals market looks set for moderate concentration in the medium term.
Japan POS Terminals Industry Leaders
NEC Corporation
NCR Corporation
Uniwell Corporation
PAX Global Technology Limited
Sharp Corporation
- *Disclaimer: Major Players sorted in no particular order

Recent Industry Developments
- January 2025: Toshiba Global Commerce Solutions partnered with Qualcomm Technologies to embed AI edge processing in retail POS lanes.
- December 2024: Mitsubishi UFJ Nicos began equipping 20,000 ME-20 vending machines annually with contactless readers supporting the four major card brands.
- September 2024: NEC completed the sale of its POS hardware business to Nihon Mirai Capital.
- July 2024: NTT East and Ministop piloted cashier-less SMARTORE stores handling 500 SKUs via computer vision checkout.


Japan POS Terminals Market Report Scope
Fixed POS terminals include devices such as PC-based workstations, namely PC-class Processor-based and LAN-available terminals. Also, PC on Cash Drawer Devices (PCOCD) and self-checkout (unattended terminals) are part of the scope. Mobile/Portable devices such as tablets of all sizes and handheld terminals with or without payment processing capabilities are considered.
The Japan POS Terminal Market is segmented by type (fixed point of sale systems, mobile portable point of sale terminals) and by end-user industry (retail, hospitality, healthcare). The report offers market forecasts and size in value (USD) for all the above segments.
By Mode of Payment Acceptance
| Contact-based |
| Contactless |
By POS Type
| Fixed Point-of-Sale Systems |
| Mobile / Portable Point-of-Sale Systems |
By End-User Industry
| Retail |
| Hospitality |
| Healthcare |
| Transportation and Logistics |
| Other End-user Industries |
| By Mode of Payment Acceptance | Contact-based |
| Contactless | |
| By POS Type | Fixed Point-of-Sale Systems |
| Mobile / Portable Point-of-Sale Systems | |
| By End-User Industry | Retail |
| Hospitality | |
| Healthcare | |
| Transportation and Logistics | |
| Other End-user Industries |


Key Questions Answered in the Report
How large is the Japan POS terminals market today?
The Japan POS terminals market size was 7.61 billion USD in 2026 and is on track to hit 8.82 billion USD by 2031.
What CAGR is expected for POS terminals in Japan through 2031?
Revenue is projected to grow at a robust 3.00% CAGR during 2026-2031.
Which payment mode is growing fastest in Japanese stores?
Contactless transactions are expanding at a 4.70% CAGR thanks to vending, transit, and quick-service rollouts.
Why is healthcare a high-growth vertical for POS suppliers in Japan?
Government subsidies for My-Number card integration push clinics and pharmacies to upgrade, driving a 4.42% CAGR in healthcare deployments.
How is regulation shaping terminal replacement cycles?
The PCI PTS v6.0 deadline forces merchants to replace non-compliant devices by 2026, triggering a pronounced upgrade wave.
Page last updated on:


