Power Semiconductor Market Size and Share
Market Overview
| Study Period | 2020 - 2031 |
|---|---|
| Market Size (2026) | USD 59.98 Billion |
| Market Size (2031) | USD 78.25 Billion |
| Growth Rate (2026 - 2031) | 5.46% CAGR |
| Fastest Growing Market | Asia Pacific |
| Largest Market | Asia Pacific |
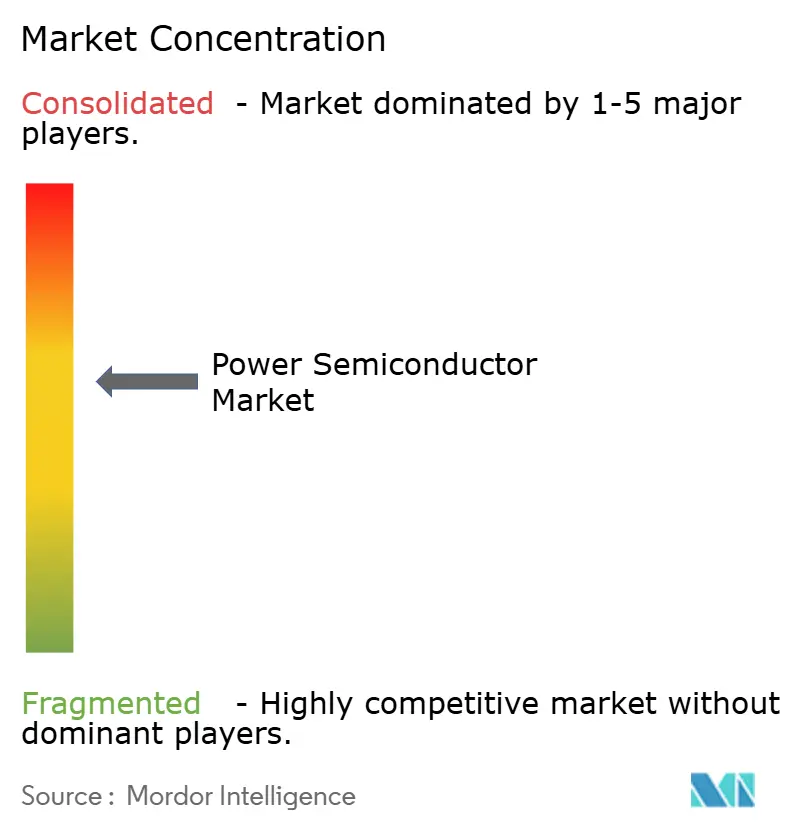
| Market Concentration | Medium |
Major Players*Disclaimer: Major Players sorted in no particular order Image © Mordor Intelligence. Reuse requires attribution under CC BY 4.0. |
|
Power Semiconductor Market Analysis by Mordor Intelligence
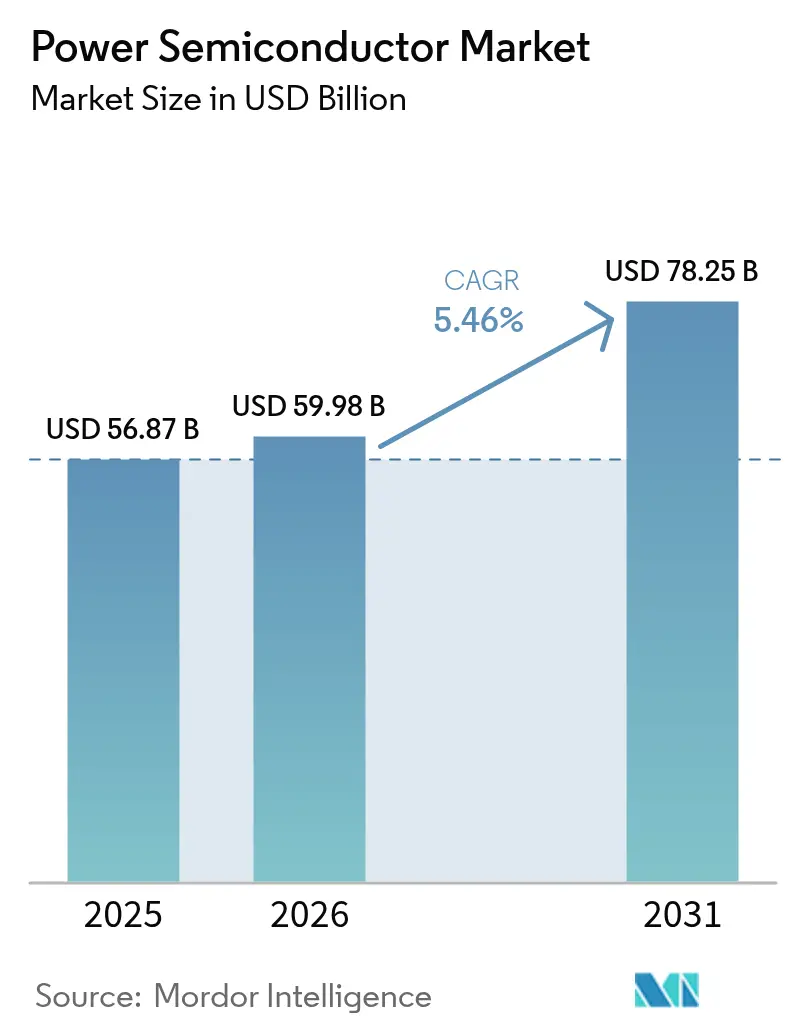
The power semiconductor market size was valued at USD 56.87 billion in 2025 and estimated to grow from USD 59.98 billion in 2026 to reach USD 78.25 billion by 2031, at a CAGR of 5.46% during the forecast period (2026-2031). Strong demand for efficient power conversion across electric vehicles, renewable energy systems, and data-intensive electronics keeps the power semiconductor market resilient even as cyclical slowdowns emerge elsewhere. Wide-bandgap (WBG) materials-chiefly silicon carbide (SiC) and gallium nitride (GaN)-command premium pricing because they outperform silicon in high-voltage and high-frequency conditions. Automotive electrification anchors volume, yet rapid growth stems from solar-plus-storage installations, 5G infrastructure rollouts, and factory automation upgrades. Regional supply-chain policies such as the U.S. CHIPS Act and the European Chips Act intensify domestic fabrication investments, while the Asia Pacific leverages its end-to-end manufacturing scale to maintain leadership.
Key Report Takeaways
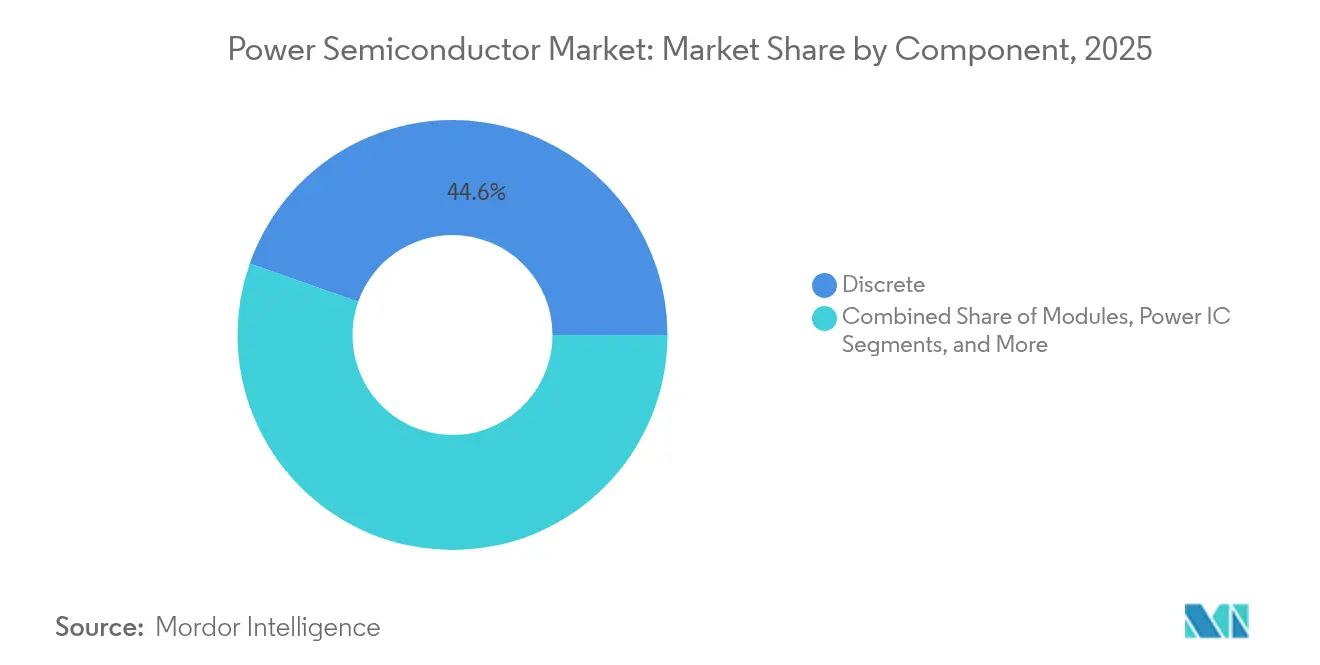
- By component, discrete devices held 44.60% of the power semiconductor market share in 2025, while power ICs are forecast to post a 6.02% CAGR through 2031.
- By material, silicon commanded 77.55% share of the power semiconductor market size in 2025, whereas GaN is projected to expand at a 9.03% CAGR to 2031.
- By end-user, automotive retained 31.02% of the power semiconductor market share in 2025, and the energy and power segment is set to register a 7.21% CAGR through 2031.
- By geography, the Asia Pacific accounted for 51.35% revenue share in 2025 and is advancing at a 6.74% CAGR to 2031.
Note: Market size and forecast figures in this report are generated using Mordor Intelligence’s proprietary estimation framework, updated with the latest available data and insights as of 2026.
Global Power Semiconductor Market Trends and Insights
Drivers Impact Analysis*
| Driver | (~) % Impact on CAGR Forecast | Geographic Relevance | Impact Timeline |
|---|---|---|---|
| Surging demand for EVs and charging infrastructure | +1.8% | Global, with APAC and Europe leading adoption | Medium term (2-4 years) |
| Proliferation of 5G base-stations | +0.9% | Global, with North America and APAC core markets | Short term (≤ 2 years) |
| Renewables-led power conversion growth | +1.2% | Global, with Europe and North America policy-driven | Long term (≥ 4 years) |
| Industrial automation and motor-drive upgrades | +0.8% | APAC core, spill-over to North America and Europe | Medium term (2-4 years) |
| HAPS and all-electric aircraft powertrains | + 0.3% | North America and Europe aerospace hubs | Long term (≥ 4 years) |
| Fast-charging 2-/3-wheeler EV architectures in Asia | +0.6% | APAC, primarily India and Southeast Asia | Short term (≤ 2 years) |
| Source: Mordor Intelligence | |||


Surging Demand for EVs and Charging Infrastructure
Electric vehicles increasingly rely on SiC MOSFETs that raise drivetrain efficiency and shorten charging times.[1]Source: Infineon Technologies AG, "Solutions for Photovoltaic Energy Systems," Infineon.com Automakers shifting to 800 V systems specify SiC to trim inverter losses, evidenced by FORVIAs, such as onsemi’s agreement with Volkswagen, secure vertically integrated chip-to-module deliveries, mitigating allocation risks.[2]Source: Infineon Technologies AG, “FORVIA HELLA Selects Infineon’s New CoolSiC Automotive MOSFET 1200 V,” infineon.com Parallel DC fast-charger roll-outs require 8 kW to 1 MW power blocks, effectively doubling SiC demand from vehicle content alone. Automotive-grade yields stay challenging, so IDMs add captive substrate capacity to stabilize cost curves and safeguard margins.
Proliferation of 5G Base-Stations
GaN high-electron-mobility transistors deliver higher gain and efficiency than LDMOS at sub-6 GHz and mmWave frequencies. Small-cell densification pushes GaN shipments to quadruple by decade-end as operators combat escalating energy bills. NXP couples Si LDMOS with GaN die in multichip massive-MIMO modules that integrate antenna arrays and simplify thermal design. Power semiconductor suppliers add sintered die-attach materials to cope with hot-spot temperatures above 225 °C. The telecom sector’s focus on total-cost-of-ownership converts incremental efficiency gains into reduced opex, cementing GaN adoption in next-phase rollouts.
Renewables-Led Power Conversion Growth
Utility-scale solar and wind projects specify WBG devices to surpass 99% inverter efficiency thresholds. SMA Solar’s 2,000 V inverter platform integrates ROHM 2 kV SiC MOSFETs within Semikron Danfoss modules to maximize energy yield under partial-load conditions [3]Source: ROHM Semiconductor, “Semikron Danfoss Module with ROHM 2 kV SiC MOSFETs,” rohm.com. Grid-interactive storage adds bidirectional converters that favor high-frequency SiC topologies to shrink magnetics. Multilevel architectures lower filtering costs and enable compact skid designs for brownfield retrofits. Policymakers mandating low-harmonic injection provide additional pull for advanced power stages over legacy IGBT stacks.
Industrial Automation and Motor-Drive Upgrades
Smart factories adopt SiC-based drives that cut switching losses and shrink heat-sink volume by up to 70% [4]Source: Microchip Technology, “Silicon Carbide Powers the Next Generation of Industrial Motor Drives,” microchip.com . Higher switching frequencies simplify passive filtering and improve power factor, aligning with sustainability certification targets. Centralized 1,000 V DC-bus architectures distribute power at lower copper weight, boosting energy efficiency. While initial device premiums persist, falling 200 mm wafer costs narrow the differential and accelerate payback periods. Fabs prioritizing AI and automotive may squeeze industrial allocations, so OEMs diversify sourcing through qualified second-source agreements.
Restraints Impact Analysis*
| Restraint | (~) % Impact on CAGR Forecast | Geographic Relevance | Impact Timeline |
|---|---|---|---|
| Silicon wafer supply tightness cycles | -0.7% | Global, with particular impact on Asia Pacific | Short term (≤ 2 years) |
| High cost / design complexity of WBG devices | -0.9% | Global, with cost sensitivity in emerging markets | Medium term (2-4 years) |
| Thermal limits in high-density EV inverters | -0.4% | Global, concentrated in automotive applications | Medium term (2-4 years) |
| Export controls on GaN epitaxy tools | -0.5% | China and allied countries affected differently | Long term (≥ 4 years) |
| Source: Mordor Intelligence | |||
Silicon Wafer Supply Tightness Cycles
Total wafer demand now eclipses qualified capacity, and inventory drawdown at memory suppliers distorts short-term purchasing behavior [5]Source: SEMI, “2025 Silicon Wafer Market: At the Threshold Between Cyclical Limits and Structural Change,” semi.org. Geopolitical friction inflates fab-construction costs, while water-usage limits restrict greenfield sites in drought-prone zones. Chinese entrants pursue price competition that compresses margins across the chain. Although front-end equipment bookings hint at recovery, end-market weakness in PCs and smartphones tempers volume pick-up, exposing structural rather than cyclical imbalances.
High Cost / Design Complexity of WBG Devices
SiC substrates incur higher defect densities, raising die-sorting losses and final part pricing. GaN lateral devices require bespoke gate-drive and layout practices unfamiliar to many OEM engineers. Design-for-manufacture guidelines evolve rapidly, increasing validation overheads. As 200 mm SiC ramps and GaN on silicon epitaxy mature, cost curves bend downward, yet sticker-shock persists among cost-sensitive consumer and motor-control segments.
*Our forecasts treat driver/restraint impacts as directional, not additive. The impact forecasts reflect baseline growth, mix effects, and variable interactions.
Segment Analysis
By Component: Integration Upside for Power ICs
Power integrated circuits contributed significantly to the power semiconductor market size in 2025 and will climb at a 6.02% CAGR through 2031. Automotive battery-management units require multi-rail regulators and functional-safety diagnostics delivered in a compact PMIC footprint. Infineon’s ISO 26262-compliant OPTIREG TLF35585 underpins safety-related electronic control units, illustrating the trend toward single-chip power management . Discrete devices remain indispensable for high-current paths, preserving 44.60% revenue share; nevertheless, the discrete share edges lower as designers favor cost-optimized module or IC solutions in space-constrained subsystems.
Supplier roadmaps bundle GaN or SiC dies within intelligent power modules that integrate gate drive, sensing, and protection, shortening time-to-market for inverter and charger assemblies. Module consolidation benefits mid-volume industrial and residential energy customers who lack in-house packaging expertise. Conversely, consumer-electronics ODMs still procure discrete MOSFETs for adapter designs to exploit board-level flexibility and price advantages. The coexistence of discrete, module, and IC formats enriches the power semiconductor market, enabling tailored performance-cost trade-offs.


By Material: GaN Scales While Silicon Retains Core Volume
Silicon fueled 77.55% of revenue in 2025, anchoring the power semiconductor market share despite physical limits. Continuous superjunction MOSFET advances and mature supply networks keep silicon relevant for 650 V and below. GaN, though smaller today, records the fastest rise at a 9.03% CAGR, winning sockets in mobile fast chargers, 5G base stations, and residential solar micro-inverters. Infineon forecasts a decisive adoption inflection by 2025 as reference designs standardize gate-drive and EMI mitigation.
SiC owns high-power traction and grid sectors, where its 1,200 V and 1,700 V ratings exceed GaN's economic reach. The transition to 200 mm SiC wafers compresses cost per ampere, narrowing the gap versus superjunction silicon. Material diversification lowers concentrated supply risk and unlocks design optionality. Over the forecast horizon, designers will assign silicon to cost-driven mass-market applications, SiC to high-power transport and renewables, and GaN to high-frequency, lower-power uses, creating a balanced multi-material ecosystem.

By End-User Industry: Energy and Power Outpaces Automotive Growth
Automotive captured 31.02% of 2025 revenue thanks to battery-electric traction inverters, on-board chargers, and DC-DC converters. Yet the energy and power vertical leads expansion at a 7.21% CAGR through 2031 as utilities deploy SiC-based string and central inverters exceeding 1,500 V. Grid-storage rollouts add multi-megawatt bidirectional converters that further swell device demand. Industrial automation follows close behind, leveraging SiC drives for high-efficiency process lines and robot actuators. Consumer electronics remains the largest unit-count outlet but faces stiff ASP pressure, restricting WBG penetration to flagship notebooks and premium adapters. Healthcare, aerospace, and defense form niche high-reliability slices where performance premiums offset volume constraints, preserving high gross-margin opportunities.
Geography Analysis
Asia Pacific accounted for 51.35% of the power semiconductor market share in 2025 and sustained a 6.74% CAGR through 2031. China spearheads SiC and GaN capacity ramps, aided by state subsidies and vertically integrated supply chains. India fast-tracks an INR 7,600 crore OSAT campus targeting 15 million units per day, signaling intent to onshore assembly. Taiwan and South Korea guard leadership in advanced packaging and memory, respectively, while Japan fortifies upstream materials command.
North America benefits from USD 50 billion in CHIPS Act incentives that unlock brownfield conversions and greenfield fabs by Wolfspeed, Bosch, and overseas entrants. Automotive, defense, and data-center clusters concentrate demand, boosting local content requirements. SEMI projects regional fab-equipment outlays doubling to USD 24.7 billion by 2027, underscoring long-term scale-up .
Europe leverages its automotive and renewable energy policy alignment to catalyze SiC and GaN uptake. Germany’s EUR 5 billion Dresden fab approval exemplifies public-private alignment to elevate self-sufficiency. France and Italy offer additional grant packages to preserve leading-edge module and substrate know-how. Emerging markets across the Middle East, Africa, and Latin America stay value-conscious, adopting mature silicon platforms while gradually trialing WBG for utility-scale solar and railway electrification.


Competitive Landscape
Market concentration is moderate yet edging upward. Five suppliers—STMicroelectronics, onsemi, Infineon, Wolfspeed, and ROHM—controlled more than 70% of SiC device revenue in 2024 [8]Source: Evertiq, “Five Companies Control the SiC Power Market,” evertiq.com. Vertical integration from substrate to module mitigates supply disruptions and yields cost leverage. Platform-oriented portfolios replace single-socket offerings, allowing reuse across traction, solar, and industrial drives and lowering non-recurring engineering expense.
Capacity race dynamics dominate strategy. Wolfspeed secured USD 750 million in CHIPS Act grants plus matching private capital to expand Mohawk Valley 200 mm SiC capacity [9]Source: Wolfspeed, “Wolfspeed Announces $750 M Funding Under U.S. CHIPS Act,” wolfspeed.com . onsemi acquired Qorvo’s SiC JFET assets and selected the Czech Republic for end-to-end SiC production, ensuring European supply resilience. Infineon opened a 200 mm SiC mega-fab in Malaysia, powered entirely by renewable electricity, positioning for cost leadership at scale.
Patent portfolios and equipment access emerge as competitive moats amid tightened export-control regimes. Companies increase joint-development agreements to secure tool roadmaps compliant with evolving regulations. White-space applications—such as humanoid robots requiring high-precision motor drives—attract R&D allocations, extending growth optionality beyond core markets.
Power Semiconductor Industry Leaders
-
Infineon Technologies AG
-
Texas Instruments Inc.
-
STMicroelectronics NV
-
NXP Semiconductors NV
-
Qorvo Inc.
- *Disclaimer: Major Players sorted in no particular order

Recent Industry Developments
- May 2025: Infineon and NVIDIA agreed to co-develop an 800 V direct-current power delivery architecture for AI data centers, targeting rack power above 1 MW.
- May 2025: Infineon unveiled trench-based SiC superjunction devices with 40% lower RDS(on)*A, securing Hyundai as a lead customer for 800 kW traction inverters.
- March 2025: Mazda and ROHM began joint GaN power-device development aimed at commercial release by FY 2027.
- January 2025: onsemi completed its USD 115 million acquisition of Qorvo’s SiC JFET business to enlarge the EliteSiC portfolio.
- January 2025: Wolfspeed announced USD 750 million CHIPS Act funding plus USD 750 million from Apollo-led investors to expand SiC capacity.


Global Power Semiconductor Market Report Scope
A power semiconductor is used as a switch or rectifier in power electronics. It plays a crucial role in controlling and converting electrical power in electronic circuits. The market is defined by the revenue generated from sales of various components of power semiconductors like discrete, module, and power IC, using various materials like silicon/germanium, silicon carbide (SiC), and gallium nitride (GaN). They are employed in a diverse range of global end-user industries like automotive, consumer electronics, IT and telecommunication, military and aerospace, power, industrial, and others.
The power semiconductor market is segmented by component (discrete [rectifier, bipolar, MOSFET, IGBT, and other discrete components], modules [thyristor, IGBT, and MOSFET], power IC [multichannel PMICs, switching regulators (AC/DC, DC/DC, isolated and non-isolated), linear regulators, BMICs, other components]), material (silicon/ germanium, silicon carbide (SiC), gallium nitride (GaN)), end-user industry (automotive, consumer electronics, IT & telecommunications, military and aerospace, power, industrial, and other end-user industries), and geography (United States, Europe, Japan, China, South Korea, Taiwan, Rest of the World). The market sizes and value (USD) forecasts for all segments are provided.
| Discrete | Rectifier |
| Bipolar | |
| MOSFET | |
| IGBT | |
| Other Discrete Components (Thyristor, HEMT, etc.) | |
| Modules | Thyristor Module |
| IGBT Module | |
| MOSFET Module | |
| Intelligent Power Module (IPM) | |
| Power IC | PMIC (Multichannel) |
| Switching Regulators (AC/DC, DC/DC, Iso/Non-iso) | |
| Linear Regulators | |
| Battery Management IC | |
| Other Power ICs |
| Silicon |
| Silicon Carbide (SiC) |
| Gallium Nitride (GaN) |
| Others |
| Automotive |
| Consumer Electronics and Appliances |
| ICT (IT and Telecom) |
| Industrial and Manufacturing |
| Energy and Power (Renewables, Grid) |
| Aerospace and Defense |
| Healthcare Equipment |
| Others (Rail, Marine) |
| North America | United States |
| Canada | |
| Mexico | |
| Europe | Germany |
| France | |
| United Kingdom | |
| Italy | |
| Rest of Europe | |
| Asia Pacific | China |
| Japan | |
| South Korea | |
| India | |
| Rest of Asia Pacific | |
| South America | Brazil |
| Argentina | |
| Rest of South America | |
| Middle East | Israel |
| Saudi Arabia | |
| United Arab Emirates | |
| Rest of Middle East | |
| Africa | South Africa |
| Egypt | |
| Rest of Africa |
| By Component | Discrete | Rectifier |
| Bipolar | ||
| MOSFET | ||
| IGBT | ||
| Other Discrete Components (Thyristor, HEMT, etc.) | ||
| Modules | Thyristor Module | |
| IGBT Module | ||
| MOSFET Module | ||
| Intelligent Power Module (IPM) | ||
| Power IC | PMIC (Multichannel) | |
| Switching Regulators (AC/DC, DC/DC, Iso/Non-iso) | ||
| Linear Regulators | ||
| Battery Management IC | ||
| Other Power ICs | ||
| By Material | Silicon | |
| Silicon Carbide (SiC) | ||
| Gallium Nitride (GaN) | ||
| Others | ||
| By End-user Industry | Automotive | |
| Consumer Electronics and Appliances | ||
| ICT (IT and Telecom) | ||
| Industrial and Manufacturing | ||
| Energy and Power (Renewables, Grid) | ||
| Aerospace and Defense | ||
| Healthcare Equipment | ||
| Others (Rail, Marine) | ||
| By Geography | North America | United States |
| Canada | ||
| Mexico | ||
| Europe | Germany | |
| France | ||
| United Kingdom | ||
| Italy | ||
| Rest of Europe | ||
| Asia Pacific | China | |
| Japan | ||
| South Korea | ||
| India | ||
| Rest of Asia Pacific | ||
| South America | Brazil | |
| Argentina | ||
| Rest of South America | ||
| Middle East | Israel | |
| Saudi Arabia | ||
| United Arab Emirates | ||
| Rest of Middle East | ||
| Africa | South Africa | |
| Egypt | ||
| Rest of Africa | ||


Key Questions Answered in the Report
How large is the power semiconductor market in 2026 and where is it headed?
The power semiconductor market size is USD 59.98 billion in 2026 and is projected to reach USD 78.25 billion by 2031, reflecting a 5.46% CAGR.
Which sector will add the most incremental revenue over the next five years?
Energy & power applications, led by solar-plus-storage deployments, are expected to log a 7.21% CAGR through 2031, outpacing all other end-user segments.
Why are SiC and GaN gaining momentum over silicon?
SiC and GaN switch faster, handle higher voltages, and dissipate less heat, enabling lighter inverters, faster chargers, and higher-frequency telecom equipment.
Which region dominates power semiconductor production today?
Asia Pacific holds 51.35% of 2025 revenue and maintains the most complete supply chain from substrate to assembly.
How will the CHIPS Act influence North American capacity?
Federal incentives totaling more than USD 50 billion underpin new fabs by Wolfspeed, Bosch, and others, with regional equipment outlays forecast to double by 2027.
Page last updated on:


