Cement Additives Market Size and Share
Market Overview
| Study Period | 2019 - 2030 |
|---|---|
| Market Size (2025) | USD 18.78 Billion |
| Market Size (2030) | USD 26.03 Billion |
| Growth Rate (2025 - 2030) | 6.75% CAGR |
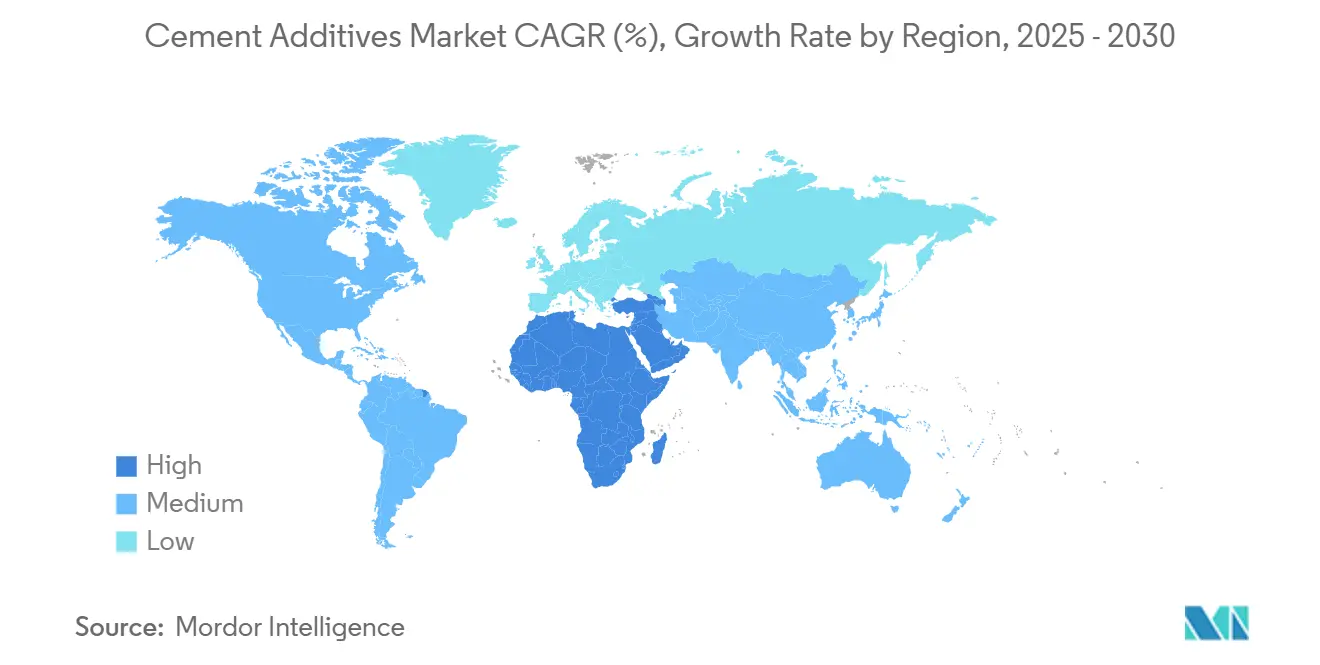
| Fastest Growing Market | Middle East and Africa |
| Largest Market | Asia Pacific |
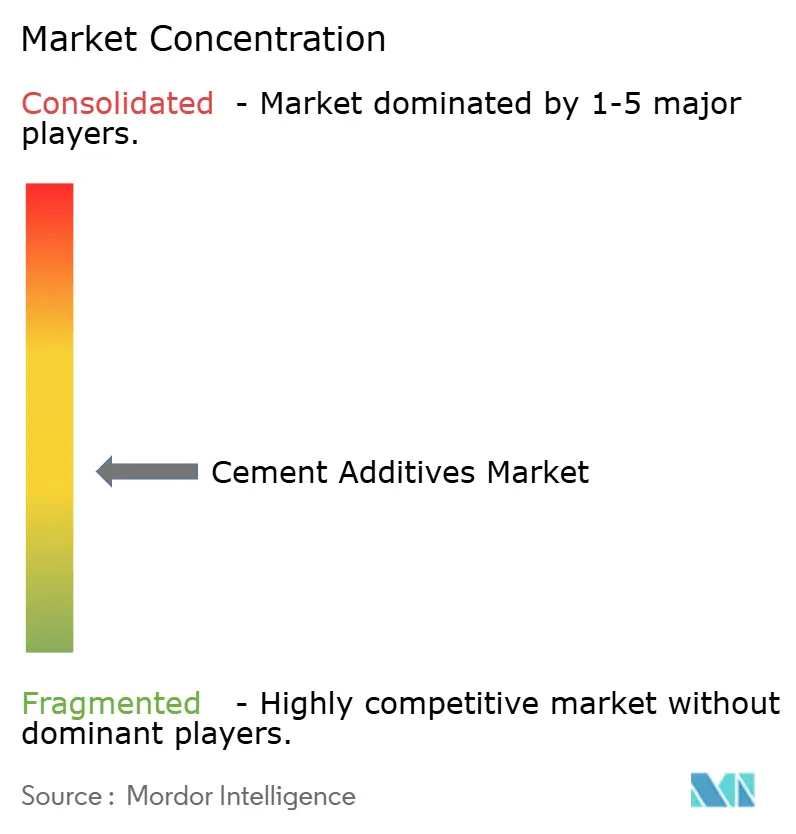
| Market Concentration | Medium |
Major Players *Disclaimer: Major Players sorted in no particular order Image © Mordor Intelligence. Reuse requires attribution under CC BY 4.0. | |

Cement Additives Market Analysis by Mordor Intelligence
The Cement Additives Market size is estimated at USD 18.78 billion in 2025, and is expected to reach USD 26.03 billion by 2030, at a CAGR of 6.75% during the forecast period (2025-2030). Rising urban populations, tightening decarbonization mandates, and specialized end-uses, such as 3D concrete printing, collectively underpin this expansion trajectory. New infrastructure spending packages in high-growth economies, alongside the demand for mega projects that require high-performance concrete, increase volume requirements while shifting value toward premium, multi-functional formulations. Leading manufacturers respond by investing in nanoclay-enhanced chemistries, CO₂ Injection systems, and digital concrete platforms that optimize mix designs in real-time. Regulatory pressure for blended cements accelerates the uptake of mineral additives, especially where limestone, calcined clay, or ground glass pozzolans can reduce embodied carbon by up to 40% without compromising strength. Competitive consolidation continues as larger players acquire regional specialists to widen geographic reach and fill technology gaps.
Key Report Takeaways
- By type, chemical additives held 54.37% of the Cement Additives market share in 2024. Mineral / supplementary cementitious additives are projected to expand at a 7.88% CAGR through 2030.
- By performance attribute, water reducers led with 32.41% revenue share in 2024. Chemical resistance additives are forecast to grow at a 7.10% CAGR to 2030.
- By application, residential construction accounted for 36.82% of the Cement Additives market size in 2024. Infrastructure projects are advancing at a 7.25% CAGR through 2030.
- By geography, Asia-Pacific captured 46.25% of 2024 revenues, while the Middle East and Africa region is set to register the fastest 6.89% CAGR to 2030.
Global Cement Additives Market Trends and Insights
Drivers Impact Analysis*
| Driver | (~) % Impact on CAGR Forecast | Geographic Relevance | Impact Timeline |
|---|---|---|---|
| Rapid urbanization and infrastructure build-out | +2.1% | Global, concentrated in Asia-Pacific and MEA | Medium term (2-4 years) |
| Decarbonization mandates favoring blended cements | +1.8% | Europe, North America, spillover to Asia-Pacific | Long term (≥ 4 years) |
| Demand for high-performance concrete in mega-projects | +1.5% | Global, emphasis on Asia-Pacific and MEA | Short term (≤ 2 years) |
| 3-D-printed concrete needs bespoke rheology additives | +0.9% | North America, Europe, early adoption in Asia-Pacific | Long term (≥ 4 years) |
| Modular / precast factories need high-early-strength admixtures | +1.2% | Europe, North America, expanding to Asia-Pacific | Medium term (2-4 years) |
| Source: Mordor Intelligence | |||
Rapid Urbanization and Infrastructure Build-Out Drive Additive Demand
Global urban residency is projected to reach 68% by 2050, translating into roughly 1.4 billion additional city dwellers in the Asia-Pacific region alone. China’s 14th Five-Year Plan allocates USD 1.4 trillion for infrastructure upgrades, while India’s National Infrastructure Pipeline channels a matching USD 1.4 trillion through 2030[1]Government of India, “National Infrastructure Pipeline,” india.gov.in. High-rise construction in these megacities relies on advanced water reducers and plasticizers, which enable low water-cement ratios and rapid cycle times. Middle Eastern smart-city programs, including Saudi Arabia’s NEOM and the UAE (United Arab Emirates)’s Dubai 2040 framework, demand additives engineered for 50 °C job-site temperatures and aggressive chloride exposure.
Decarbonization Mandates Accelerate Blended Cement Adoption
California’s SB 596 requires a 40% reduction in cement emissions intensity by 2045, while the European Green Deal targets a 55% economy-wide cut by 2030. Limestone calcined clay cements (LC3) can reduce CO₂ footprints by up to 40% but require tailored dispersants to achieve early strength. With carbon-pricing regimes now encompassing 23% of global emissions, economic pull factors complement the regulatory push, encouraging the rapid commercialization of mineral-rich formulations[2]World Bank, “State and Trends of Carbon Pricing 2025,” worldbank.org.
High-Performance Concrete Demand in Mega-Projects
Projects exceeding USD 1 billion already account for 15% of global construction spend, and many specify 28-day compressive strengths above 60 MPa. India’s Mumbai-Ahmedabad High-Speed Rail and multiple Middle East Vision 2030 builds illustrate the surge in additive packages that combine superplasticizers, accelerators, and corrosion inhibitors for 100-year service life in marine or desert environments. Stringent performance clauses create a moat for suppliers offering lab-validated, multi-functional solutions.
3-D Concrete Printing Revolutionizes Rheology Requirements
Large-scale additive manufacturing in construction is expanding at roughly 91% annually, but success hinges on precise thixotropic behavior that standard admixtures cannot deliver. Nanoclay-modified polymers and associative thickeners, specifically designed for shear recovery, enable stable layer deposition without slump. Europe’s first multi-story printed apartment block and North America’s disaster-relief housing pilots spotlight a fast-emerging sub-segment hungry for bespoke chemistry.
Restraints Impact Analysis*
| Restraint | (~) % Impact on CAGR Forecast | Geographic Relevance | Impact Timeline |
|---|---|---|---|
| Raw-material price volatility for key chemicals | -1.4% | Global, acutely felt in cost-sensitive markets | Short term (≤ 2 years) |
| Shrinking fly-ash supply as coal plants retire | -0.9% | North America, Europe, emerging in Asia-Pacific | Medium term (2-4 years) |
| Quality variability of locally sourced industrial by-products | -0.6% | Emerging markets, rural projects | Long term (≥ 4 years) |
| Source: Mordor Intelligence | |||
Raw-Material Price Volatility Constrains Market Growth
Prices for naphthalene sulfonate and polycarboxylate ether, both oil-derived, increased by up to 40% between 2023 and 2025, leaving suppliers little time to adjust their contracts. With 60% of global additive production clustered in East Asia, shipping disruptions magnify regional price differences and prompt substitution toward lower-grade admixtures.
Fly-Ash Supply Shortage Disrupts Mineral Additive Markets
Retiring coal-fired plants removed nearly 20 million tons of fly-ash feedstock in North America and Europe between 2022 and 2025. Prices now run 30-50% above pre-shortage levels, steering concrete producers toward calcined clays or ground granulated blast-furnace slag. Reformulation cycles increase additive demand but raise qualification costs, slowing uptake in smaller markets.
*Our forecasts treat driver/restraint impacts as directional, not additive. The impact forecasts reflect baseline growth, mix effects, and variable interactions.
Segment Analysis
By Type: Chemical Additives Lead Despite Mineral Segment Acceleration
Chemical additives retained 54.37% of 2024 revenue, reflecting their indispensable role in workability control for high-strength and specialty concretes. The cement additives market size for chemical products is forecast to increase at a 5.9% CAGR through 2030, driven by mega projects and the demand for bespoke blends in 3D printing. Mineral and supplementary cementitious additives, driven by policy-driven carbon reduction targets, are projected to grow at a 7.88% CAGR, capturing incremental share from traditional Portland-optimized chemistries. LC3 and ground glass pozzolans lead this surge, particularly in California and the European Union (EU), where SB 596 and Green Deal milestones drive substitution.
Cost, consistency, and code compliance dictate supplier strategies. Commodity fly ash variability prompts producers to opt for engineered minerals with tighter particle-size distributions, often co-packaged with dispersants that enhance early strength. Chemical suppliers, meanwhile, expand their portfolios to include bio-based and reclaimed-carbon feedstocks that align with LEED (Leadership in Energy and Environmental Design) points and ISO (International Organization for Standardization) 14001 certification. Cross-segment collaboration is growing as mineral and chemical suppliers jointly validate compatibility under ASTM C618 and C494, thereby minimizing job-site risk and facilitating specifier adoption.


By Performance Attribute: Water Reducers Dominate While Chemical Resistance Accelerates
Water reducers accounted for 32.41% of 2024 turnover and anchor every high-performance mix from skyscraper cores to wind-turbine bases. Segment leaders iterate polycarboxylate chemistries that combine 25% higher water-reduction efficiency with slump retention exceeding two hours in 35°C job-site heat. Chemical resistance additives, although smaller today, are projected to post the sharpest 7.10% CAGR as industrial expansions and coastal infrastructure escalate demand for acid, chloride, and sulfate durability.
Composite packages that combine water reduction, rheology control, and chemical resistance are gaining traction among contractors seeking a lower total cost of ownership. Product innovation now targets conductivity tuning for embedded sensor networks, enabling predictive maintenance in smart infrastructure. Standard setters, such as EN 934-2 and the American Society for Testing and Materials (ASTM) C494, push performance thresholds higher, compelling continuous R&D and deeper collaboration between additive suppliers and ready-mix producers.
By Application: Residential Construction Leads Despite Infrastructure Growth
Residential builds generated 36.82% of 2024 revenue, underpinned by sustained housing deficits in Asia-Pacific urban centers. Yet, infrastructure overtakes growth, expanding at a 7.25% CAGR on the back of high-speed rail, renewable energy installations, and flood defense upgrades. The cement additives market share in infrastructure already tops 29% regionally, setting the stage for future leadership as public budgets shift from green-field housing toward climate-resilient assets.
Commercial and industrial projects maintain steady growth but require distinct additive suites. Office retrofits lean on shrinkage-compensating formulations for floor leveling, while petrochemical sites specify silica-fume-based mixes paired with corrosion inhibitors for a 100-year design life. Each end use carries unique compliance burdens—from ISO 14001 for industrial applications to WELL Building standards for commercial ones—which cascade back into additive selection and formulation.


Geography Analysis
Asia-Pacific captured 46.25% of 2024 revenue and remains the center of gravity for cement demand. China alone consumed more cement in 2024 than the rest of the world combined, supported by USD 1.4 trillion earmarked for infrastructure in its current Five-Year Plan. India mirrors the scale, targeting similar outlays under its National Infrastructure Pipeline. Japan and South Korea emphasize seismic-resistant concretes requiring advanced viscosity modifiers, while ASEAN economies add volume through mass urbanization. The region benefits from its proximity to chemical feedstocks, but it struggles with quality control gaps across its fragmented supply chains.
The Middle East and Africa post the fastest 6.89% CAGR, lifted by Gulf mega-projects such as NEOM, Dubai 2040, and Qatar World Cup legacy assets. Conditions exceeding 50°C, combined with marine aerosol exposure, require customized retarding and corrosion-resistant packs, creating high entry barriers for generic admixtures. Limited domestic manufacturing fosters joint ventures between local distributors and global technology owners, shortening lead times and lowering cost premiums.
Europe and North America are recording mid-single-digit growth, underpinned by sustainability mandates rather than raw volume. The EU Green Deal fuels adoption of low-carbon concretes that blend mineral additives and novel chemical dispersants, while the U.S. Infrastructure Investment and Jobs Act injects USD 1 trillion into bridge and water projects that prioritize durability and life-cycle cost. Both regions increasingly enforce EPDs (environmental product declarations), nudging suppliers toward transparent, cradle-to-gate carbon accounting.

Competitive Landscape
The Cement Additives market is moderately fragmented. Competition pivots on sustainability credentials and digital integration. Cloud-linked mix-design platforms now feed sensor data back into batching algorithms, trimming cement content and shrinkage. Firms investing over 3% of revenue into R&D lead patent filings on nanoclay rheology modifiers and CO₂-mineralization agents that sequester up to 6 kg CO₂ per cubic meter of concrete. Regional challengers ride shorter supply chains to defend niche markets—for example, Fosroc in the Middle East or Pidilite in India—while licensing global chemistries to fill technical gaps.
Cement Additives Industry Leaders
Sika AG
Mapei S.p.A.
Fosroc, Inc.
Master Builders Solutions
GCP Applied Technologies (Saint-Gobain)
- *Disclaimer: Major Players sorted in no particular order

Recent Industry Developments
- February 2025: BASF launched biomass-balanced (BMB) and Ccycled grades of its plasticizer portfolio from production sites in Texas and Ontario to customers in North America. The sites and mass-balanced products have been certified in accordance with the International Sustainability and Carbon Certification (ISCC) PLUS scheme.
- September 2024: Master Builders Solutions launched MasterEase 5000 water-reducing and conditioning admixture that addresses the workability challenges of concrete mixtures utilizing blended cements, supplementary cementitious materials (SCM), and challenging aggregates.


Global Cement Additives Market Report Scope
| Chemical Additives |
| Mineral / Supplementary Cementitious Additives |
| Water Reducers |
| Coloring Agents |
| Retarding Agents |
| Chemical Resistance |
| Plasticizers |
| Others |
| Residential Construction |
| Commercial Construction |
| Infrastructure (Roads, Bridges, Dams, Rail) |
| Industrial and Energy Projects |
| Asia-Pacific | China |
| India | |
| Japan | |
| South Korea | |
| ASEAN Countries | |
| Rest of Asia-Pacific | |
| North America | United States |
| Canada | |
| Mexico | |
| Europe | Germany |
| United Kingdom | |
| France | |
| Italy | |
| Spain | |
| Russia | |
| Rest of Europe | |
| South America | Brazil |
| Argentina | |
| Rest of South America | |
| Middle-East and Africa | Saudi Arabia |
| United Arab Emirates | |
| South Africa | |
| Rest of Middle-East and Africa |
| By Type | Chemical Additives | |
| Mineral / Supplementary Cementitious Additives | ||
| By Performance Attribute | Water Reducers | |
| Coloring Agents | ||
| Retarding Agents | ||
| Chemical Resistance | ||
| Plasticizers | ||
| Others | ||
| By Application | Residential Construction | |
| Commercial Construction | ||
| Infrastructure (Roads, Bridges, Dams, Rail) | ||
| Industrial and Energy Projects | ||
| By Geography | Asia-Pacific | China |
| India | ||
| Japan | ||
| South Korea | ||
| ASEAN Countries | ||
| Rest of Asia-Pacific | ||
| North America | United States | |
| Canada | ||
| Mexico | ||
| Europe | Germany | |
| United Kingdom | ||
| France | ||
| Italy | ||
| Spain | ||
| Russia | ||
| Rest of Europe | ||
| South America | Brazil | |
| Argentina | ||
| Rest of South America | ||
| Middle-East and Africa | Saudi Arabia | |
| United Arab Emirates | ||
| South Africa | ||
| Rest of Middle-East and Africa | ||


Key Questions Answered in the Report
What is the current value of the cement additives market?
The market is valued at USD 18.78 billion in 2025 and is projected to reach USD 26.03 billion by 2030.
Which segment is expanding fastest within cement additives?
Mineral / supplementary cementitious additives are growing at a 7.88% CAGR, the quickest among all type categories.
Which region shows the strongest growth potential?
The Middle East and Africa region is set to register the fastest 6.89% CAGR through 2030 due to large-scale infrastructure programs.
How are decarbonization regulations influencing product demand?
Policies such as California’s SB 596 and the EU Green Deal accelerate demand for low-carbon concretes, driving higher usage of both mineral additives and compatible chemical dispersants.
What technological trends are shaping future additive innovation?
Nanoclay-enhanced rheology modifiers, CO₂-curing agents, and digital mix-design platforms are emerging as pivotal technologies for next-generation formulations.
Page last updated on:


