Ordinary Portland Cement Market Size and Share
Market Overview
| Study Period | 2020 - 2031 |
|---|---|
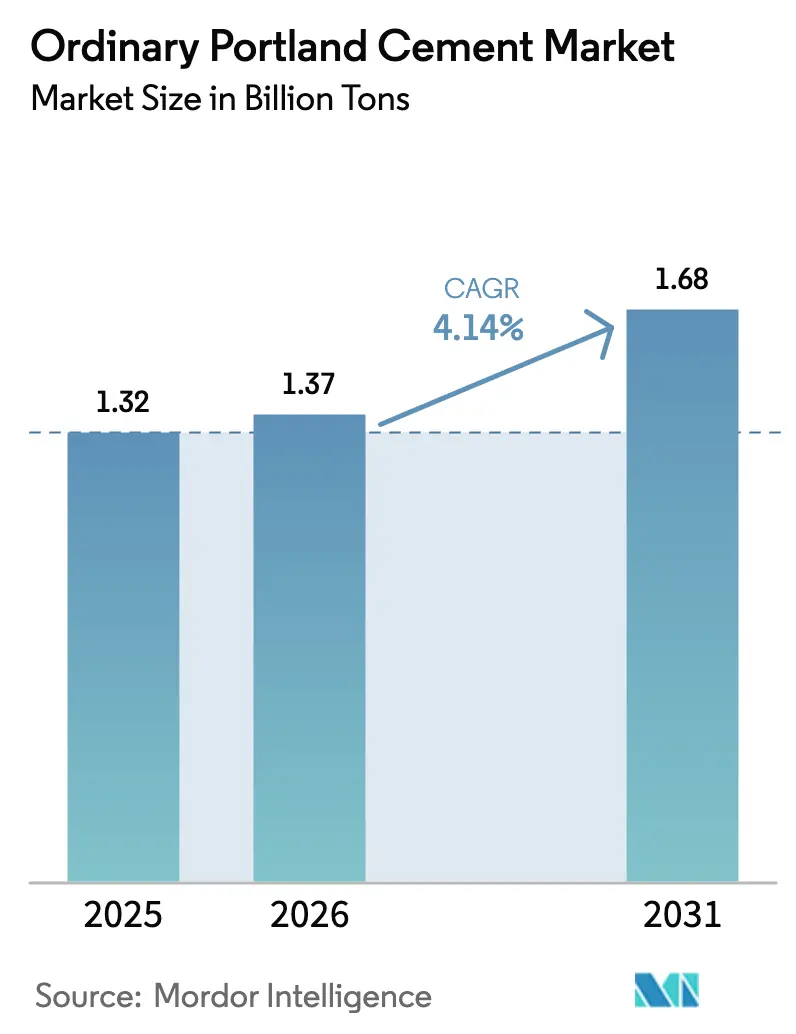
| Market Volume (2026) | 1.37 Billion tons |
| Market Volume (2031) | 1.68 Billion tons |
| Growth Rate (2026 - 2031) | 4.14% CAGR |
| Fastest Growing Market | Asia Pacific |
| Largest Market | Asia Pacific |
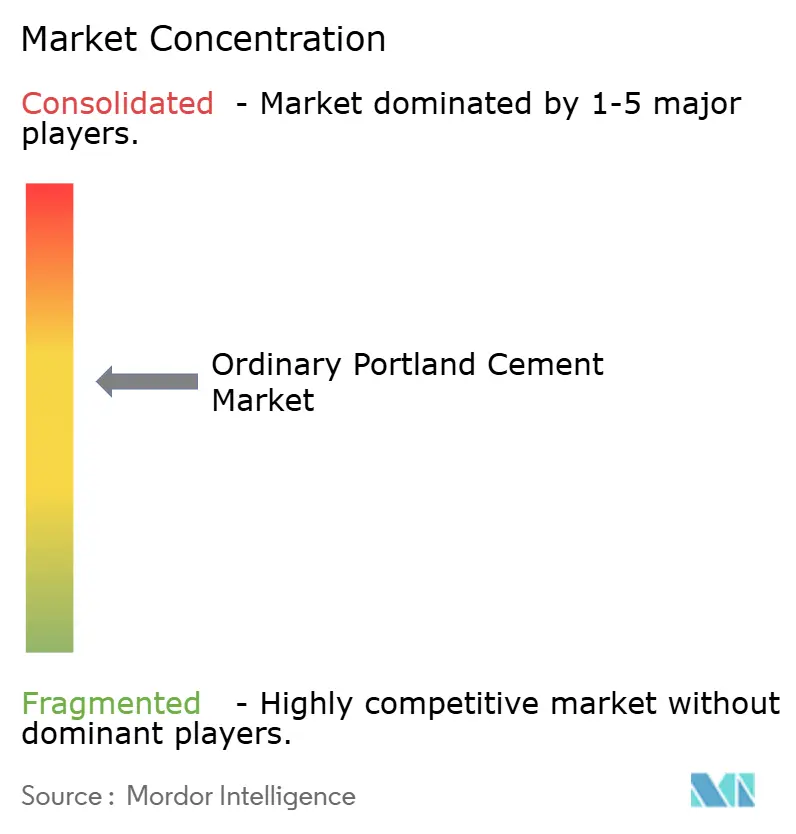
| Market Concentration | Medium |
Major Players *Disclaimer: Major Players sorted in no particular order Image © Mordor Intelligence. Reuse requires attribution under CC BY 4.0. | |
Ordinary Portland Cement Market Analysis by Mordor Intelligence
Ordinary Portland Cement market size in 2026 is estimated at 1.37 Billion tons, growing from 2025 value of 1.32 Billion tons with 2031 projections showing 1.68 Billion tons, growing at 4.14% CAGR over 2026-2031. The steady trajectory underscores the irreplaceable role of Ordinary Portland Cement as the primary binder for concrete and mortar, especially in emerging economies that continue to prioritize large-scale infrastructure. Sustained demand originates from tier-2 urbanization in Asia and Africa, as well as sovereign infrastructure programs in India and China, and resilient private spending on commercial facilities following the pandemic pause. At the same time, carbon-pricing policies and clinker-substitution mandates are steering producers toward lower-emission formulations, prompting capital outlays in waste-fuel systems and carbon-capture technology. Net-zero procurement pledges from global contractors further reinforce the commercial premium for low-carbon Ordinary Portland Cement, creating a bifurcated market where technology-enabled suppliers gain share over legacy operators.
Key Report Takeaways
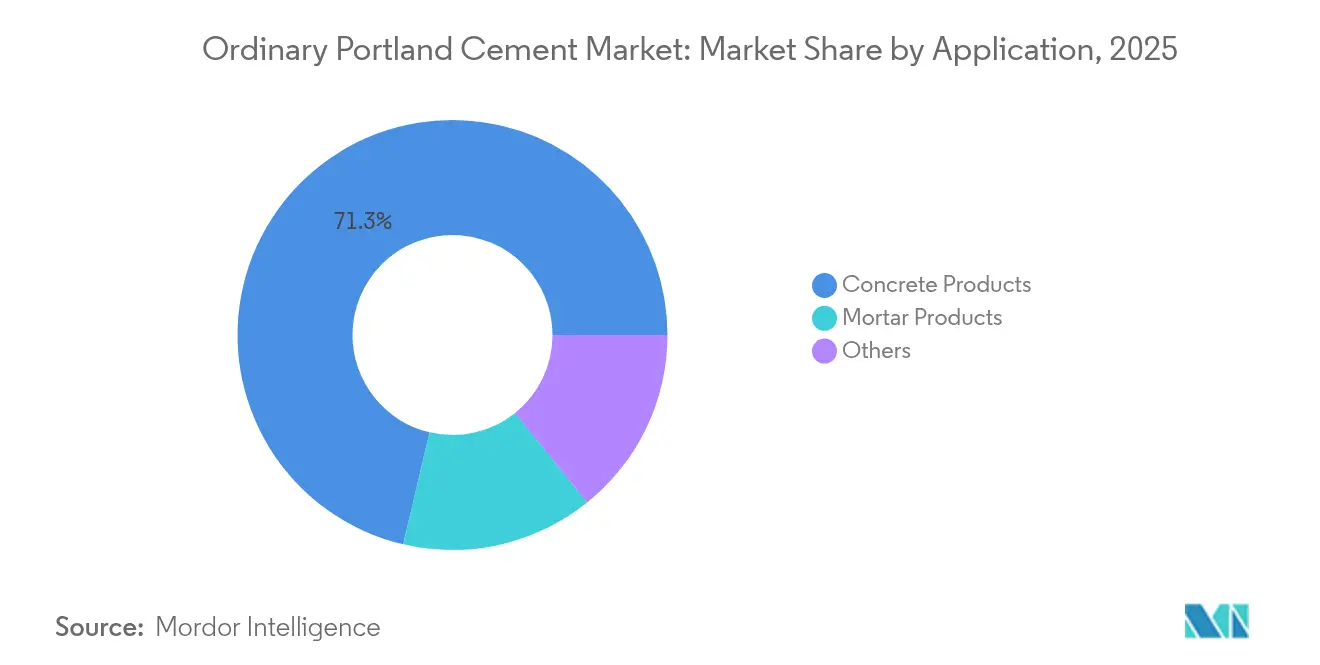
- By application, concrete products held 71.32% of the Ordinary Portland Cement market share in 2025, while mortar products are set to post the highest 5.21% CAGR through 2031.
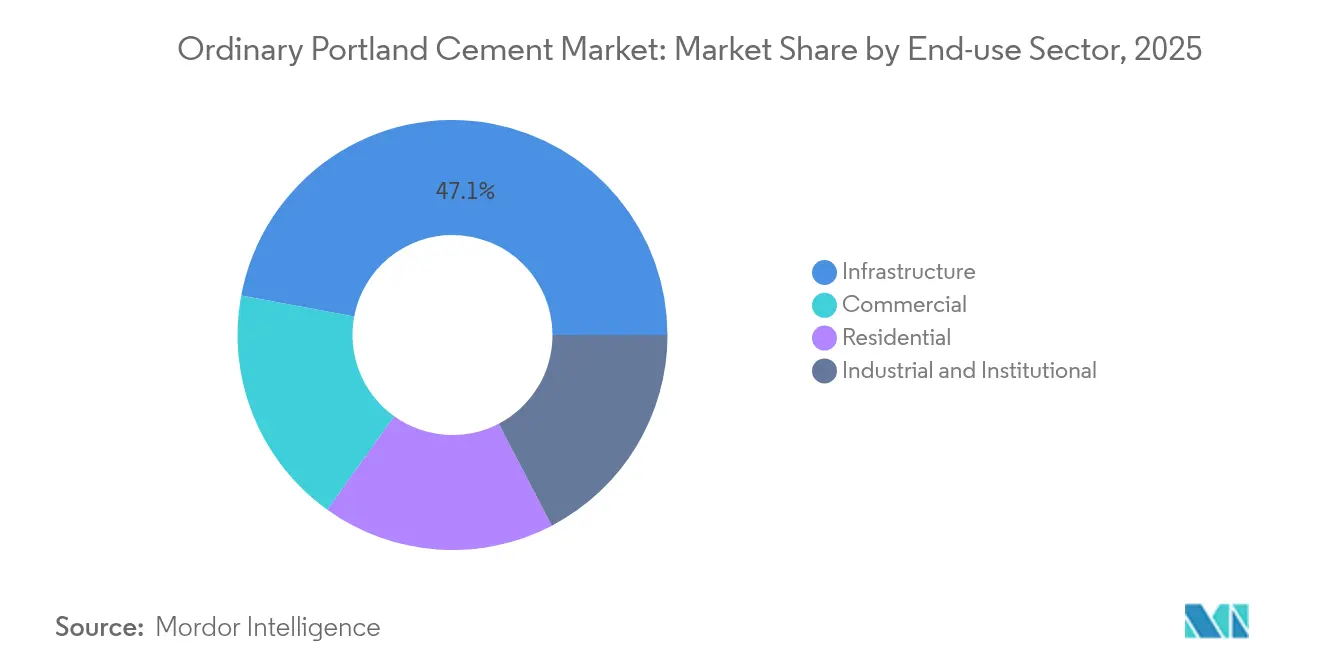
- By end-use sector, infrastructure contributed a 47.05% share of the Ordinary Portland Cement market size in 2025; commercial construction is projected to grow at the fastest rate, with a 5.11% CAGR, to 2031.
- By geography, the Asia-Pacific region commanded 68.05% of the Ordinary Portland Cement market share in 2025 and is also forecasted to lead regional growth with a 4.29% CAGR through 2031.
Note: Market size and forecast figures in this report are generated using Mordor Intelligence’s proprietary estimation framework, updated with the latest available data and insights as of 2026.
Global Ordinary Portland Cement Market Trends and Insights
Drivers Impact Analysis*
| Driver | (~) % Impact on CAGR Forecast | Geographic Relevance | Impact Timeline |
|---|---|---|---|
| Surge in mega-infrastructure spending | +1.2% | Global with emphasis on APAC and MEA | Medium term (2-4 years) |
| Increased clinker-substitution mandates | +0.8% | Europe and North America, extending to APAC | Long term (≥ 4 years) |
| Net-zero roadmaps from top cement buyers | +0.6% | OECD nations leading, global adoption rising | Long term (≥ 4 years) |
| Rapid urbanization in tier-2 Asian & African cities | +1.1% | APAC core with MEA spill-over | Medium term (2-4 years) |
| Carbon Border Adjustment Mechanism in EU | +0.4% | Europe with global trade implications | Short term (≤ 2 years) |
| Source: Mordor Intelligence | |||


Surge in Mega-Infrastructure Spending
Governments worldwide are channeling multi-trillion-dollar programs into transportation corridors, renewable-energy hubs, and data-center clusters that depend heavily on the Ordinary Portland Cement market supply. Saudi Arabia’s USD 500 billion NEOM development, India’s National Infrastructure Pipeline, and China’s Belt and Road extensions alone represent more than 1 billion tons of incremental cement potential through 2030. Multi-year contract structures now replace cyclical tendering, providing producers with clearer revenue visibility and encouraging capacity expansions near project sites. The multiplier effect of core infrastructure on secondary residential and commercial builds further amplifies demand, ensuring that Ordinary Portland Cement market volume growth remains above 4% even in carbon-constrained regions.
Increased Clinker-Substitution Mandates
The European Cement Association confirms that member states must achieve at least 25% clinker substitution by 2027, with penalties of up to EUR 50 million per year for non-compliance. Similar thresholds have been tabled in Canada and parts of Asia. Producers with secure streams of ground-granulated blast-furnace slag or fly-ash are hedging against clinker curbs by investing in beneficiation plants valued at USD 800 million across Europe alone. These mandates propel technology transfer into emerging markets where voluntary adoption accelerates ahead of legislation, giving early movers pricing power and lower carbon liabilities.
Net-Zero Roadmaps from Top Cement Buyers
Major contractors such as Skanska and Vinci have pledged to source 50% of their cement from suppliers with science-based targets by 2027, creating a 15 million-ton premium segment priced USD 15–25 per ton higher than conventional grades. Public procurement agencies in Germany and Canada have adopted similar criteria, establishing a market pull that rivals regulatory pressure. Producers offering third-party verified, low-emission Ordinary Portland Cement can therefore command margins 200–400 basis points above commodity grades, a differential expected to widen as carbon-cost pass-through intensifies.
Rapid Urbanization in Tier-2 Asian and African Cities
UN-Habitat data show annual population growth of 4–6% in cities such as Pune, Surabaya, and Accra, triggering distributed demand for Ordinary Portland Cement market supply in locations previously served by imports[1]Research Unit, “Global Urbanization Prospects 2024,” unhabitat.org. Regional players are commissioning 1–2 million-ton plants designed for localized limestone resources and shorter delivery radii, reducing transport emissions and securing first-mover advantage before multinational entrants scale up. Government incentives for tier-2 city infrastructure provide anchor contracts that stabilize cash flow and justify brownfield capacity upgrades.
Restraints Impact Analysis*
| Restraint | (~) % Impact on CAGR Forecast | Geographic Relevance | Impact Timeline |
|---|---|---|---|
| Volatile petcoke & thermal-coal prices | −0.7% | Global, pronounced in coal-dependent regions | Short term (≤ 2 years) |
| Tightening CO₂-emission caps & carbon costs | −0.9% | Europe & North America, expanding worldwide | Medium term (2-4 years) |
| Rising adoption of SCM alternatives | −0.5% | Developed markets spearheading | Long term (≥ 4 years) |
| Construction labor shortages in OECD | −0.3% | North America and Europe | Medium term (2-4 years) |
| Source: Mordor Intelligence | |||
Volatile Petcoke and Thermal-Coal Prices
Average 2024 petcoke quotations surged 45% to USD 180 per ton, while thermal coal climbed 32% to USD 135 per ton, adding USD 25–35 per ton to the cost of production for Ordinary Portland Cement market participants. Southeast Asian and African plants, where alternative-fuel penetration is below 15%, experienced quarterly fuel-cost swings of more than 20%, forcing margin compression and renegotiation of fixed-price supply contracts. Unpredictable energy outlays have therefore accelerated investment in biomass, tire-derived fuel, and waste-heat recovery systems that promise payback within four years.
Tightening CO₂-Emission Caps and Rising Carbon-Credit Costs
European Energy Exchange data show that the average 2024 EUA trade price is EUR 85 per ton, representing a 35% year-on-year escalation. At current clinker emission factors, this translates to USD 65–80 per ton of cement, raising the variable cost base by more than 15% for kilns reliant on legacy fuels. North American cap-and-trade schemes and China’s provincial pilots are following suit, suggesting a progressive squeeze on high-carbon producers and hastening adoption of carbon-capture, utilization, and storage systems.
*Our forecasts treat driver/restraint impacts as directional, not additive. The impact forecasts reflect baseline growth, mix effects, and variable interactions.
Segment Analysis
By Application: Concrete Dominance Faces Mortar Innovation
Concrete applications accounted for 71.32% of the Ordinary Portland Cement market size in 2025, underlining its status as the structural backbone for highways, bridges, and skyscrapers. Mortar, however, is poised to outpace all other applications at a 5.21% CAGR through 2031 as ready-mix suppliers roll out polymer-enhanced, fiber-reinforced formulations tailored to tight urban job sites. The Ordinary Portland Cement market benefits from mortars that reduce on-site mixing time by 30%, an efficiency welcomed by contractors battling skilled labor shortages. Ready-mix mortar penetration exceeds 60% in Western Europe but stands below 25% across South Asia, indicating significant room for growth as building codes and contractor preferences converge.
Concrete will retain its volume supremacy through the forecast horizon, yet margin pools are expected to shift toward value-added mortars that incorporate specialty additives. Producers owning distribution networks in metropolitan clusters capture both downstream mark-ups and logistical synergies. Meanwhile, the Others category—covering oil-well cementing and waste-stabilization blends—delivers steady, GDP-linked growth that diversifies revenue. Energy-sector projects in the Middle East and North America rely on sulphate-resistant Ordinary Portland Cement market grades, cushioning demand fluctuations tied to conventional civil construction cycles.


By End-Use Sector: Infrastructure Leadership Meets Commercial Acceleration
Infrastructure accounted for 47.05% of the Ordinary Portland Cement market size in 2025, as governments accelerated spending on transportation grids, renewable energy bases, and climate-resilient flood defenses. Rail, metro, and highway corridors are singularly cement-intensive, with single megaprojects requiring upwards of 3 million tons of cement over multi-year horizons. The commercial segment—particularly office retrofits and hyperscale data centers—is set to register the fastest 5.11% CAGR through 2031. Each data-center campus demands 15,000–25,000 tons of high-thermal-mass concrete, a specification that leverages Ordinary Portland Cement market grades capable of dissipating server heat load. Rising e-commerce logistics hubs and cold-storage warehouses further fuel commercial consumption, prompting architects to opt for high-strength OPC blends with controlled shrinkage.
Industrial and institutional builds contribute a stable baseline demand, supported by the reshoring of manufacturing capacity and expansions of healthcare facilities in emerging economies. Residential consumption is mixed: affordable housing drives Asian volume, while demographic shifts and affordability pressures temper new-build momentum in Europe. Nevertheless, stringent seismic codes in Japan and California mandate higher-grade Ordinary Portland Cement market formulations, partially offsetting unit declines with higher per-square-meter cement intensity.
Geography Analysis
Asia-Pacific’s Ordinary Portland Cement market dominance arises from synchronized urbanization, captive limestone reserves, and vertically integrated supply chains that reduce delivered-cost variability. India’s National Infrastructure Pipeline targets USD 2.0 trillion in civil works by 2030 and underpins annual cement demand growth of 6–8%. Indonesia, Thailand, and the Philippines benefit from export-oriented manufacturing that drives warehousing and port expansion, reinforcing baseline domestic cement orders.
Europe and North America pivot on sustainability mandates that reward low-carbon Ordinary Portland Cement market producers. European emissions-trading costs averaging EUR 85 per ton of CO₂ compress margins for legacy kilns, compelling rapid investment in oxy-fuel combustion and waste-fuel substitution. In the United States, labor bottlenecks lengthen project timelines, but federal funding flows maintain order in backlogs. Meanwhile, Canada’s procurement rules now stipulate embodied-carbon disclosures that favor blended cements.
The Middle East & Africa, as well as South America, contribute smaller aggregate volumes yet register the steepest percentage gains as oil-rich nations diversify and commodity exporters upgrade their logistics corridors. Saudi Arabia plans USD 500 billion worth of desert infrastructure that requires sulfate-resistant Ordinary Portland Cement. Brazil’s concession model incentivizes private toll-road construction, and Nigeria’s tier-2 city build-out opens niches for mid-capacity regional producers. Import substitution strategies and tariff regimes encourage new-plant announcements, pointing to self-sufficiency objectives that reshape regional trade flows.


Competitive Landscape
The Ordinary Portland Cement Market is moderately consolidated. Holcim, Cemex, and UltraTech implement vertical integration across quarrying, grinding, and downstream concrete production to secure margin capture and enhance supply resilience. Patent pools and joint ventures surrounding carbon-capture technology suggest a dynamic of cooperative competition, as scale is crucial to de-risking multi-hundred-million-dollar projects. Companies failing to adapt to risk asset impairment and market-share erosion as low-carbon premiums rise.
Ordinary Portland Cement Industry Leaders
BBMG Corporation
China National Building Material Group Corporation
Heidelberg Materials
Anhui Conch Cement Co., Ltd.
HOLCIM
- *Disclaimer: Major Players sorted in no particular order

Recent Industry Developments
- December 2024: UltraTech Cement Limited secured a 32.72% stake in The India Cements Limited (ICEM), a prominent producer of Ordinary Portland Cement (OPC) in India. This move grants UltraTech exclusive control over ICEM, elevating it to the status of ICEM's promoter.
- April 2024: HOLCIM announced an investment of a three-figure million sum into its cement plant in Lägerdorf, Germany. This plant produces Ordinary Portland cement and other types of cement. The plant will employ a second-generation oxyfuel kiln line to increase the concentration of CO₂ in the flue gas during clinker production. The new kiln line is expected to be operational by 2029.


Global Ordinary Portland Cement Market Report Scope
Commercial, Industrial and Institutional, Infrastructure, Residential are covered as segments by End Use Sector. Asia-Pacific, Europe, Middle East and Africa, North America, South America are covered as segments by Region.| Concrete Products |
| Mortar Products |
| Others |
| Commercial |
| Industrial & Institutional |
| Infrastructure |
| Residential |
| Asia-Pacific | Australia |
| China | |
| India | |
| Indonesia | |
| Japan | |
| Malaysia | |
| South Korea | |
| Thailand | |
| Vietnam | |
| Rest of Asia-Pacific | |
| North America | Canada |
| Mexico | |
| United States | |
| Europe | France |
| Germany | |
| Italy | |
| Russia | |
| Spain | |
| United Kingdom | |
| Rest of Europe | |
| South America | Argentina |
| Brazil | |
| Rest of South America | |
| Middle East & Africa | Saudi Arabia |
| United Arab Emirates | |
| Rest of Middle East & Africa |
| By Application | Concrete Products | |
| Mortar Products | ||
| Others | ||
| By End-use Sector | Commercial | |
| Industrial & Institutional | ||
| Infrastructure | ||
| Residential | ||
| By Geography | Asia-Pacific | Australia |
| China | ||
| India | ||
| Indonesia | ||
| Japan | ||
| Malaysia | ||
| South Korea | ||
| Thailand | ||
| Vietnam | ||
| Rest of Asia-Pacific | ||
| North America | Canada | |
| Mexico | ||
| United States | ||
| Europe | France | |
| Germany | ||
| Italy | ||
| Russia | ||
| Spain | ||
| United Kingdom | ||
| Rest of Europe | ||
| South America | Argentina | |
| Brazil | ||
| Rest of South America | ||
| Middle East & Africa | Saudi Arabia | |
| United Arab Emirates | ||
| Rest of Middle East & Africa | ||


Market Definition
- END-USE SECTOR - Ordinary portland cement consumed in the construction sectors such as commercial, residential, industrial, institutional, and infrastructure are considered under the scope of the study.
- PRODUCT/APPLICATION - Under the scope of the study, the consumption of ordinary portland cement for pavement and sidewalks, reinforced concrete buildings, bridges, railway structures, tanks, and reservoirs among others are considered.
| Keyword | Definition |
|---|---|
| Accelerator | Accelerators are admixtures used to fasten the setting time of concrete by increasing the initial rate and speeding up the chemical reaction between cement and the mixing water. These are used to harden and increase the strength of concrete quickly. |
| Acrylic | This synthetic resin is a derivative of acrylic acid. It forms a smooth surface and is mainly used for various indoor applications. The material can also be used for outdoor applications with a special formulation. |
| Adhesives | Adhesives are bonding agents used to join materials by gluing. Adhesives can be used in construction for many applications, such as carpet laying, ceramic tiles, countertop lamination, etc. |
| Air Entraining Admixture | Air-entraining admixtures are used to improve the performance and durability of concrete. Once added, they create uniformly distributed small air bubbles to impart enhanced properties to the fresh and hardened concrete. |
| Alkyd | Alkyds are used in solvent-based paints such as construction and automotive paints, traffic paints, flooring resins, protective coatings for concrete, etc. Alkyd resins are formed by the reaction of an oil (fatty acid), a polyunsaturated alcohol (Polyol), and a polyunsaturated acid or anhydride. |
| Anchors and Grouts | Anchors and grouts are construction chemicals that stabilize and improve the strength and durability of foundations and structures like buildings, bridges, dams, etc. |
| Cementitious Fixing | Cementitious fixing is a process in which a cement-based grout is pumped under pressure to fill forms, voids, and cracks. It can be used in several settings, including bridges, marine applications, dams, and rock anchors. |
| Commercial Construction | Commercial construction comprises new construction of warehouses, malls, shops, offices, hotels, restaurants, cinemas, theatres, etc. |
| Concrete Admixtures | Concrete admixtures comprise water reducers, air entrainers, retarders, accelerators, superplasticizers, etc., added to concrete before or during mixing to modify its properties. |
| Concrete Protective Coatings | To provide specific protection, such as anti-carbonation or chemical resistance, a film-forming protective coat can be applied on the surface. Depending on the applications, different resins like epoxy, polyurethane, and acrylic can be used for concrete protective coatings. |
| Curing Compounds | Curing compounds are used to cure the surface of concrete structures, including columns, beams, slabs, and others. These curing compounds keep the moisture inside the concrete to give maximum strength and durability. |
| Epoxy | Epoxy is known for its strong adhesive qualities, making it a versatile product in many industries. It resists heat and chemical applications, making it an ideal product for anyone needing a stronghold under pressure. It is widely used in adhesives, electrical and electronics, paints, etc. |
| Fiber Wrapping Systems | Fiber Wrapping Systems are a part of construction repair and rehabilitation chemicals. It involves the strengthening of existing structures by wrapping structural members like beams and columns with glass or carbon fiber sheets. |
| Flooring Resins | Flooring resins are synthetic materials applied to floors to enhance their appearance, increase their resistance to wear and tear or provide protection from chemicals, moisture, and stains. Depending on the desired properties and the specific application, flooring resins are available in distinct types, such as epoxy, polyurethane, and acrylic. |
| High-Range Water Reducer (Super Plasticizer) | High-range water reducers are a type of concrete admixture that provides enhanced and improved properties when added to concrete. These are also called superplasticizers and are used to decrease the water-to-cement ratio in concrete. |
| Hot Melt Adhesives | Hot-melt adhesives are thermoplastic bonding materials applied as melts that achieve a solid state and resultant strength on cooling. They are commonly used for packaging, coatings, sanitary products, and tapes. |
| Industrial and Institutional Construction | Industrial and institutional construction includes new construction of hospitals, schools, manufacturing units, energy and power plants, etc. |
| Infrastructure Construction | Infrastructure construction includes new construction of railways, roads, seaways, airports, bridges, highways, etc. |
| Injection Grouting | The process of injecting grout into open joints, cracks, voids, or honeycombs in concrete or masonry structural members is known as injection grouting. It offers several benefits, such as strengthening a structure and preventing water infiltration. |
| Liquid-Applied Waterproofing Membranes | Liquid-Applied membrane is a monolithic, fully bonded, liquid-based coating suitable for many waterproofing applications. The coating cures to form a rubber-like elastomeric waterproof membrane and may be applied over many substrates, including asphalt, bitumen, and concrete. |
| Micro-concrete Mortars | Micro-concrete mortar is made up of cement, water-based resin, additives, mineral pigments, and polymers and can be applied on both horizontal and vertical surfaces. It can be used to refurbish residential complexes, commercial spaces, etc. |
| Modified Mortars | Modified Mortars include Portland cement and sand along with latex/polymer additives. The additives increase adhesion, strength, and shock resistance while also reducing water absorption. |
| Mold Release Agents | Mold release agents are sprayed or coated on the surface of molds to prevent a substrate from bonding to a molding surface. Several types of mold release agents, including silicone, lubricant, wax, fluorocarbons, and others, are used based on the type of substrates, including metals, steel, wood, rubber, plastic, and others. |
| Polyaspartic | Polyaspartic is a subset of polyurea. Polyaspartic floor coatings are typically two-part systems that consist of a resin and a catalyst to ease the curing process. It offers high durability and can withstand harsh environments. |
| Polyurethane | Polyurethane is a plastic material that exists in various forms. It can be tailored to be either rigid or flexible and is the material of choice for a broad range of end-user applications, such as adhesives, coatings, building insulation, etc. |
| Reactive Adhesives | A reactive adhesive is made of monomers that react in the adhesive curing process and do not evaporate from the film during use. Instead, these volatile components become chemically incorporated into the adhesive. |
| Rebar Protectors | In concrete structures, rebar is one of the important components, and its deterioration due to corrosion is a major issue that affects the safety, durability, and life span of buildings and structures. For this reason, rebar protectors are used to protect against degrading effects, especially in infrastructure and industrial construction. |
| Repair and Rehabilitation Chemicals | Repair and Rehabilitation Chemicals include repair mortars, injection grouting materials, fiber wrapping systems, micro-concrete mortars, etc., used to repair and restore existing buildings and structures. |
| Residential Construction | Residential construction involves constructing new houses or spaces like condominiums, villas, and landed homes. |
| Resin Fixing | The process of using resins like epoxy and polyurethane for grouting applications is called resin fixing. Resin fixing offers several advantages, such as high compressive and tensile strength, negligible shrinkage, and greater chemical resistance compared to cementitious fixing. |
| Retarder | Retarders are admixtures used to slow down the setting time of concrete. These are usually added with a dosage rate of around 0.2% -0.6% by weight of cement. These admixtures slow down hydration or lower the rate at which water penetrates the cement particles by making concrete workable for a long time. |
| Sealants | A sealant is a viscous material that has little or no flow qualities, which causes it to remain on surfaces where they are applied. Sealants can also be thinner, enabling penetration to a certain substance through capillary action. |
| Sheet Waterproofing Membranes | Sheet membrane systems are reliable and durable thermoplastic waterproofing solutions that are used for waterproofing applications even in the most demanding below-ground structures, including those exposed to highly aggressive ground conditions and stress. |
| Shrinkage Reducing Admixture | Shrinkage-reducing admixtures are used to reduce concrete shrinkage, whether from drying or self-desiccation. |
| Silicone | Silicone is a polymer that contains silicon combined with carbon, hydrogen, oxygen, and, in some cases, other elements. It is an inert synthetic compound that comes in various forms, such as oil, rubber, and resin. Due to its heat-resistant properties, it finds applications in sealants, adhesives, lubricants, etc. |
| Solvent-borne Adhesives | Solvent-borne adhesives are mixtures of solvents and thermoplastic or slightly cross-linked polymers such as polychloroprene, polyurethane, acrylic, silicone, and natural and synthetic rubbers. |
| Surface Treatment Chemicals | Surface treatment chemicals are chemicals used to treat concrete surfaces, including roofs, vertical surfaces, and others. They act as curing compounds, demolding agents, rust removers, and others. They are cost-effective and can be used on roadways, pavements, parking lots, and others. |
| Viscosity Modifier | Viscosity Modifiers are concrete admixtures used to change various properties of admixtures, including viscosity, workability, cohesiveness, and others. These are usually added with a dosage of around 0.01% to 0.1% by weight of cement. |
| Water Reducer | Water reducers, also called plasticizers, are a type of admixture used to decrease the water-to-cement ratio in the concrete, thereby increasing the durability and strength of concrete. Various water reducers include refined lignosulfonates, gluconates, hydroxycarboxylic acids, sugar acids, and others. |
| Water-borne Adhesives | Water-borne adhesives use water as a carrier or diluting medium to disperse resin. They are set by allowing the water to evaporate or be absorbed by the substrate. These adhesives are compounded with water as a dilutant rather than a volatile organic solvent. |
| Waterproofing Chemicals | Waterproofing chemicals are designed to protect a surface from the perils of leakage. A waterproofing chemical is a protective coating or primer applied to a structure's roof, retaining walls, or basement. |
| Waterproofing Membranes | Waterproofing membranes are liquid-applied or self-adhering layers of water-tight materials that prevent water from penetrating or damaging a structure when applied to roofs, walls, foundations, basements, bathrooms, and other areas exposed to moisture or water. |


Research Methodology
Mordor Intelligence follows a four-step methodology in all our reports.
- Step-1: Identify Key Variables: The quantifiable key variables (industry and extraneous) pertaining to the specific product segment and country are selected from a group of relevant variables & factors based on desk research & literature review; along with primary expert inputs. These variables are further confirmed through regression modeling (wherever required).
- Step-2: Build a Market Model: In order to build a robust forecasting methodology, the variables and factors identified in Step-1 are tested against available historical market numbers. Through an iterative process, the variables required for market forecast are set and the model is built on the basis of these variables.
- Step-3: Validate and Finalize: In this important step, all market numbers, variables and analyst calls are validated through an extensive network of primary research experts from the market studied. The respondents are selected across levels and functions to generate a holistic picture of the market studied.
- Step-4: Research Outputs: Syndicated Reports, Custom Consulting Assignments, Databases & Subscription Platforms


