Cathode Materials Market Size and Share
Market Overview
| Study Period | 2021 - 2031 |
|---|---|
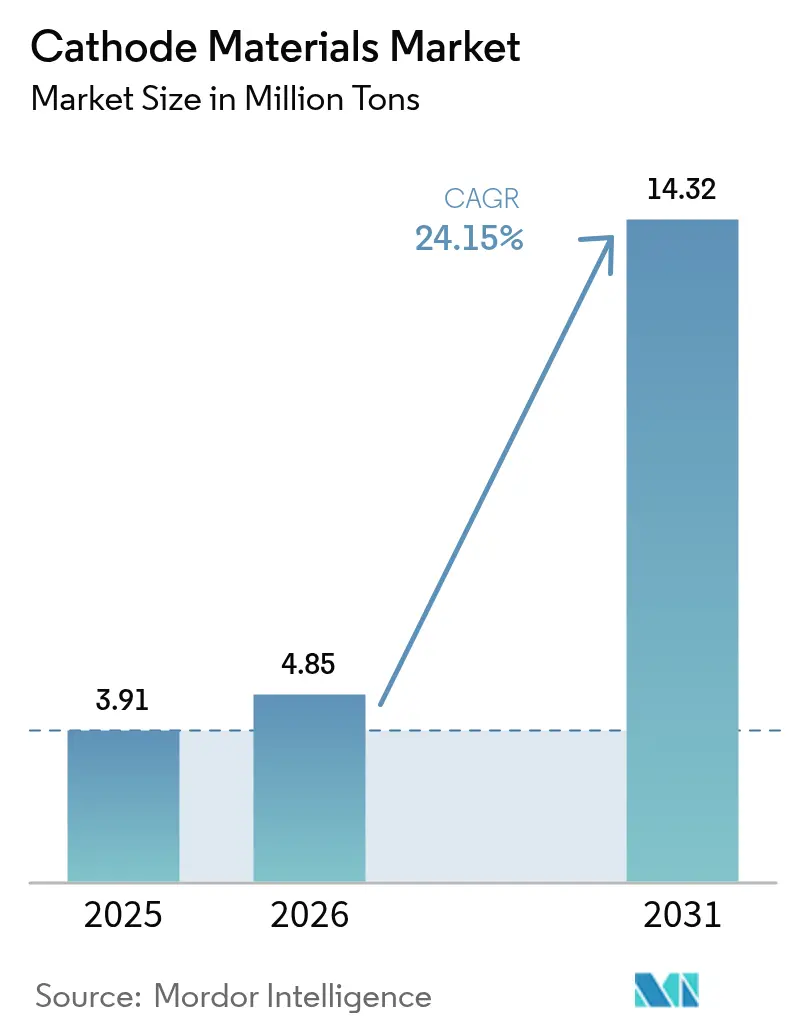
| Market Volume (2026) | 4.85 Million tons |
| Market Volume (2031) | 14.32 Million tons |
| Growth Rate (2026 - 2031) | 24.15% CAGR |
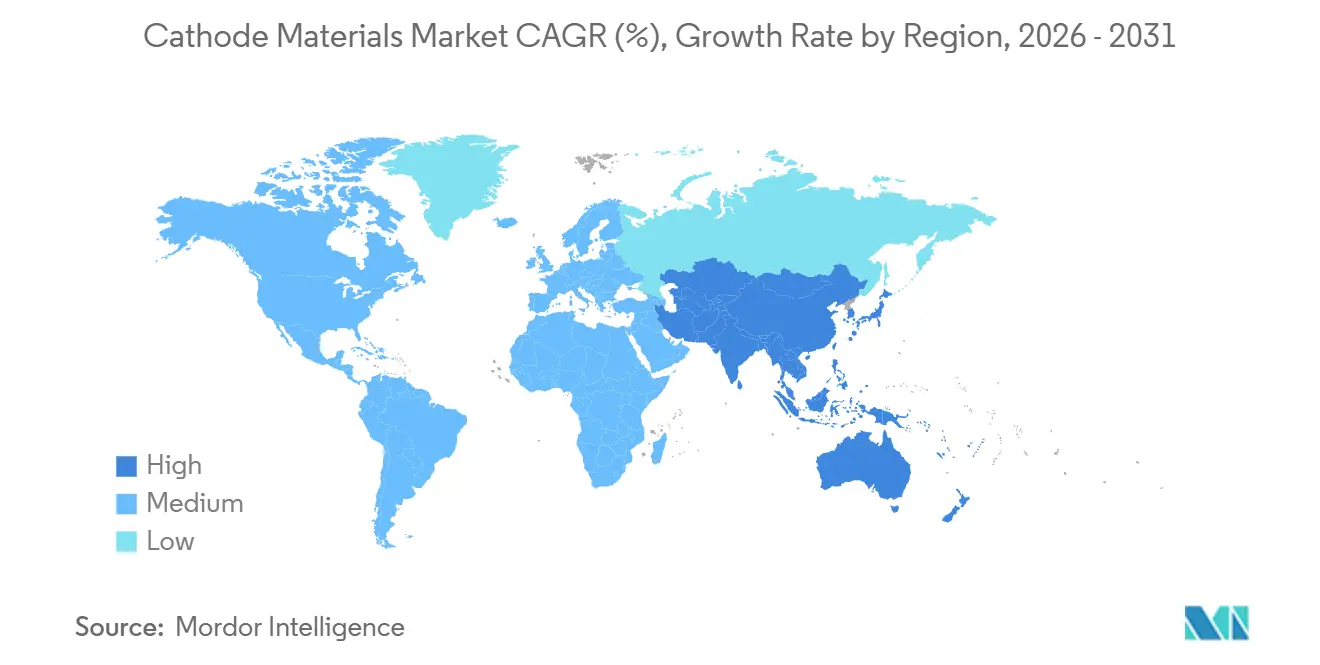
| Fastest Growing Market | Asia Pacific |
| Largest Market | Asia Pacific |
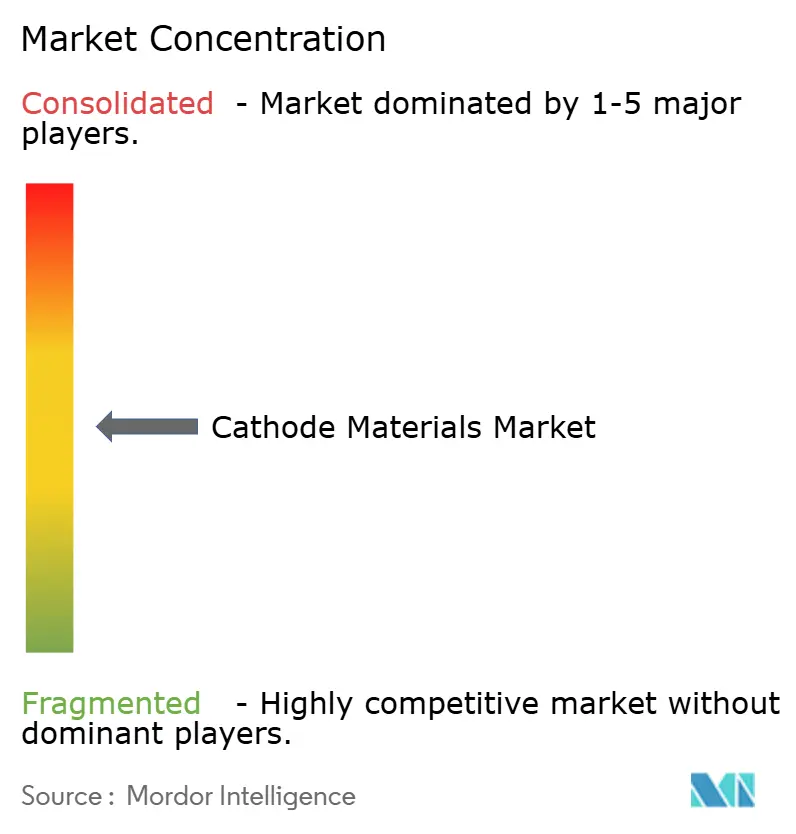
| Market Concentration | Medium |
Major Players *Disclaimer: Major Players sorted in no particular order Image © Mordor Intelligence. Reuse requires attribution under CC BY 4.0. | |
Cathode Materials Market Analysis by Mordor Intelligence
The Cathode Materials Market size was valued at 3.91 Million tons in 2025 and is estimated to grow from 4.85 Million tons in 2026 to reach 14.32 Million tons by 2031, at a CAGR of 24.15% during the forecast period (2026-2031). Automakers are prioritizing bill-of-material savings over energy density, prompting a pivot toward lithium iron phosphate (LFP) cells, while simultaneous gains in stationary storage and two-wheeler electrification create overlapping demand streams. Precursor joint ventures such as POSCO FUTURE M–GM and Ecopro BM–BMW expose how feedstock security now eclipses scale alone as a competitive lever. Regionally, Asia-Pacific will maintain its dominance as Indonesia’s downstream-nickel mandates and Vietnam’s assembly incentives accelerate local tonnage, whereas North American growth hinges on Inflation Reduction Act production credits. Emerging sodium-ion and LMFP chemistries broaden the cathode materials market addressable base, ensuring that lower-cost formulations complement premium NMC and NCA offerings.
Key Report Takeaways
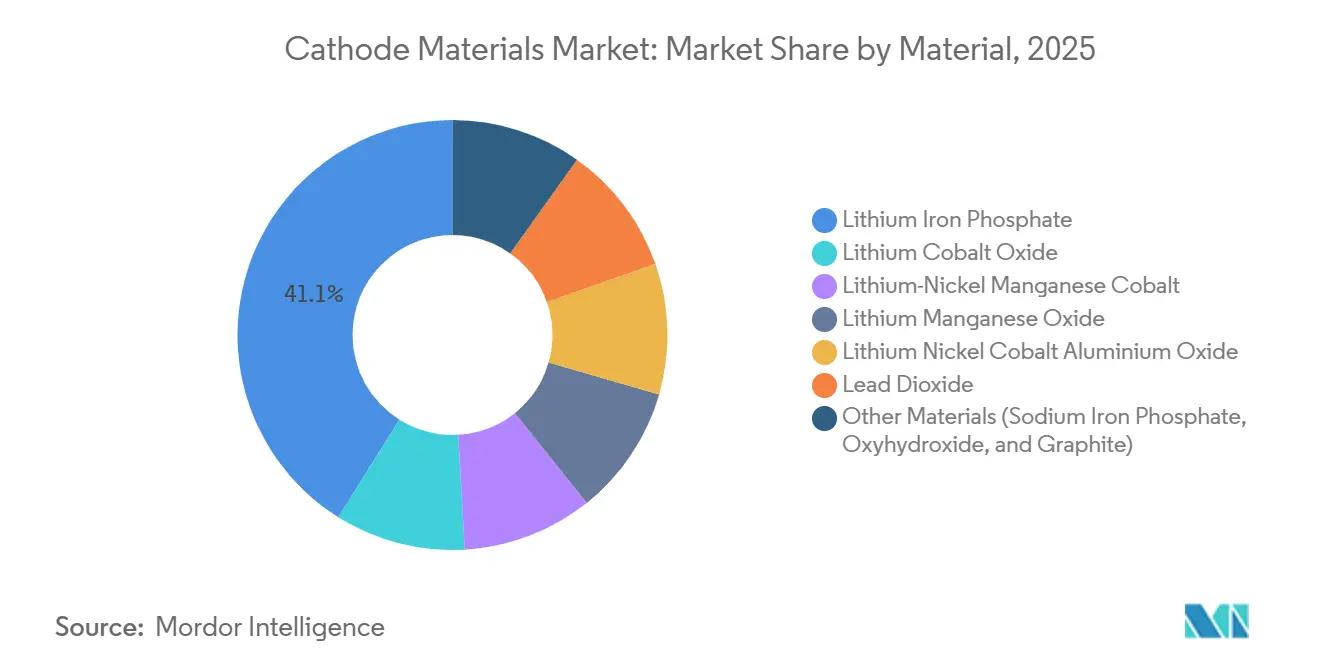
- By material, lithium iron phosphate led with 41.10% of cathode materials market share in 2025 and is forecast to post the quickest 24.97% CAGR through 2031.
- By battery type, lithium-ion accounted for 88.20% of demand in 2025 and is advancing at a 25.62% CAGR through 2031.
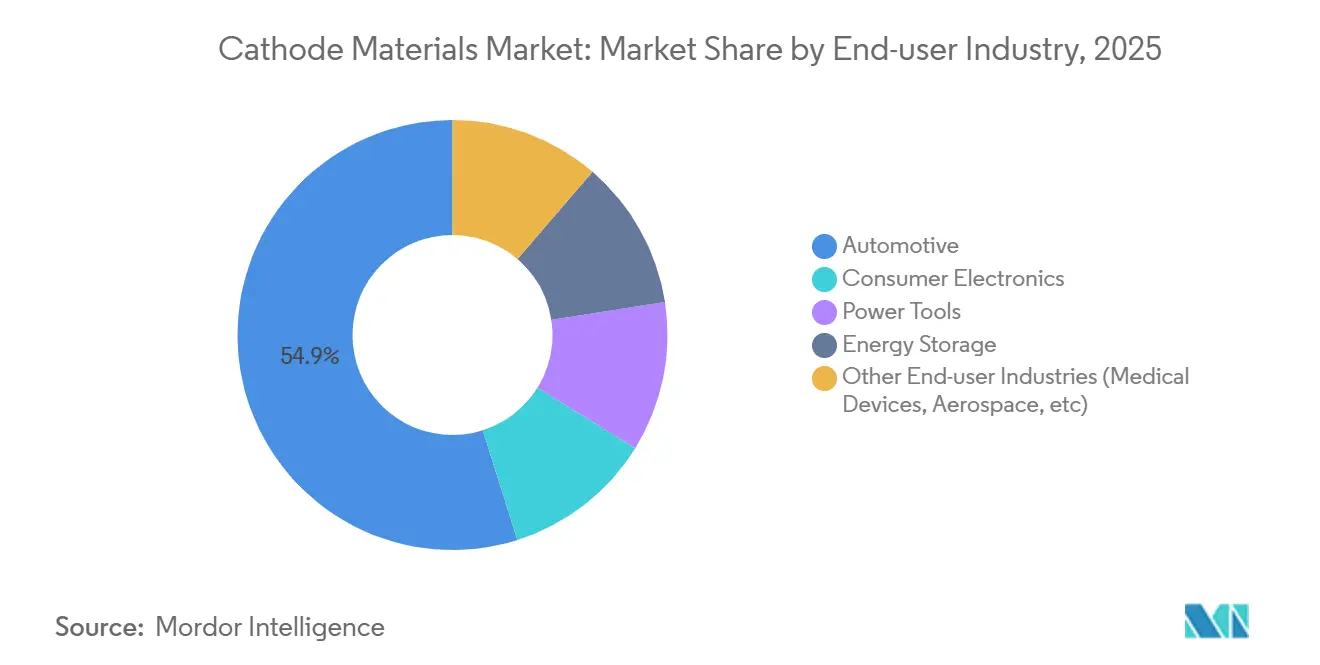
- By end-user industry, automotive held 54.90% volume share in 2025 and is advancing at a 25.18% CAGR through 2031.
- By geography, Asia-Pacific captured 79.10% of 2025 tonnage and is set to expand at a 26.34% CAGR through 2031.
Note: Market size and forecast figures in this report are generated using Mordor Intelligence’s proprietary estimation framework, updated with the latest available data and insights as of 2026.
Global Cathode Materials Market Trends and Insights
Drivers Impact Analysis*
| Driver | (~) % Impact on CAGR Forecast | Geographic Relevance | Impact Timeline |
|---|---|---|---|
| Surging EV Production Volumes | +6.8% | Global, with concentration in China, EU, and North America | Medium term (2-4 years) |
| Government Incentives and Emissions Regulations | +4.3% | North America, EU, China, India | Short term (≤ 2 years) |
| Battery-Pack Cost Decline from Scale Learning | +3.6% | Global, led by Asia-Pacific manufacturing hubs | Long term (≥ 4 years) |
| Localization of Cathode Supply Chains in US and EU | +2.9% | North America, EU | Medium term (2-4 years) |
| Sodium-Ion and LMFP Commercialization Expanding Demand | +2.4% | APAC core, spill-over to emerging markets | Long term (≥ 4 years) |
| Source: Mordor Intelligence | |||
Surging EV Production Volumes
Global electric-vehicle output climbed to 13.8 million units in 2025 and is predicted to exceed 22 million by 2028, a trajectory that lifts cathode demand because every 60 kWh pack embeds 8–12 kg of active material. BYD plans to double 2024 volumes by manufacturing 4 million plug-ins in 2026, underscoring scale expansion across Asia. The switch to larger-format cells such as CATL’s Qilin increases cathode loading per vehicle by thickening electrode coatings. Fleet electrification adds another layer, illustrated by UPS ordering 10,000 LFP-powered delivery vans in 2025. Commercial-vehicle duty cycles favor LFP longevity, providing counter-cyclical stability for the cathode materials market.
Government Incentives and Emissions Regulations
Section 45X of the U.S. Inflation Reduction Act grants USD 10 per kilowatt-hour for domestic cells and USD 45 for modules, triggering 18 U.S. gigafactory announcements totaling 550 GWh of capacity[1]U.S. Department of Energy, “Inflation Reduction Act Fact Sheet,” energy.gov . In Europe, the Battery Regulation mandates carbon-footprint declarations by 2027 and tightens thresholds by 2030, advantaging cathode plants tied to renewable power such as Umicore’s Nysa site, which sources 80% wind energy. China extended new-energy vehicle purchase-tax exemptions to 2027, sustaining demand in the world’s largest EV arena. India’s USD 2.4 billion Production-Linked Incentive for advanced cells lures Reliance Industries and Rajesh Exports, positioning South Asia as a new pole of cathode consumption.
Battery-Pack Cost Decline from Scale Learning
Average lithium-ion pack prices declined to USD 115/kWh in 2024, driven partly by lower cathode costs that account for up to 40% of a cell’s bill of materials. BASF’s 42,000 t/yr CAM plant in Germany leverages continuous co-precipitation to shave 18% off per-kilogram expense. Logistics efficiencies such as Sumitomo Metal Mining’s dedicated nickel-sulfate carriers cut freight outlays by 12% and cascade through bids on long-term contracts. Once total-cost-of-ownership parity is reached—forecast for Europe in 2027—cathode volumes must triple to satisfy mass-market adoption, expanding the cathode materials market footprint.
Localization of Cathode Supply Chains in US and EU
The U.S. Department of Energy awarded USD 3.5 billion to 25 battery-material projects, including Ascend Elements’ hydro-to-cathode recycling hub in Kentucky and Redwood Materials’ Nevada foil complex. Northvolt’s Ett plant in Sweden sources 60% of its NMC cathode from an adjacent BASF facility, shortening lead times from 12 weeks to 3 weeks. Europe aims for 550 GWh of cell capacity by 2030, translating to 1.1 million tons of cathode demand—eight times current regional output. South Korea classified cathodes as a national strategic technology, unlocking tax credits that pushed POSCO FUTURE M to green-light a 100,000 t/yr plant in Gwangyang.
Restraints Impact Analysis*
| Restraint | (~) % Impact on CAGR Forecast | Geographic Relevance | Impact Timeline |
|---|---|---|---|
| Supply-Chain Concentration in China | -1.9% | Global, acute in North America and EU | Short term (≤ 2 years) |
| Solid-State Batteries Lower Cathode Mass/kWh | -1.4% | Japan, North America, select EU markets | Long term (≥ 4 years) |
| Processing Hurdles for High-Mn Chemistries | -1.2% | Global manufacturing hubs | Medium term (2-4 years) |
| Source: Mordor Intelligence | |||
Supply-Chain Concentration in China
China refined 78% of global lithium hydroxide and 93% of manganese sulfate in 2024, exposing Western automakers to delivery risk when domestic suppliers reprioritize local needs[2]U.S. Geological Survey, “Critical Minerals Outlook 2024,” usgs.gov . Ford postponed its F-150 Lightning extended-range launch by four months in 2024 after a Chinese precursor partner diverted shipments during a lithium shortage. U.S. defense assessments warn that a Taiwan Strait conflict could choke cathode flows, while European players like Volkswagen’s PowerCo rely on China for 82% of NMC precursor. Building a 20 kt/yr precursor plant costs USD 150 million and 30 months, which slows diversification. Compliance with the Uyghur Forced Labor Prevention Act obliges automakers to trace multi-tier suppliers, adding administrative overhead.
Solid-State Batteries Lower Cathode Mass/kWh
QuantumScape’s ceramic-electrolyte cell tolerates 4.5 V operation and trims cathode mass by 28% per kWh, potentially curbing future tonnage if adoption accelerates. Toyota’s prototype delivers 1,200 km of range using only 1.4 kg of cathode per kWh, compared with today’s 2 kg baseline. Even if solid-state captures 15% of EV sales by 2032, cathode demand would fall against a liquid-electrolyte scenario. Manufacturing scale is nascent: Solid Power produced only 15 MWh in 2024, and interfacial resistance remains triple target levels. High capital outlays—USD 800 million for 1 GWh/year—further slow mainstream penetration, but the technology sets a ceiling on long-run cathode materials market volume growth.
*Our forecasts treat driver/restraint impacts as directional, not additive. The impact forecasts reflect baseline growth, mix effects, and variable interactions.
Segment Analysis
By Material: LFP Gains Scale, NMC Retains Premium Position
Lithium iron phosphate accounted for 41.10% of 2025 volume and is anticipated to expand at 24.97% through 2031, reflecting Tesla and BYD adoptions that eliminated cobalt and nickel from mass-market models. BYD’s Blade pack narrowed the energy-density gap with NMC 622 to 15%, supporting broader acceptance. Premium brands still specify high-nickel NMC: BMW’s Neue Klasse uses NMC 811 at 285 Wh/kg, positioning the chemistry where 500-km range is non-negotiable. Lithium-nickel-cobalt-aluminum holds niche but profitable ground in long-range packs, although sliding cobalt prices erode its margin advantage. Lead dioxide continues in starter batteries yet will cede share as 12-V lithium replacements scale. Sodium iron phosphate’s slice will rise as sodium-ion cars launch in price-sensitive Asian markets, broadening the cathode materials market canvas.


By Battery Type: Lithium-Ion Dominance, Sodium-Ion Acceleration
Lithium-ion represented 88.20% of cathode demand in 2025 and are growing at 25.62% CAGR as grid storage layers onto automotive deployments. Tesla installed 3.9 GWh of Megapacks in 2024, underpinning LFP’s role in long-duration storage. Lead-acid retained a moderate share for SLI and telecom but faces a mild-hybrid transition to lithium variants. Sodium-ion demand is growing as CATL’s 160 Wh/kg cells find homes in city cars and data-center UPS. Flow batteries occupy a niche share but remain essential for 8+-hour storage, aligning with long-duration mandates in California. This diversification keeps the cathode materials market resilient against single-technology disruption.
By End-user Industry: Automotive Transformation Drives Growth
Automotive consumed 54.90% of tonnage in 2025 and will grow at 25.18% as Euro 7 effectively bans diesel passenger cars and U.S. CAFE rules tighten. GM’s zero-emission pledge implies 1.2 million tons of annual cathode at full scale, reinforcing automaker pull-through. Energy-storage is also advancing as utilities deploy batteries to firm renewables and arbitrage peak-off-peak spreads. Consumer electronics keeps a moderate share on larger smartphone batteries, while power tools and specialty medical segments round out demand. These diversified outlets insulate the cathode materials market from any single-sector slowdown.
Geography Analysis
Asia-Pacific commanded 79.10% of the market share in 2025 and is on a 26.34% CAGR trajectory to 2031, reflecting deep integration across mining, processing, and cell manufacturing. China anchors this ecosystem through cost advantages and proprietary process expertise, enabling sustained innovation velocity. South Korea and Japan provide complementary high-precision manufacturing and advanced material formulations, reinforcing regional dominance. Indonesia’s USD 15 billion in smelting investment and Vietnam’s decade-long tax holidays ensure Southeast Asia doubles as both precursor and assembly hub, reinforcing the cathode materials market’s eastward gravity.
North America demand is also growing on the back of Section 45X credits that de-risk domestic plants. The United States production is supported by BASF Ohio and Albemarle Kings Mountain, with Canadian capacity tripling once POSCO FUTURE M and Talon Metals commission assets. Mexico’s USD 2 billion influx from Ganfeng and Tianqi creates a near-shoring corridor that meets USMCA thresholds. These moves shrink delivery times and diversify the cathode materials market supply chain beyond Asia.
Europe is also rising as the European Battery Alliance bankrolls local output. Germany’s production in 2024 climbed with BASF Schwarzheide and Umicore Nysa, while the U.K. rebooted via Tata Chemicals’ 40,000 t/yr LFP project to serve JLR. South America’s lithium-rich Chile and Argentina export hydroxide feeding 22,000 tons of cathode precursor, and Morocco’s Bou-Azzer mine supplies cobalt sulfate to European sites. Middle-East and Africa hold lower share but own strategic raw materials that could reposition them as precursor exporters. Collectively, geographic diversification sustains the cathode materials market against regional shocks.

Competitive Landscape
The cathode materials market shows moderate concentration: CATL, LG Chem, POSCO FUTURE M, Umicore, and BASF together held about 52% capacity in 2025, leaving room for mid-tier challengers. Competitive strategy has shifted from volume to vertical integration, typified by CATL’s 10-year LFP license-plus-supply deal with Ford that locks in 120,000 t/yr. LG Chem’s stake in Liontown, plus downstream hydroxide and CAM expansions, captures value across every step. Recycling emerges as a cost-advantaged wedge; Redwood Materials recovers 95% of critical metals and re-sells precursor 20% below virgin benchmarks, enabling cell makers to meet low-carbon requirements while preserving margins.
Technology differentiation is equally important. BASF’s cobalt-free NMC with aluminum-titanium dopants, Ecopro BM’s radial-grain single-crystal NMC, and Mitra Chem’s iron-manganese-phosphate pilots illustrate the sprint toward cobalt elimination, high-voltage tolerance, and cost efficiency. Standards such as forthcoming IEC 62660-3 purity specifications will raise compliance costs and potentially disqualify non-aligned suppliers. Overall, incumbents protect share through feedstock security and R&D velocity, while startups exploit chemistry white space to penetrate the cathode materials market.
Cathode Materials Industry Leaders
BASF
LG Chem
Umicore
POSCO FUTURE M
Contemporary Amperex Technology Co., Limited
- *Disclaimer: Major Players sorted in no particular order

Recent Industry Developments
- October 2025: Sumitomo Metal Mining Co., Ltd. and Toyota Motor Corporation entered into a joint development agreement to enable the mass production of cathode materials for all-solid-state batteries intended for use in battery electric vehicles (BEVs). Toyota planned to launch BEVs equipped with all-solid-state batteries between 2027 and 2028.
- September 2025: POSCO FUTURE M expanded its cathode material portfolio to cater to the premium, standard, and entry-level segments of the electric vehicle (EV) market. The company successfully completed pilot development of ultra-high-nickel cathode materials for premium EVs, as well as high-voltage mid-nickel cathode materials.


Global Cathode Materials Market Report Scope
Cathode materials serve as the positive electrode in electrochemical devices like batteries, where they gain electrons during discharge. They significantly impact a battery’s energy density, voltage, and overall efficiency. Examples include lithium cobalt oxide (LiCoO₂), lithium iron phosphate (LiFePO₄), and nickel-manganese-cobalt (NMC) oxides, each offering unique trade-offs in capacity, stability, and cost.
The cathode materials market is segmented by material, battery type, end-user industry, and geography. By material, the market is segmented into lithium iron phosphate, lithium cobalt oxide, lithium-nickel manganese cobalt, lithium manganese oxide, lithium nickel cobalt aluminium oxide, lead dioxide, and other materials (sodium iron phosphate, oxyhydroxide, and graphite). By battery type, the market is segmented into lithium-ion, lead-acid, sodium-ion, and flow batteries. By end-user industry, the market is segmented into automotive, consumer electronics, power tools, energy storage, and other applications (medical devices, aerospace components, etc.). The report also covers the market size and forecasts for the cathode materials in 22 countries across major regions. For each segment, the market sizing and forecasts have been done on the basis of volume (Tons).
| Lithium Iron Phosphate |
| Lithium Cobalt Oxide |
| Lithium-Nickel Manganese Cobalt |
| Lithium Manganese Oxide |
| Lithium Nickel Cobalt Aluminium Oxide |
| Lead Dioxide |
| Other Materials (Sodium Iron Phosphate, Oxyhydroxide, and Graphite) |
| Lithium-Ion |
| Lead-Acid |
| Sodium-ion |
| Flow batteries |
| Automotive |
| Consumer Electronics |
| Power Tools |
| Energy Storage |
| Other End-user Industries (Medical Devices, Aerospace, etc) |
| Asia-Pacific | China |
| Japan | |
| South Korea | |
| India | |
| Indonesia | |
| Vietnam | |
| Thailand | |
| Malaysia | |
| Rest of Asia-Pacific | |
| North America | United States |
| Canada | |
| Mexico | |
| Europe | Germany |
| United Kingdom | |
| France | |
| Italy | |
| Spain | |
| NORDIC Countries | |
| Turkey | |
| Russia | |
| Rest of Europe | |
| South America | Brazil |
| Argentina | |
| Rest of South America | |
| Middle-East and Africa | Saudi Arabia |
| South Africa | |
| Rest of Middle-East and Africa |
| By Material | Lithium Iron Phosphate | |
| Lithium Cobalt Oxide | ||
| Lithium-Nickel Manganese Cobalt | ||
| Lithium Manganese Oxide | ||
| Lithium Nickel Cobalt Aluminium Oxide | ||
| Lead Dioxide | ||
| Other Materials (Sodium Iron Phosphate, Oxyhydroxide, and Graphite) | ||
| By Battery Type | Lithium-Ion | |
| Lead-Acid | ||
| Sodium-ion | ||
| Flow batteries | ||
| By End-user Industry | Automotive | |
| Consumer Electronics | ||
| Power Tools | ||
| Energy Storage | ||
| Other End-user Industries (Medical Devices, Aerospace, etc) | ||
| By Geography | Asia-Pacific | China |
| Japan | ||
| South Korea | ||
| India | ||
| Indonesia | ||
| Vietnam | ||
| Thailand | ||
| Malaysia | ||
| Rest of Asia-Pacific | ||
| North America | United States | |
| Canada | ||
| Mexico | ||
| Europe | Germany | |
| United Kingdom | ||
| France | ||
| Italy | ||
| Spain | ||
| NORDIC Countries | ||
| Turkey | ||
| Russia | ||
| Rest of Europe | ||
| South America | Brazil | |
| Argentina | ||
| Rest of South America | ||
| Middle-East and Africa | Saudi Arabia | |
| South Africa | ||
| Rest of Middle-East and Africa | ||


Key Questions Answered in the Report
What CAGR is projected for global cathode demand between 2026 and 2031?
The cathode materials market is forecast to grow at a 24.15% CAGR over 2026-2031, and reach 14.32 million tons by 2031 growing from 4.85 million tons in 2026.
Which chemistry will lead volume growth through 2031?
Lithium iron phosphate is set to expand at 24.97% CAGR, the quickest among all material types.
How will regional supply diversify beyond Asia?
North America and Europe are adding more than 500 GWh of cell capacity backed by Section 45X and EU Battery Regulation incentives, underpinning new cathode plants in the United States, Canada, Sweden, and Poland.
How concentrated is supplier power today?
The top five producers hold about 52% of global capacity, reflecting moderate concentration and leaving room for mid-tier and recycling-based entrants.
Page last updated on:


