
Market Overview
| Study Period | 2020 - 2031 |
|---|---|
| Market Size (2026) | USD 46.16 Billion |
| Market Size (2031) | USD 63.19 Billion |
| Growth Rate (2026 - 2031) | 6.48 % |
| Fastest Growing Market | Asia Pacific |
| Largest Market | North America |
| Market Concentration | Medium |
Major Players *Disclaimer: Major Players sorted in no particular order Image © Mordor Intelligence. Reuse requires attribution under CC BY 4.0. | |
Oil & Gas Automation Market Analysis by Mordor Intelligence
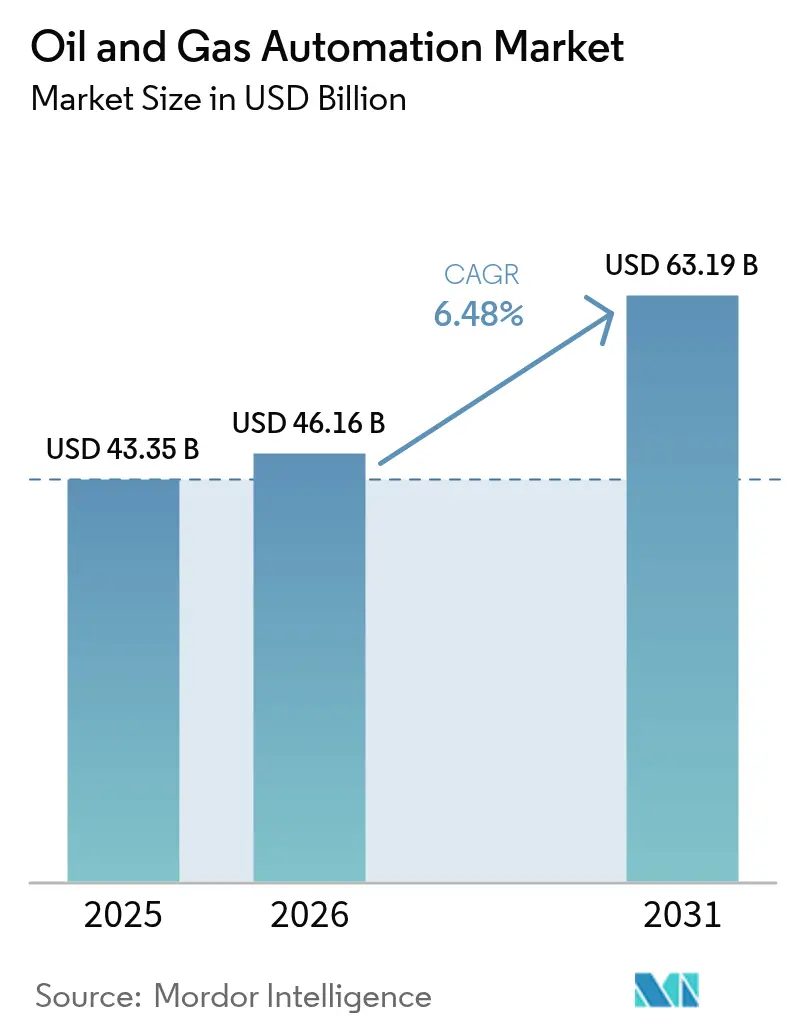
The oil & gas automation market size was valued at USD 43.35 billion in 2025 and estimated to grow from USD 46.16 billion in 2026 to reach USD 63.19 billion by 2031, at a CAGR of 6.48% during the forecast period (2026-2031). Operators are embracing intelligent field platforms, edge-AI analytics, and autonomous inspection tools to curb downtime and lift productivity as supply chains tighten and energy transition goals intensify. Mandatory safety regulations, especially those aligned with IEC 61511 and ISA-84, are accelerating uptake of Safety Instrumented Systems that respond to hazards in milliseconds. LNG infrastructure expansion across Asia-Pacific and Africa is unlocking new demand for cryogenic-grade control systems that handle high-pressure, −160 °C environments. Finally, growing cybersecurity budgets—now 15-20% of total automation spend—are reshaping project economics as operators harden operational technology (OT) environments against ransomware and state-sponsored attacks.
Key Report Takeaways
- By component, software held 66.12% of the oil & gas automation market share in 2025, while services are forecast to grow at an 8.12% CAGR through 2031.
- By process, upstream operations accounted for 58.55% of revenue in 2025; midstream activities are projected to expand at an 7.98% CAGR as LNG terminals proliferate.
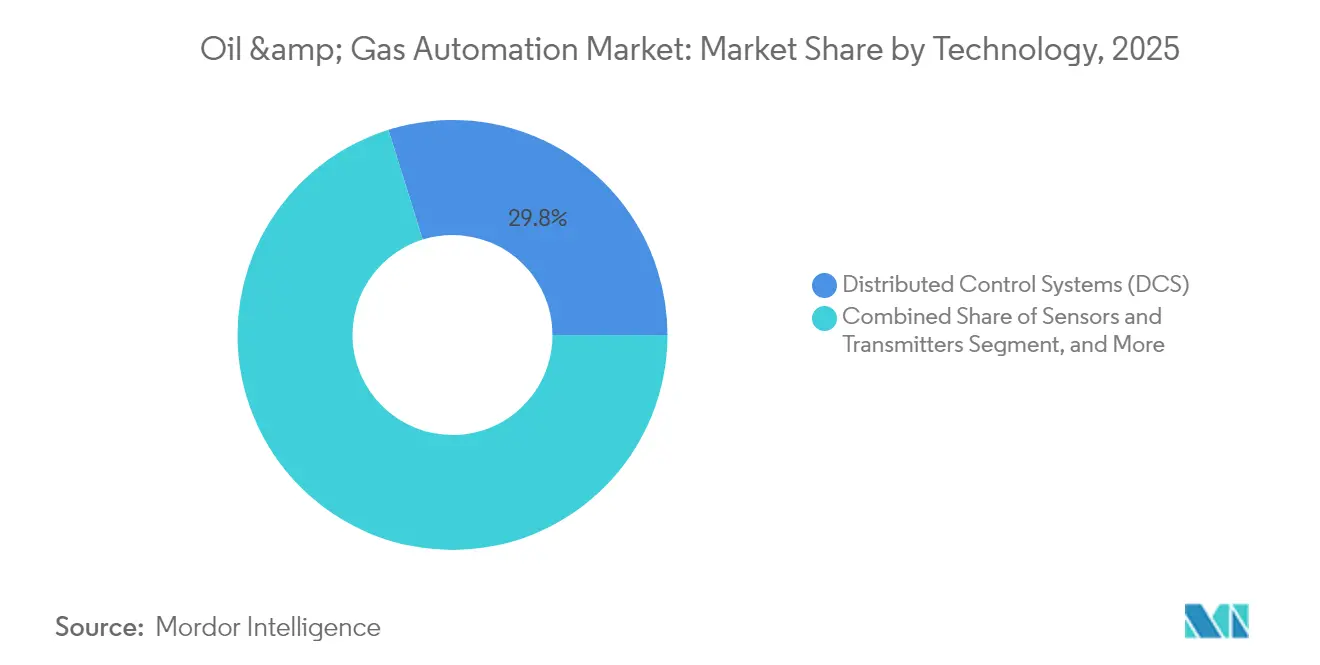
- By technology, Distributed Control Systems retained 29.82% share of the oil & gas automation market size in 2025, whereas SCADA platforms are rising at a 6.62% CAGR.
- By application, production and well optimisation captured 37.74% share in 2025; LNG terminals and storage facilities are advancing at a 7.46% CAGR to 2031.
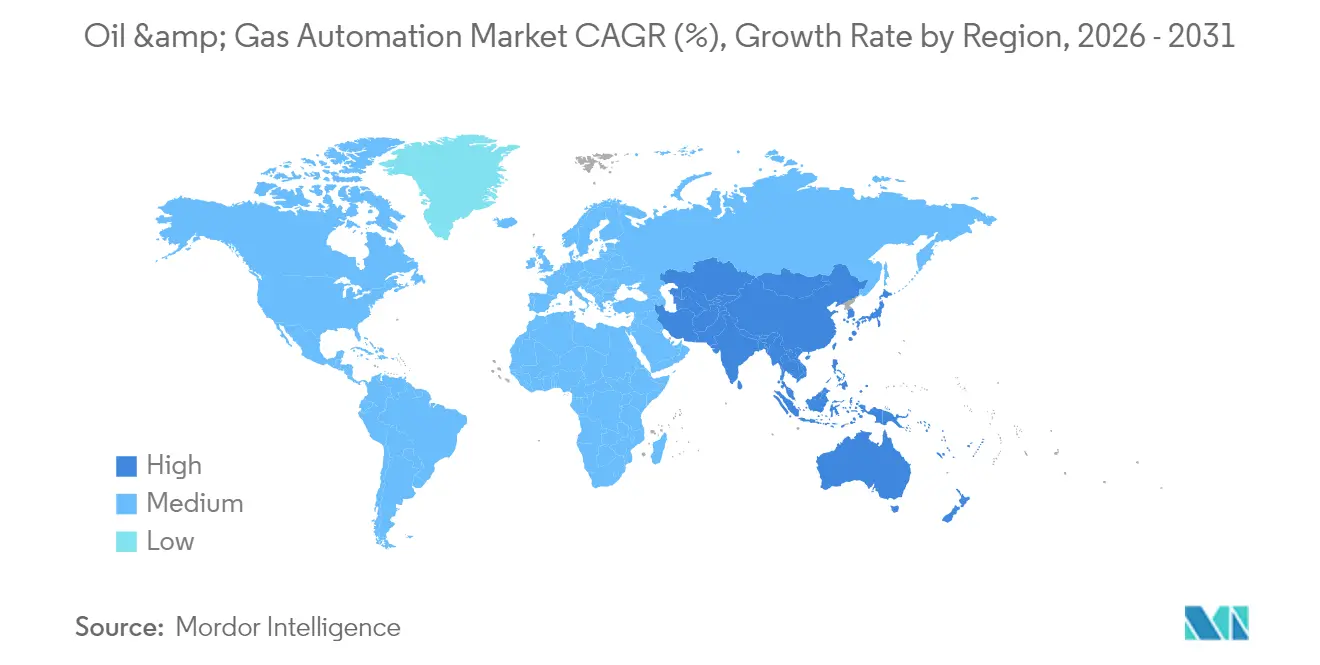
- By geography, North America led with 36.62% of market revenue in 2025; Asia-Pacific is set to grow the fastest at 7.12% CAGR on the back of refinery modernisation and upstream digitisation.
Note: Market size and forecast figures in this report are generated using Mordor Intelligence’s proprietary estimation framework, updated with the latest available data and insights as of 2026.
Global Oil & Gas Automation Market Trends and Insights
Drivers Impact Analysis*
| Driver | (~) % Impact on CAGR Forecast | Geographic Relevance | Impact Timeline |
|---|---|---|---|
| Rising adoption of digital-oilfield platforms | +1.2% | Global, with early gains in North America, Middle East | Medium term (2-4 years) |
| Modernization CAPEX for remote monitoring and predictive maintenance | +1.8% | North America and EU, APAC core | Long term (≥ 4 years) |
| Mandatory safety-system regulations | +1.0% | Global, with stringent enforcement in North America, Europe | Short term (≤ 2 years) |
| LNG and mid-stream build-out in APAC and Africa | +1.5% | APAC core, spill-over to MEA | Medium term (2-4 years) |
| Edge-AI deployment for real-time analytics at hazardous sites | +0.9% | Global, with concentration in offshore operations | Long term (≥ 4 years) |
| Autonomous inspection drones and robotics for offshore assets | +0.8% | Global offshore regions, North Sea, Gulf of Mexico, APAC | Medium term (2-4 years) |
| Source: Mordor Intelligence | |||
Rising Adoption of Digital-Oilfield Platforms
Real-time digital platforms fuse IoT sensors, machine-learning models, and cloud analytics into unified dashboards that shorten decision cycles from minutes to seconds. Devon Energy lifted well longevity by 25% after deploying AI-guided drilling adjustments. Virtual twins synchronised with live operating data let engineers test scenarios without risking physical assets, an approach that is especially potent in unconventional reservoirs where downhole conditions vary by the hour.
Modernisation CAPEX for Remote Monitoring and Predictive Maintenance
Operators are redirecting capital toward remote surveillance tools that cut site visits and shrink safety exposure. Enbridge’s Azure-based pipeline analytics improved threat detection by 30%[1]Enbridge, “AI ROW Threat Identification System,” enbridge.com. Predictive algorithms study vibration and thermal trends to spot failures weeks in advance, trimming routine inspection costs up to 50% while boosting reliability.
Mandatory Safety-System Regulations
IEC 61511 compliance is driving rapid deployment of automated shutdown layers that outperform human reaction times. The PHMSA control-room rules, paired with Europe’s NIS 2.0 cybersecurity directive, oblige operators to document risk reduction and install redundant logic solvers that isolate faults without process disruption.
LNG and Mid-Stream Build-Out in Asia-Pacific and Africa
Projected 40% growth in Asia-Pacific LNG import capacity is pushing demand for automation that can handle extreme cryogenic conditions. Emerson’s DeltaV platform underpins several 10 Mtpa projects, balancing −160 °C temperature swings while optimising energy consumption by up to 5% through AI-driven tuning.
Restraints Impact Analysis*
| Restraint | (~) % Impact on CAGR Forecast | Geographic Relevance | Impact Timeline |
|---|---|---|---|
| Crude-oil price volatility impacting OPEX and CAPEX cycles | -1.5% | Global, with acute impact in North America | Short term (≤ 2 years) |
| Escalating cyber-risk and OT-security compliance costs | -0.8% | Global, with stringent requirements in North America, Europe | Medium term (2-4 years) |
| High upfront automation expenditure and ROI uncertainty | -1.2% | Global, particularly affecting smaller operators | Long term (≥ 4 years) |
| Legacy-system interoperability | -0.6% | Global, with concentration in mature oil regions | Medium term (2-4 years) |
| Source: Mordor Intelligence | |||
Crude-Oil Price Volatility Impacting OPEX and CAPEX Cycles
Six-month lags between crude swings and spending shifts force smaller producers to delay automation upgrades when cash flows tighten. Subscription-based automation services that align fees with production volumes are gaining favour because they lower upfront risk and preserve liquidity during downturns.
Escalating Cyber-Risk and OT-Security Compliance Costs
Following the Colonial Pipeline incident, security spending now consumes up to one-fifth of automation budgets. Air-gapped architectures, zero-trust networks, and 24-hour threat monitoring inflate life-cycle costs and prolong project timelines in regions under strict critical-infrastructure rules.
*Our forecasts treat driver/restraint impacts as directional, not additive. The impact forecasts reflect baseline growth, mix effects, and variable interactions.
Segment Analysis
By Component: Software Leadership Drives Service Innovation
Software captured 66.12% of 2025 revenue, anchoring the oil & gas automation market through analytics engines that power predictive maintenance and autonomous operations. In value terms, the component accounted for USD 28.66 billion of the oil & gas automation market size in 2025. Services, although smaller, are projected for an 8.12% CAGR as operators outsource AI configuration and cybersecurity hardening.
Software growth is reinforced by edge-AI packages that lift drilling rates of penetration by 35-45%. Meanwhile, service contracts that bundle 24-hour monitoring and outcome-based guarantees move providers from product suppliers to performance partners. Hardware remains essential for sensor grids and ruggedised edge devices; however, its share is expected to decline gradually as virtualised control logic migrates to software layers.




By Process: Upstream Dominance Meets Midstream Acceleration
Upstream activities generated 58.55% of 2025 process revenue as autonomous drilling and production optimisation platforms calibrated thousands of downhole parameters at shale wells. This translated to roughly USD 25.38 billion of the oil & gas automation market size. Midstream operations, while holding a smaller base, are growing at 7.98% CAGR due to global LNG terminal build-outs and pipeline digitisation.
Upstream players like SLB demonstrated 25 automatic geosteering corrections on a single lateral, signalling a shift toward fully autonomous rigs. For midstream firms, cloud-linked SCADA systems enable real-time leak detection and remote valve actuation across thousands of kilometres, reducing incident response time from hours to minutes. Downstream sites are piloting AI-directed distillation columns that cut energy use and trim emissions.
By Technology: DCS Stability Anchors SCADA Innovation
Distributed Control Systems remained the backbone of complex refining and LNG trains, controlling 29.82% of technology-based revenue in 2025. SCADA, however, is the fastest climber at 6.62% CAGR as pipeline operators adopt satellite-enabled remote monitoring for widely dispersed assets.
Honeywell’s Experion PKS exemplifies convergence by embedding AI decision support inside a classic DCS framework. PLCs continue to govern high-speed, deterministic tasks such as blowout preventer actuation, while Safety Instrumented Systems provide independent protective layers meeting SIL-3 mandates. Intelligent sensors now integrate edge compute boards, turning field devices into micro-decision nodes that pre-filter data before dispatch to a central historian.
By Application: Production Optimisation Leads LNG Terminal Surge
Production and well optimisation retained 37.74% share in 2025, representing USD 16.36 billion of the oil & gas automation market size. AI-driven artificial-lift management raised ExxonMobil’s output by 2.2% across 1,300 wells. LNG terminals and storage facilities, although smaller today, are on track for 7.46% CAGR as governments lock in flexible gas supply and mandate cryogenic-grade automation.
Drilling applications benefit from real-time downhole analytics that steer bits through productive zones, while pipeline operators deploy fibre-optic sensing for predictive leak detection. Refining assets are testing closed-loop AI controllers that adjust 13 valves simultaneously, a milestone achieved during continuous autonomous distillation at Eneos Kawasaki refinery.
Geography Analysis
North America led the oil & gas automation market with 36.62% revenue share in 2025, buoyed by shale developers that pioneered AI-steered drilling and pad optimisation. Persistent learn-and-apply cycles keep regional productivity high even when rig counts fluctuate. The region’s cybersecurity posture is also mature, with operators adopting zero-trust OT frameworks mandated by federal guidelines.
Asia-Pacific is poised for a 7.12% CAGR through 2031. China is modernising refineries to produce cleaner fuels, while India accelerates upstream digitisation across deep-water blocks. Massive LNG import projects in Southeast Asia rely on AI-enabled cryogenic controls to secure supply and balance power grids with intermittent renewables. Governments support digital twins to curb emissions and enhance safety, propelling technology adoption.
Europe maintains steady spending under stringent safety and environmental regulations. New LNG regasification units in Germany and Finland integrate DCS platforms that meet SIL-3 safety layers and NIS 2.0 cybersecurity mandates. Middle Eastern national oil companies, supported by sovereign funds, scale AI-driven well monitoring across mature carbonate reservoirs, exemplified by ADNOC’s USD 920 million ENERGYai program. Africa and South America remain emerging adopters, often leveraging joint-venture partners for technology transfer and financing.

Regulatory Landscape
Safety, emissions, and cybersecurity requirements continue to shape automation specifications across upstream, midstream, and downstream assets. Functional safety expectations anchored in IEC 61511 and ISA-84 support demand for Safety Instrumented Systems (SIS) and independent protection layers, while OT security programs increasingly reference industrial cybersecurity practices aligned with ISA/IEC 62443 for industrial automation and control systems.
In the United States, April 2026 EPA actions under the National Emission Standards for Hazardous Air Pollutants (NESHAP) for crude oil and natural gas production increased focus on monitoring and documenting emission points. This raises the role of automated sensing, data capture, and reporting in environmental compliance. On the cyber side, the US Department of Energy (CESER) continued energy security exercises in 2026 focused on cyber and physical threats to energy infrastructure. March 2026 legislative activity (H.R. 7272) targeted formalizing a program for pipeline and LNG facility security under the Secretary of Energy, reinforcing the need for hardened SCADA, secure remote operations, and auditable controls.
Value Chain Analysis
The oil and gas automation value chain spans field and plant instrumentation (sensors, transmitters, analyzers), control and safety layers (PLC, DCS, SIS, SCADA), industrial networks and edge compute, and application software (APM, APC, historians, digital twins), followed by integration, commissioning, and lifecycle services (maintenance, cybersecurity, performance optimization). Large suppliers such as ABB, Honeywell, Siemens, and Emerson anchor installed-base upgrades, while oilfield service firms and AI-native software vendors contribute domain analytics, closed-loop automation, and remote-operations capabilities.
Integration and services remain central bottlenecks and value pools due to brownfield interoperability, cybersecurity hardening, and data-model alignment across upstream, midstream, and downstream operations. The shift from standalone controls to end-to-end optimization is visible in May 2026, when Phillips 66 commissioned Advanced Process Control at its Coastal Bend facility as part of a digital optimization effort tied to higher NGL processing throughput. Enterprise planning and logistics digitization programs, including SAP Integrated Business Planning deployments and multi-agent procurement optimization initiatives, also show how supply-chain and operations data are being connected to automation KPIs to reduce inventory, shorten cycle times, and improve asset utilization.
Competitive Landscape
Market concentration is moderate as four global automation majors—ABB, Honeywell, Siemens, and Emerson—provide end-to-end portfolios covering sensors, control systems, and lifecycle services[3]Honeywell, “Experion PKS with AI-Driven Decision Support,” honeywell.com. Their installed bases and worldwide service networks create high switching costs for brownfield upgrades.
Disruption comes from AI-native firms such as Corva, Agora, and Sensia, which specialise in edge-based analytics, autonomous drilling, and real-time production optimisation. These players often partner with incumbents; Honeywell and Chevron co-developed AI advisory tools for refineries, while Enbridge teamed with Microsoft to launch AI-powered threat detection for pipelines.
Oilfield service giants—SLB, Baker Hughes, and Halliburton—are folding proprietary automation suites into drilling and completions offerings. SLB’s Neuro geosteering technology autonomously executed 25 trajectory changes in Ecuador, signalling that algorithms can now assume complex directional decisions. White-space opportunities persist in autonomous robotics, OT cybersecurity, and outcome-based contracting, allowing niche specialists to carve out defensible positions even as consolidation accelerates.
Oil & Gas Automation Industry Leaders
ABB Ltd
Honeywell International Inc
Rockwell Automation Inc
Mitsubishi Corporation
Schneider Electric SE
- *Disclaimer: Major Players sorted in no particular order


Market Opportunities and Future Outlook
Closed-loop and autonomous operations represent a clear whitespace as operators move beyond advisory analytics into automated decision and execution across drilling, placement, and production optimization. In March 2026, ExxonMobil and Halliburton reported fully closed-loop automated geological well placement offshore Guyana. In July 2026, Halliburton and Eni disclosed deployment of LOGIX automation and remote operations on a deepwater exploration well offshore Indonesia. These deployments broaden the addressable scope for vendors that can combine controls (DCS/PLC/SIS), OT cybersecurity, and domain AI into certifiable workflows.
LNG and electrified process facilities continue to create opportunities for integrated automation and electrical control, particularly for large, multi-train projects that standardize platforms across phases. Yokogawa being selected as main automation contractor for the Commonwealth LNG project in Louisiana (reported in July 2026) and ABB receiving additional orders for Rio Grande LNG Trains 4 and 5 (announced March 2026) point to sustained demand for ICSS, advanced monitoring, and lifecycle services tied to newbuild and expansion programs. Saudi Aramco also published results from its USD 1 billion upstream AI program in April 2026, providing an ROI reference point that supports broader procurement of AI-enabled optimization, integrity monitoring, and emissions-aware automation across large asset portfolios.
Recent Industry Developments
- April 2026: Honeywell announced it would provide connected services, advanced digital performance monitoring, and operator training using the Honeywell Forge platform for the Dangote Petroleum Refinery in Nigeria. The scope elevates refinery automation from basic control to continuous performance management, strengthening Honeywell's software and services attach in large-scale downstream assets.
- November 2025: Honeywell and TotalEnergies announced a pilot of the AI-assisted Experion Operations Assistant at the Port Arthur Refinery in Texas. The pilot moves AI closer to the control room workflow, supporting higher-value DCS upgrades and creating a template for scalable industrial autonomy programs in refining.
- December 2024: ABB signed a five-year global framework agreement with bp to supply automation, electrical, and telecommunications equipment across upstream and downstream facilities. Standardizing equipment and support across a global portfolio reduces integration friction in brownfield upgrades and reinforces long-term installed-base advantages for platform vendors.


Research Methodology Framework and Report Scope
Market Definition and Coverage
This market covers automation used to monitor, control, and optimize oil and gas operations across upstream, midstream, and downstream sites, using industrial control hardware, software, and related services that enable safer and more efficient production.
Scope exclusions: We exclude general IT outsourcing and non-industrial office automation that does not directly support field, plant, or pipeline control and monitoring.
Segmentation Overview
- By Component
- Hardware
- Software
- Services
- By Process
- Upstream
- Midstream
- Downstream
- By Technology
- Sensors and Transmitters
- Distributed Control Systems (DCS)
- Programmable Logic Controllers (PLC)
- Supervisory Control and Data Acquisition (SCADA)
- Safety Instrumented Systems (SIS)
- Other Technologies
- By Application
- Drilling and Completion
- Production and Well Optimization
- Pipeline and Transportation
- Refining and Petrochemicals
- LNG Terminals and Storage
- By Geography
- North America
- United States
- Canada
- Mexico
- Europe
- Germany
- United Kingdom
- France
- Italy
- Spain
- Rest of Europe
- Asia-Pacific
- China
- Japan
- India
- South Korea
- Australia
- Rest of Asia-Pacific
- South America
- Brazil
- Argentina
- Rest of South America
- Middle East and Africa
- Middle East
- Saudi Arabia
- United Arab Emirates
- Turkey
- Rest of Middle East
- Africa
- South Africa
- Egypt
- Nigeria
- Rest of Africa
- Middle East
- North America
Data Sources, Market Sizing, and Validation
Desk Research
Desk work started by aligning what counts as oil and gas automation, then mapping demand signals across upstream assets, pipelines, and refining sites. We relied on public references such as the US Energy Information Administration for drilling and production indicators, the International Energy Agency for energy investment context, and the US Bureau of Labor Statistics for wage inflation signals that can influence project and service pricing.
To ground the model, we also reviewed sources such as SEC filings, annual reports, and investor presentations to understand the mix of automation hardware, software, and services and how it shifts over time. We used trade and customs releases where available to sanity check equipment movement, and peer-reviewed journals plus standards and safety publications to validate typical system architecture and reliability requirements. Patent databases were reviewed to see where sensing, control, and optimization innovation is concentrating, and a paid subscription covering company financials and news helped with cross-checking reported revenue splits and project timelines. These desk sources are illustrative only, and other references were also used for data collection, validation, and clarification.
Primary Interviews and Surveys
Primary interviews and structured surveys were used to validate adoption levels of control systems and instrumentation across upstream facilities, pipelines, and refineries, then to confirm what is typically procured as hardware, software, and services. We spoke with automation suppliers, system integrators, and oil and gas operator side teams across APAC, EMEA, and the Americas, so assumptions from desk inputs could be corrected when procurement reality differed.
Distribution of primary research fieldwork respondents
| Company type | Respondent position | Region |
|---|---|---|
| Top tier: 37% | CXOs: 14% | APAC: 47% |
| Mid tier: 49% | Functional/Unit leaders: 40% | EMEA: 33% |
| Smaller Players: 14% | Managers: 46% | Americas: 20% |
Market-Sizing & Forecasting
Sizing was built using a top-down and bottom-up approach, where oil and gas activity and investment indicators were first translated into an automation demand pool by process area, then checked against selective supplier and channel approximations. In practice, the top-down logic links upstream, pipeline, and refining project intensity to typical automation content per facility type, which is then split into hardware, software, and services.
Inputs used in the model included active drilling and completion activity, brownfield upgrade intensity, pipeline integrity and monitoring programs, refinery utilization and turnaround cycles, and the shift toward safety instrumented systems and remote monitoring. Where pricing was needed, sampled ASP ranges for controllers, sensors, variable frequency drives, and SCADA-related deployments were taken from interviews and adjusted for service intensity and inflation trends.
For the forecast, scenario analysis was used so our base case could reflect how oil prices, capex discipline, and cybersecurity spending priorities may move together over the next few years. When bottom-up evidence was missing for smaller geographies, gaps were handled by applying validated penetration rates and per-site spend ranges that were confirmed during primary discussions.
Data Validation & Update Cycle
Outputs were cross-checked against independent signals such as automation penetration by process area, public project pipelines, and known replacement cycles for control and instrumentation assets. When the model showed unexpected jumps by region or component, we reviewed the input drivers, then re-checked key assumptions with follow-up expert calls before sign-off.
A second analyst review was applied to confirm arithmetic accuracy, consistent currency treatment, and that segment totals reconcile back to the global number. Reports are refreshed annually, and interim updates are triggered when material events occur, such as major capex resets, regulatory shifts tied to safety systems, or step changes in operator spending. Before delivery, we run a final pass so clients receive an updated view based on the latest available public indicators and fresh primary feedback.
Mordor Intelligence's Oil and Gas Automation Market Size Compared Against Other Published Estimates
Published market sizes for oil and gas automation often do not match because the included solution set, the counted end-use boundary, and the year timing are not always consistent, even when the titles look similar. Differences can also come from how services are treated, how currency conversion timing is handled across regions, and whether the latest project cycle has been reflected or not.
The table shows a wide spread for 2025, and under Mordor Intelligence's scope the value includes upstream, midstream, and downstream automation with components counted across hardware, software, and services, rather than limiting totals to only a narrower set of control solutions. Another common driver is that some figures rely on a single assumed adoption curve for digital oilfield rollouts, while our assumptions were checked against field upgrade cycles, refinery turnaround patterns, and safety system uptake during interviews.
Benchmark comparison
| Source | Market Size | Gaps in Research Methodology |
|---|---|---|
| Mordor Intelligence | USD 43.35 B (2025) | |
| Global Consultancy A | USD 10.43 B (2025) | This estimate appears to define the market as automation solutions only (for example, core systems like SCADA, DCS, PLC, and MES), which can exclude broader instrumentation coverage and portions of implementation and lifecycle services. |
| Trade Journal B | USD 46.16 B (2026) | This figure is stated for a different year, which can shift totals due to capex timing, equipment price updates, and the currency conversion window used for regional rollups. |
Taken together, the gap is mainly explained by scope narrowing in one case and year alignment in the other, rather than a single input difference. By keeping the sizing steps tied to observable activity drivers and then confirming assumptions in interviews, the final number stays traceable and repeatable for planning use.


Key Questions Answered in the Report
What is the current size of the oil & gas automation market?
The oil & gas automation market size reached USD 46.16 billion in 2026 and is forecast to hit USD 63.19 billion by 2031 at a 6.48% CAGR.
Which component leads the oil & gas automation market?
Software leads with 66.12% market share, driven by AI analytics and real-time optimisation platforms.
Why are services growing faster than hardware?
Services are expanding at 8.12% CAGR because operators need specialised integration, cybersecurity, and continuous optimisation support for complex AI deployments.
Which region is growing the fastest?
Asia-Pacific is projected to grow at 7.12% CAGR owing to aggressive LNG infrastructure expansion and refinery modernisation initiatives.
What are the main restraints on market growth?
Crude-price volatility that delays CAPEX cycles and escalating cybersecurity compliance costs are the two strongest headwinds, together cutting 2.3 percentage points from the forecast CAGR.
How are autonomous robots used in oil & gas operations?
Operators like TotalEnergies are trialling remotely controlled robots for offshore inspections to cut human exposure and increase inspection frequency, signalling a wider move toward fully autonomous asset management.
Page last updated on:


 Your data is secure and never sold or shared.


