
Environmental Sensors Market Size and Share
Market Overview
| Study Period | 2020 - 2031 |
|---|---|
| Market Size (2026) | USD 2.77 Billion |
| Market Size (2031) | USD 4.49 Billion |
| Growth Rate (2026 - 2031) | 10.16 % |
| Fastest Growing Market | Middle East and Africa |
| Largest Market | Asia |
| Market Concentration | Medium |
Major Players *Disclaimer: Major Players sorted in no particular order Image © Mordor Intelligence. Reuse requires attribution under CC BY 4.0. | |
Environmental Sensors Market Analysis by Mordor Intelligence
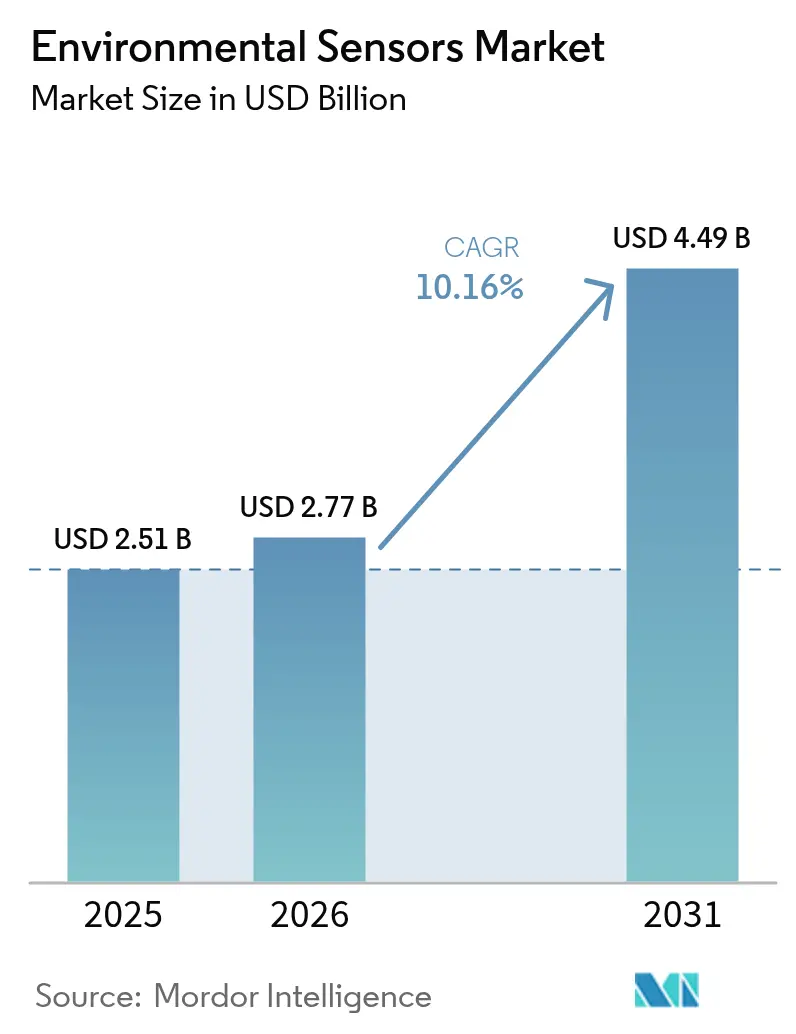
Environmental sensors market size in 2026 is estimated at USD 2.77 billion, growing from 2025 value of USD 2.51 billion with 2031 projections showing USD 4.49 billion, growing at 10.16% CAGR over 2026-2031. This robust outlook reflects intense regulatory pressure, rapid NB-IoT roll-outs, and widening adoption across smart cities, industrial IoT, and consumer wearables. Large accelerated filers in the United States must now disclose Scope 1 and Scope 2 greenhouse-gas emissions with third-party assurance, prompting accelerated sensor deployment for continuous monitoring. In Europe, the revised Ambient Air Quality Directive effective March 2025 forces member states to track ultrafine particles in real time, expanding demand for cost-effective sensor networks. Asia-Pacific leads the environmental sensors market thanks to Chinese NB-IoT infrastructure that supports high-density urban monitoring, while North America drives innovation in wildfire-detection networks and edge-AI platforms. Competitive intensity remains high as semiconductor majors, niche MEMS suppliers, and cloud-native IoT firms race to deliver resilient, cyber-secure, and self-calibrating solutions.
Key Report Takeaways
- By product type, fixed installations held 61.30% of the environmental sensors market share in 2025, whereas portable units are projected to expand at a 12.31% CAGR to 2031.
- By sensing type, gas sensors captured 25.60% revenue share in 2025; particulate matter sensors are forecast to grow at a 12.95% CAGR through 2031.
- By connectivity, wired solutions dominated with 54.30% share of the environmental sensors market size in 2025, while wireless nodes are poised for a 14.20% CAGR between 2026-2031.
- By end-user industry, industrial applications accounted for 23.70% of the environmental sensors market size in 2025; healthcare is advancing at a 13.44% CAGR during the same period.
- By geography, Asia-Pacific commanded 37.60% of the environmental sensors market share in 2025 and is expected to maintain leadership through 2031.
- Bosch Sensortec, Honeywell, and Texas Instruments together controlled nearly 20.85% of global revenue in 2025, anchoring a fragmented supplier landscape.
Note: Market size and forecast figures in this report are generated using Mordor Intelligence’s proprietary estimation framework, updated with the latest available data and insights as of 2026.
Market Trends and Insights
Drivers Impact Analysis of Environmental Sensors Market*
| DRIVER | (~) % IMPACT ON CAGR FORECAST | GEOGRAPHIC RELEVANCE | IMPACT TIMELINE |
|---|---|---|---|
| NB-IoT roll-outs enabling dense urban sensor grids | +1.8% | Asia-Pacific core, spill-over to MEA | Medium term (2-4 years) |
| Stricter EU Ambient Air Quality Directive thresholds | +1.5% | Europe; reference for North America compliance | Short term (≤ 2 years) |
| ESG-linked Scope 1 & 2 disclosure mandates | +2.1% | North America & EU, cascading globally | Short term (≤ 2 years) |
| Multi-parameter modules in wearables & hearables | +1.2% | Global; strongest in developed markets | Medium term (2-4 years) |
| Sensors for green-hydrogen and battery gigafactories | +0.9% | Europe, North America, China | Long term (≥ 4 years) |
| Wildfire early-warning networks in North America | +0.7% | North America; preview for Australia | Short term (≤ 2 years) |
| Source: Mordor Intelligence | |||
Increased NB-IoT Deployments Enabling Dense Urban Sensor Networks (Asia)
Chinese operators now run more than 900 million NB-IoT connections, and expansion plans aim for 1.9 billion by 2030, giving cities like Shenzhen the backbone for block-level air-quality mapping. The low-power wide-area standard supports decade-long battery life, deep-indoor penetration, and licensed-spectrum reliability, letting municipalities blanket high-rise districts without trenching cables. Neighboring economies from Thailand to the UAE mirror this model to accelerate smart-city roll-outs and ESG compliance.[1]RCR Wireless News, “NB-IoT and LoRa crowned kings of IoT – to hit 3.5bn connections by 2030,” rcrwireless.com
Tightening EU Ambient Air-Quality Directive 2023/2119 Standards
The March 2025 directive slices the annual PM2.5 limit from 25 µg/m³ to 10 µg/m³ and mandates ultrafine particle tracking, forcing member states to supplement costly reference stations with dense sensor clusters. Real-time public-data access clauses privilege IoT-ready modules that stream measurements to central dashboards, spurring demand for calibrated MEMS units capable of ±5 µg/m³ accuracy in urban smog.
ESG-Linked Industrial Emissions Disclosure Mandates (SEC, CSRD)
SEC rules effective May 2024 and the EU’s CSRD oblige thousands of issuers to file granular, assurance-verified emission data, moving environmental sensors from discretionary OpEx to compliance essential. Companies retrofit flue-gas stacks, boiler rooms, and fugitive-leak zones with continuous monitoring systems, boosting orders for electrochemical and NDIR gas analyzers qualified for audit-grade reporting.
Adoption of Multi-parameter Sensor Modules in Wearables & Hearables
Bosch Sensortec’s 4.2 × 3.5 × 3 mm BMV080 PM sensor shows that air-quality tracking can hide inside earbuds and smartwatches without battery-life penalties. In-ear positioning enhances signal-to-noise ratios for respiratory metrics, letting consumer brands market personalized exposure insights to allergy and asthma sufferers.[2]Bosch Sensortec, “Bosch particulate matter sensor BMV080,” bosch-sensortec.com
Restraints Impact Analysis of Environmental Sensors Market*
| RESTRAINTS | (~) % IMPACT ON CAGR FORECAST | GEOGRAPHIC RELEVANCE | IMPACT TIMELINE |
|---|---|---|---|
| Calibration drift & high maintenance in harsh climates | −1.4% | Global; acute in deserts & tropics | Medium term (2-4 years) |
| Scarce reference-grade calibration sites in emerging markets | −1.1% | MEA, Latin America, parts of Asia-Pacific | Long term (≥ 4 years) |
| Cyber-security risks in cloud-connected industrial nodes | −0.8% | Global; critical infrastructure hubs | Short term (≤ 2 years) |
| Price erosion from MEMS commoditization | −0.6% | Global; led by Asia-Pacific fabs | Medium term (2-4 years) |
| Source: Mordor Intelligence | |||
Calibration Drift & Maintenance Costs in Harsh Outdoor Environments
Electrochemical sensors deployed in outdoor environments experience significant calibration drift due to temperature fluctuations, humidity variations, and exposure to interfering gases, requiring recalibration intervals as frequent as every 3 months to maintain acceptable accuracy. This maintenance burden creates substantial operational costs that can exceed initial sensor procurement costs within the first year of deployment, particularly in harsh climates where environmental stressors accelerate sensor degradation. Research indicates that over 90% of sensors remain within calibration specifications during routine checks, suggesting that current maintenance schedules are overly conservative but necessary due to the high cost of compliance failures.
Limited Reference-Grade Calibration Infrastructure in Emerging Economies
Emerging economies lack the reference-grade monitoring infrastructure necessary to calibrate low-cost sensor networks, creating a fundamental barrier to accurate environmental monitoring in regions where such data is most critically needed for public health protection. Studies in Kenya and Ghana demonstrate that while low-cost sensors can provide valuable trend information, the absence of nearby reference stations limits their ability to provide quantitative measurements suitable for regulatory compliance or health risk assessment. The spatial mismatch between PM2.5 pollution hotspots and available calibration infrastructure is particularly pronounced in Sub-Saharan Africa and Southeast Asia, where rapid urbanization creates new pollution sources faster than monitoring infrastructure can be established.
*Our forecasts treat driver/restraint impacts as directional, not additive. The impact forecasts reflect baseline growth, mix effects, and variable interactions.
Environmental Sensors Market Segment Analysis
By Product Type:
Fixed Installations Anchor Compliance BudgetsFixed installations dominated the environmental sensors market size with 61.30% revenue in 2025, reflecting plant operators’ need for uninterrupted proof of regulatory conformity. These wall-mounted or duct-inserted probes feed 24/7 data to environmental management systems that auditors rely on for Scope 1 verification. Portable devices, although smaller in volume, are pacing a 12.31% CAGR through 2031 as first-responders, mining firms, and construction consortia favor rapid deployment along shifting work sites. The Department of Homeland Security’s wildfire pilot showed that trailer-mounted PM nodes delivered 30-minute lead times over satellite imagery, validating the business case for mobile grids.
Portables increasingly complement—not replace—fixed arrays. Utilities, for instance, install hard-wired SO₂ stacks for compliance, then wheel battery-powered VOC sniffers during maintenance outages. Wearable units remain nascent but give consumer OEMs a route to health-centric differentiation, bundling pollen counts or pollution alerts into fitness dashboards. Over the forecast cycle, hybrid architectures blending permanent baselines with redeployable clusters will redefine procurement guidelines across the environmental sensors market.




By Sensing Type:
Gas Detection Retains Lead, Particulate Modules SurgeGas analyzers captured 25.60% of environmental sensors market share in 2025 thanks to mature electrochemical cells and NDIR optics that detect CO, NOₓ, and volatile organic compounds in factories, tunnels, and boilers. Particulate-matter devices, however, are charting a 12.95% CAGR as public-health agencies tighten PM2.5 exposure thresholds. Environmental sensors market size for PM instruments is forecast to reach USD 1.16 billion by 2031, buoyed by EU and California mandates demanding 10 µg/m³ annual averages.
Temperature, humidity, and pressure chips remain ubiquitous housekeeping parameters, often bundled with primary gas or PM functions inside multi-parameter modules. Bosch Sensortec’s BME688 unites four physical sensors plus on-board AI inference, slicing bill-of-materials cost by 20% for OEMs that previously bought discrete components. Convergence blurs historical category lines, steering purchasing toward holistic “environment packs” rather than single-parameter parts.
By Connectivity:
Wireless Nodes Redefine Total Cost of OwnershipWired links—RS-485, 4-20 mA, and Ethernet—secured 54.30% revenue in 2025 as petrochemical and power stations trust deterministic protocols immune to RF interference. Yet wireless shipments will grow at 14.20% CAGR, narrowing the share gap by 2031. Each wireless node trims install cost by up to 80% when dozens of probes pepper a refinery flare field. NB-IoT in China and LTE-Cat-M in Europe form the backbone, while LoRaWAN and 5G private networks serve rural grids.
Edge AI further tilts economics: Texas Instruments’ 2024 MCU with an embedded neural engine lets a PM sensor classify smoke on-chip, pushing only alarms to the cloud and saving 90% uplink bandwidth. As firmware-defined features propagate, the line between connectivity and computing blurs, steering buyers toward intelligent, self-healing architectures.

By End-User Industry:
Industrial Facilities Dominate, Healthcare EmergesIndustrial sites held 23.70% of environmental sensors market size in 2025, driven by continuous-emission monitoring for stacks, fugitive-gas hubs, and wastewater vents. The SEC rule and EU CSRD elevate sensor budgets from optional OpEx to board-level compliance safeguards. Healthcare climbs fastest at 13.44% CAGR as hospitals integrate PM and CO₂ feedback into HVAC automation to curb nosocomial infections. Smart ventilators and inhalers add ambient data to refine therapy algorithms.
Consumer electronics remain volume drivers—smartphones now embed barometers and temperature sensors as standard—but average selling prices are a fraction of industrial units. Automotive OEMs equip electric vehicles with cabin air-quality modules to comply with China’s GB/T 27630 interior-air standard, while autonomous-vehicle prototypes seek ambient visibility for perception stacks. Agriculture, though smaller, shows promise through precision-farming roll-outs that cut water use 20% using soil-moisture telemetry.
Geography Analysis
APAC Environmental Sensors Market
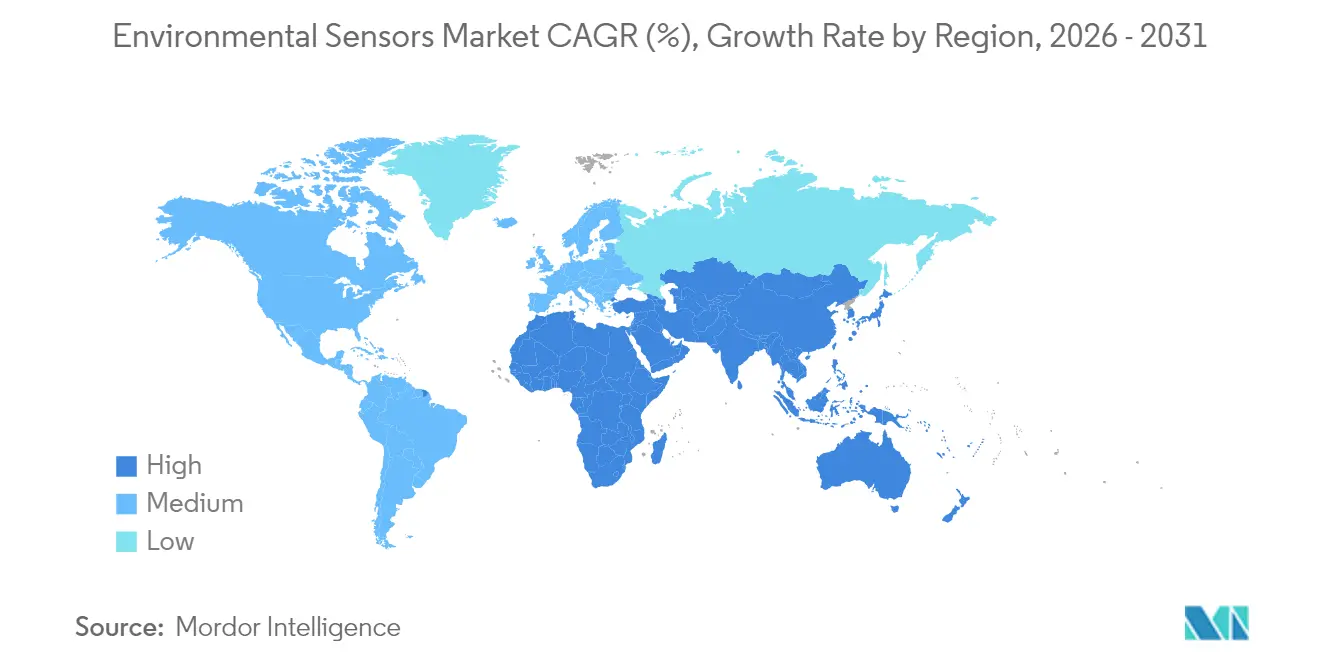
Asia-Pacific led the environmental sensors market with 37.60% revenue in 2025, powered by smart-city mega-projects in China and India that embed NB-IoT nodes in streetlights, buses, and schools. Shenzhen alone operates more than 37,000 air-quality boxes feeding open data portals. Strong electronics supply chains lower bill-of-materials, letting municipalities deploy square-kilometer grids for less than USD 15,000. Japanese and South Korean fabs inject advanced MEMS capacity, while Australian states invest in PM-and-smoke arrays for bushfire response.
North America Environmental Sensors Market
North America ranks second by value. The environmental sensors market here gains momentum from SEC climate disclosure obligations and wildfire-defense funding across California, Oregon, and British Columbia. Cloud-edge alliances flourish: Honeywell’s 2024 pact with Analog Devices links building-automation gateways directly to Azure IoT hubs, cutting integration times by half. Federal grants under the CHIPS and Science Act funnel R&D toward cyber-resilient sensor firmware.
Europe Environmental Sensors Market
Europe remains pivotal; tightened PM2.5 and ultrafine norms drive sensor retrofits across 400+ cities. Germany ties environmental telemetry to Industry 4.0 digital twins, while Nordic utilities install dew-point arrays inside district-heating vaults to manage condensation energy losses. Implementation lead times shorten because EU funds now reimburse up to 75% of air-quality network costs under Horizon Europe.
MEA Environmental Sensors Market
The Middle East and Africa presently represent a single-digit share but exhibit 13.65% CAGR. Gulf petro-states adopt continuous-leak detection for ESG-linked bond issuance, and South Africa’s mining sector pilots low-cost PM nets to bolster labor-safety audits. Scarce calibration labs remain a hurdle, but donor-funded reference stations scheduled for 2026-2027 will unlock volume orders across Nairobi, Accra, and Lagos.

Regulatory Landscape
Environmental sensors increasingly sit inside regulated measurement, reporting, and product-compliance frameworks across major markets. In the European Union, the recast Ambient Air Quality Directive (Directive (EU) 2024/2881) sets a hard transposition deadline of 11 December 2026, with implementation from 12 December 2026, which is likely to push member states toward expanded, higher-density monitoring networks that can support ultrafine particle tracking and real-time public data access requirements.
Adjacent EU rules also influence procurement and design choices. Regulation (EU) 2024/1244 strengthens annual submission of industrial environmental data to the European Commission, reinforcing demand for automated, audit-ready sensor data flows into national and EU databases, while the RoHS Directive 2011/65/EU continues to restrict hazardous substances in electronic sensor equipment. On the standards side, FprEN IEC 63580:2026 introduces a framework that aligns measurement equipment with ISO 14001 and life cycle assessment concepts (ISO 14040), adding momentum to material declarations and sustainability documentation as part of supplier qualification.
Value Chain Analysis
The environmental sensors value chain spans sensing elements and MEMS dies (electrochemical cells, NDIR optics, PM sensing elements), analog front-end and MCU/ASIC processing, packaging and calibration, module assembly (often with wireless connectivity), and software layers that deliver dashboards, alarms, and compliance reporting. Upstream, performance and market access are increasingly shaped by testing and certification pathways, including MCERTS for ambient monitoring equipment in the United Kingdom and program-level validation approaches used by public agencies. These requirements elevate the role of accredited labs and documented QA processes as a practical gate to municipal and industrial tenders.
Downstream logistics and component availability can materially affect lead times for fixed installations and large-area wireless rollouts. Evidence in 2026 highlights distribution vulnerabilities from port bottlenecks and rerouted freight lanes (for example, delays tied to congestion at the Port of Rotterdam and longer transit routes), while the industrys dependence on specialized packaging, calibration throughput, and mature-node semiconductor capacity keeps delivery risk concentrated among a limited set of qualified manufacturing and test partners. As a result, OEMs and system integrators increasingly pair hardware with ready-to-deploy evaluation platforms, reference designs, and software stacks to reduce time-to-integration for smart buildings, industrial IoT, and city-scale deployments.
Competitive Landscape
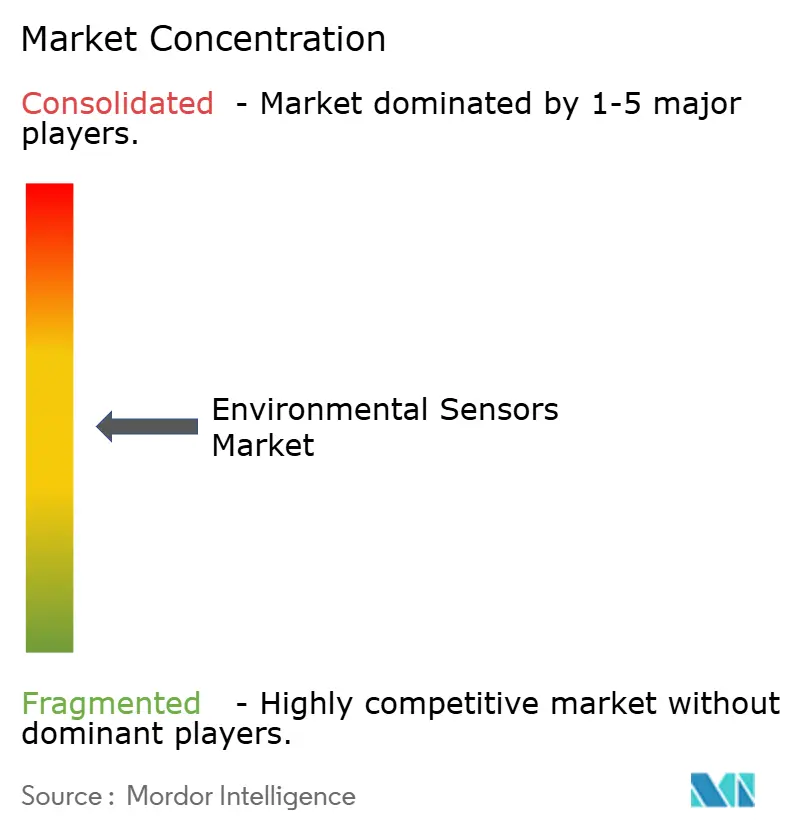
The environmental sensors market shows moderate concentration features a Herfindahl-Hirschman Index below 1,000, signaling fragmentation. Bosch Sensortec, Honeywell, and Texas Instruments together controlled roughly 21% revenue in 2024, while more than 60 suppliers split the remainder. Incumbents leverage captive fabs and IP portfolios—Bosch’s BME688 integrates four sensors plus AI firmware—to defend margins. Niche firms such as Sensirion and Figaro Engineering win design-ins by offering sub-1 ppm gas accuracy and rapid customer support.
Strategic alliances proliferate: STMicroelectronics and Qualcomm’s October 2024 collaboration bundles STM32 MCUs with Qualcomm’s RF front-ends to fast-track wireless sensor modules. Vertical mergers loom as cloud providers eye data-rich endpoints—AWS’s 2025 minority stake in a European PM-sensor startup signals data-platform convergence. Cyber-security compliance (FIPS 140-3, IEC 62443) emerges as a procurement filter; vendors lacking secure-element roadmaps risk disqualification from energy-utility tenders.
Cost pressure rises with Chinese OEMs flooding mid-tier markets at 30% lower ASPs, prompting Western suppliers to differentiate on firmware-upgradable analytics and 10-year stability guarantees. Edge-AI libraries that classify odor or smoke unlock SaaS-like recurring revenue, shifting focus from hardware gross margin to lifetime-service contracts. Over the forecast period, expect selective consolidation as cash-rich conglomerates scoop specialist IP, tightening the supplier roster without tipping into oligopoly.
Environmental Sensors Industry Leaders
ams OSRAM AG
Sensirion Holding AG
Bosch Sensortec GmbH
Honeywell International Inc.
STMicroelectronics N.V.
- *Disclaimer: Major Players sorted in no particular order
Environmental Sensors Market Companies Covered in this Report
- ams OSRAM AG
- Sensirion Holding AG
- Bosch Sensortec GmbH
- Honeywell International Inc.
- Texas Instruments Inc.
- Analog Devices Inc.
- STMicroelectronics N.V.
- NXP Semiconductors N.V.
- TDK Corporation (InvenSense)
- Omron Corporation
- Sensata Technologies Inc.
- AlphaSense Inc.
- Figaro Engineering Inc.
- Banner Engineering Corp.
- Renesas Electronics Corp.
- Teledyne FLIR LLC
- Hanwei Electronics Group Corp.
- Powelectrics Ltd.
- Eurotech S.p.A.
- Omega Engineering Inc.
- Nesa Srl
- Eko Instruments B.V.

Market Opportunities and Future Outlook
A major whitespace sits where regulatory-grade reporting needs intersect with the economics of dense, connected monitoring, particularly where authorities and enterprises must expand coverage beyond sparse reference stations. The EU recast Ambient Air Quality Directive (Directive (EU) 2024/2881) creates a time-bound catalyst through the 11 December 2026 transposition deadline, which supports opportunities for calibrated, interoperable sensor clusters, data platforms, and validation services that bridge the gap between low-cost networks and compliance-aligned reporting. In parallel, corporate disclosure regimes (such as SEC climate rules referenced in the report context and the EU CSRD) continue to pull environmental sensing into continuous monitoring budgets, reinforcing demand for traceable data pipelines and assurance-ready instrumentation across industrial sites.
Technology convergence also creates monetization routes beyond discrete sensor sales. Miniaturized multi-parameter modules (for example, Bosch Sensortec PM sensing form factors highlighted in the report context) and photoacoustic CO2 sensing roadmaps that emphasize long-term stability support smart building and indoor air-quality deployments where maintenance and recalibration costs are decisive. Academic and association signals in 2026 reinforce near-term productization themes, particularly edge-AI and on-device inference for faster anomaly detection and lower bandwidth, along with more standardized interface and methodology expectations for deployments that feed public dashboards or industrial compliance systems. These shifts tend to favor suppliers that bundle sensor hardware with developer ecosystems, device management, and security-aligned firmware paths suitable for critical infrastructure and municipal procurement.
Recent Industry Developments in Environmental Sensors Market
- April 2026: Sensirion announced the general market availability of its SEN62 environmental sensing platform, integrating particulate matter, humidity, and temperature sensing in a compact module. Making the module broadly available supports faster design-in cycles for smart building, indoor air-quality, and compact IoT nodes where footprint and integration effort are key procurement filters.
- June 2025: Bosch Sensortec expanded its developer ecosystem around the BMV080 particulate matter sensor by introducing additional evaluation and developer platforms, including options such as Polverine and a SparkFun breakout board. The added tooling lowers customer engineering effort and accelerates prototyping for wearables and distributed air-quality networks that need rapid validation and software support.
- October 2024: Sensirion introduced the SFA40 next-generation electrochemical formaldehyde sensor aimed at compact applications requiring high sensitivity and selectivity. The release strengthens supplier portfolios for indoor air-quality and smart home segments where VOC and formaldehyde measurements are increasingly tied to building-health standards and connected ventilation control.


Environmental Sensors Market Report Scope and Research Methodology
Market Definition and Coverage
For this study, the environmental sensors market covers sensor devices and modules that measure environmental conditions, such as temperature, humidity, gas, pressure, and particulate matter, and that are sold into monitoring, industrial, automotive, healthcare, and consumer uses.
Scope exclusions: We exclude broader environmental monitoring systems and services (such as software platforms, installation, and ongoing analytics) unless the revenue is clearly tied to the sensor hardware or module sold.
Segments Covered in This Report
- By Product Type
- Fixed
- Portable
- Wearable
- By Sensing Type
- Gas
- Temperature
- Humidity
- Pressure
- Particulate Matter (PM)
- Multi-parameter Modules
- By Connectivity
- Wired
- Wireless
- By End-User Industry
- Industrial
- Medical and Healthcare
- Consumer Electronics
- Automotive
- Smart Homes and Buildings
- Agriculture
- Other End-Users
- By Geography
- North America
- United States
- Canada
- Mexico
- Europe
- United Kingdom
- Germany
- France
- Italy
- Rest of Europe
- Asia-Pacific
- China
- Japan
- India
- South Korea
- Rest of Asia-Pacific
- Middle East
- Israel
- Saudi Arabia
- United Arab Emirates
- Turkey
- Rest of Middle East
- Africa
- South Africa
- Egypt
- Rest of Africa
- South America
- Brazil
- Argentina
- Rest of South America
- North America
Data Sources, Market Sizing, and Validation
Desk Research
Desk research starts with a clean fact base on demand drivers and shipment signals, and then matches them to how sensors are specified and purchased in real projects. We used public sources such as US EPA air quality programs, NOAA climate datasets, the World Health Organization guidance on air quality, and ISO/IEC standards references that define measurement and testing practices.
To keep assumptions realistic, we also reviewed import and export trade statistics, patent databases for sensing technologies, and general company filings and investor presentations that indicate product mixes and end market exposure. When needed, paid subscriptions for company financials and intelligence, plus news and financials, were used to cross-check revenue timing and currency effects. The sources mentioned here are illustrative, and other public and internal references were used as well for data collection, validation, and clarification.
Primary Interviews and Surveys
Primary inputs were gathered from interviews and structured surveys with sensor manufacturers, module integrators, distributors, and downstream users who buy sensors for monitoring stations, industrial sites, buildings, and connected devices. Because buying patterns vary by region, we also checked how purchasing behavior differs across APAC, EMEA, and the Americas, so assumptions on pricing, certifications, and deployment rates could be corrected when the desk view was thin.
table_heading stays as provided.
Distribution of primary research fieldwork respondents
| Company type | Respondent position | Region |
|---|---|---|
| Top tier: 26% | CXOs: 15% | APAC: 43% |
| Mid tier: 53% | Functional/Unit leaders: 30% | EMEA: 37% |
| Smaller Players: 21% | Managers: 55% | Americas: 20% |
Market-Sizing & Forecasting
Sizing is built using a top-down model where environmental monitoring rollouts, industrial safety adoption, smart building penetration, and regulatory enforcement trends are converted into a demand pool, which is then valued using typical sensor mix and pricing. We corroborate the totals with selective bottom-up approximations, including sampled average selling price ranges by sensor type, channel checks on portable versus fixed deployments, and roll-ups of supplier revenue exposure where disclosures are clear.
Key inputs include installed base growth of monitoring stations, expected expansion of connected devices that embed multi-parameter modules, pricing movement for gas and PM sensors versus temperature and humidity sensors, wireless versus wired adoption, and regional mix shifts that affect currency and product specifications. Forecasting uses scenario analysis supported by trend smoothing on the core drivers, with scenarios aligned to expert views on regulation intensity, smart city project pipelines, and industrial capex cycles. Where bottom-up inputs are missing for smaller private players, we close gaps through conservative proxies tied to channel coverage and observed average pricing bands.
Data Validation & Update Cycle
Validation happens in several steps, starting with cross-checking the modeled totals against independent signals such as trade movement, public program budgets where applicable, and directionally consistent shipment and pricing commentary. Outliers are investigated, and assumptions are tightened before final sign-off through multi-step analyst review.
The dataset is refreshed on an annual cycle, and interim updates are done when material events occur, such as major policy changes or sharp component price swings. Right before delivery, we do a fresh final pass on key inputs and currency conversions so clients receive the most current view.
Mordor Intelligence's Environmental Sensors Market Size Compared With Other Published Estimates
Published market sizes for environmental sensors often differ because each publisher draws the line differently on what counts as a sensor sale and how totals are scaled across end uses. Differences also show up when base years vary, when currency translation timing is not consistent, or when growth is projected from a single macro indicator without cross-checks.
The main spread comes from scope and counting logic, such as whether broader environmental monitoring solutions are included, whether multi-parameter modules are double-counted across sensor types, and how portable consumer use is treated versus industrial and government deployments. In our case, the value is kept tied to sensor and module revenue by type and connectivity, and the 2026 baseline is adjusted using segment-level pricing and adoption checks that are refreshed through validation calls. This explains why the 2026 total is USD 2.77 B for Mordor Intelligence.
Benchmark comparison
| Source | Market Size | Gaps in Research Methodology |
|---|---|---|
| Mordor Intelligence | USD 2.77 B (2026) | |
| Industry Publisher A | USD 1.83 B (2023) | Uses an earlier base year and a broader type list that can mix adjacent sensing categories, and the conversion to USD is not always clear on timing, which can compress the value versus a later-year sensor-only roll-up. |
| Industry Publisher B | USD 1.50 B (2025) | Leans heavily on application-led segmentation (smart city and smart home), which can undercount industrial and automotive sensor demand, and it uses a longer forecast horizon that can shift assumptions on price erosion and penetration. |
Overall, the gap across figures is mostly explained by year selection and what is counted as sensor revenue versus wider monitoring solutions. By anchoring the model to identifiable deployment drivers and then stress-testing price and mix assumptions with real buyer and supplier feedback, we arrive at a balanced number that is easier to replicate and audit.


Key Questions Answered in the Report
What is the current size of the environmental sensors market?
The environmental sensors market stood at USD 2.77 billion in 2026 and is projected to reach USD 4.49 billion by 2031.
Which region leads global demand for environmental sensors?
Asia-Pacific holds 37.60% of global revenue thanks to large-scale NB-IoT deployments and government-funded smart-city programs.
Why are particulate matter sensors growing faster than gas sensors?
Stricter PM2.5 limits in Europe and wildfire smoke concerns in North America push municipalities and consumers to install high-density PM monitoring networks, driving a 12.95% CAGR for these devices through 2031.
How will SEC climate rules affect industrial sensor purchases?
From 2024 forward, large U.S. filers must report assured emissions data, making continuous sensors a mandatory part of compliance budgets rather than discretionary spend.
What connectivity technologies dominate upcoming sensor roll-outs?
While wired links remain critical in heavy industry, wireless nodes using NB-IoT, LTE-Cat-M, LoRaWAN, and emerging 5G private networks will grow 14.20% annually during 2026-2031 thanks to lower installation costs and edge-AI capabilities.
Which companies are at the forefront of AI-enabled environmental sensing?
Bosch Sensortec, Texas Instruments, and STMicroelectronics lead in integrating neural inference cores directly on sensor or MCU silicon, enabling real-time pattern recognition and self-calibration at the edge.
Page last updated on:





