Carbon Capture And Utilization Market Size and Share
Market Overview
| Study Period | 2020 - 2031 |
|---|---|
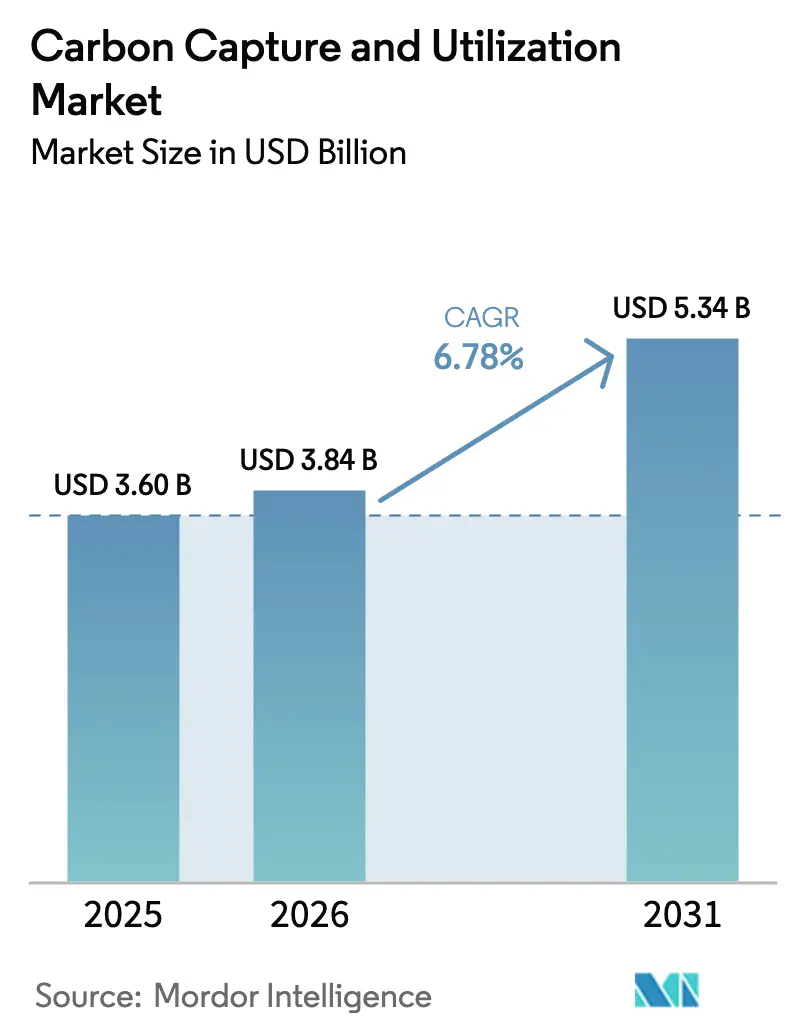
| Market Size (2026) | USD 3.84 Billion |
| Market Size (2031) | USD 5.34 Billion |
| Growth Rate (2026 - 2031) | 6.78% CAGR |
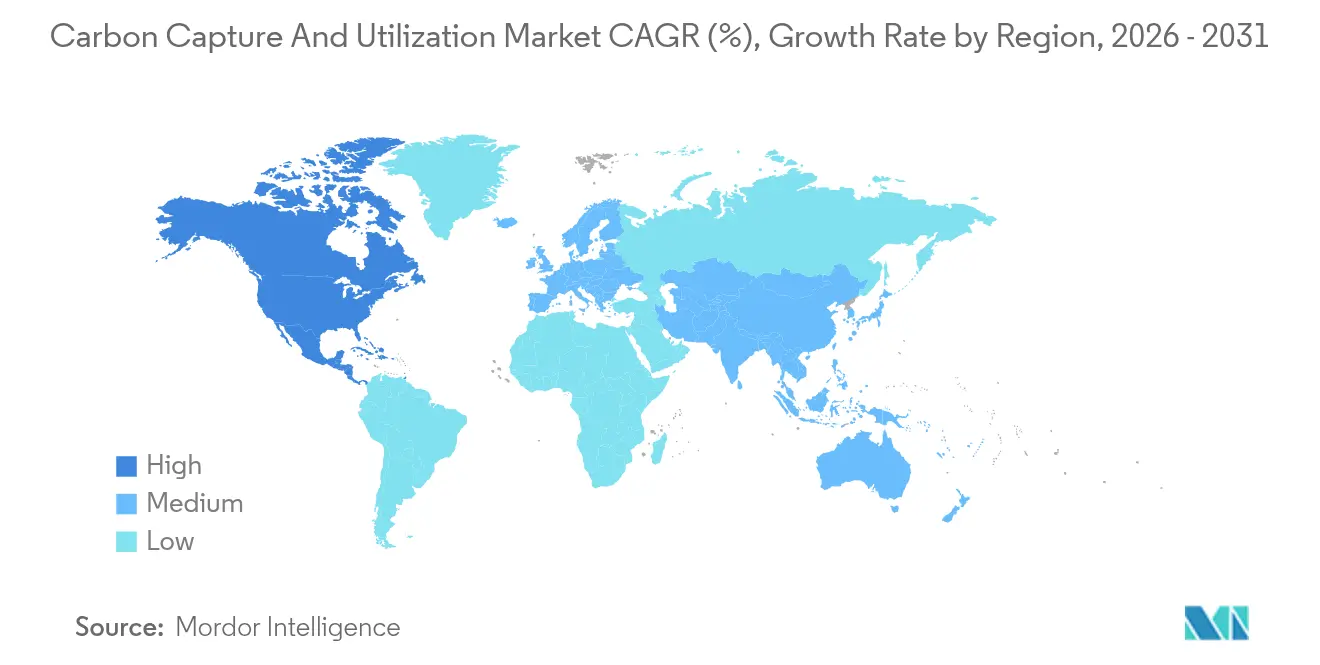
| Fastest Growing Market | Asia Pacific |
| Largest Market | North America |
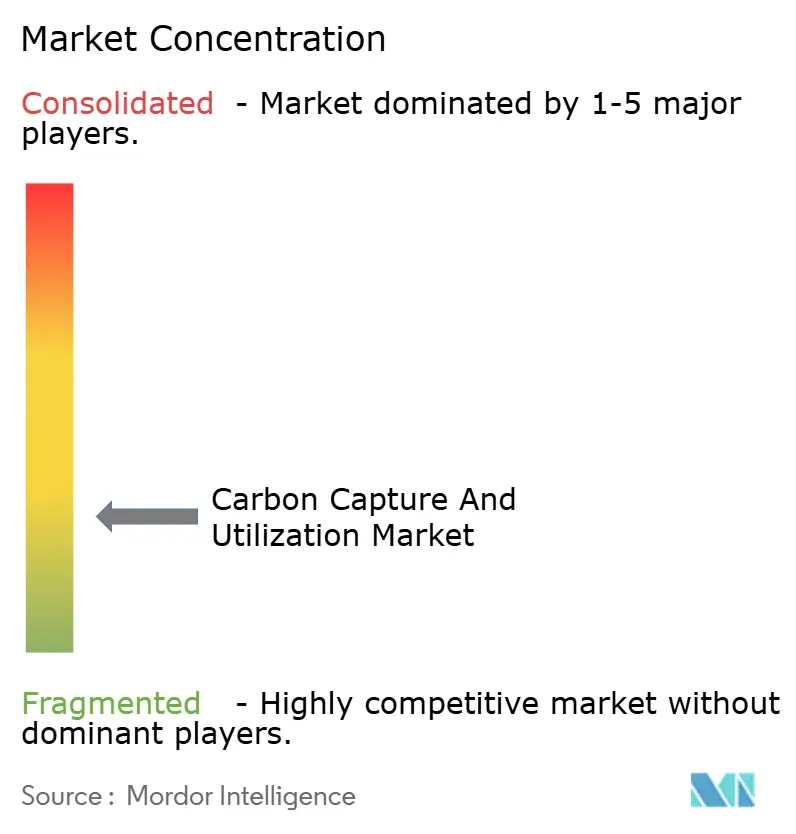
| Market Concentration | Low |
Major Players *Disclaimer: Major Players sorted in no particular order Image © Mordor Intelligence. Reuse requires attribution under CC BY 4.0. | |
Carbon Capture And Utilization Market Analysis by Mordor Intelligence
The Carbon Capture and Utilization Market size is expected to grow from USD 3.60 billion in 2025 to USD 3.84 billion in 2026 and is forecast to reach USD 5.34 billion by 2031 at 6.78% CAGR over 2026-2031. Stringent climate policies, expanding industrial use cases, and incentive-rich frameworks, such as the revised US 45Q credit and the EU Carbon Border Adjustment Mechanism, are amplifying investment interest. Post-combustion systems retain wide deployment thanks to process familiarity, while cost breakthroughs in direct air capture are widening the addressable base for negative-emission projects. Service revenues are shifting steadily toward utilization options as chemical synthesis and synthetic fuel applications gain commercial traction. A fragmented supplier landscape is now gravitating toward partnership-driven consolidation as large energy and engineering groups pursue vertical integration.
Key Report Takeaways
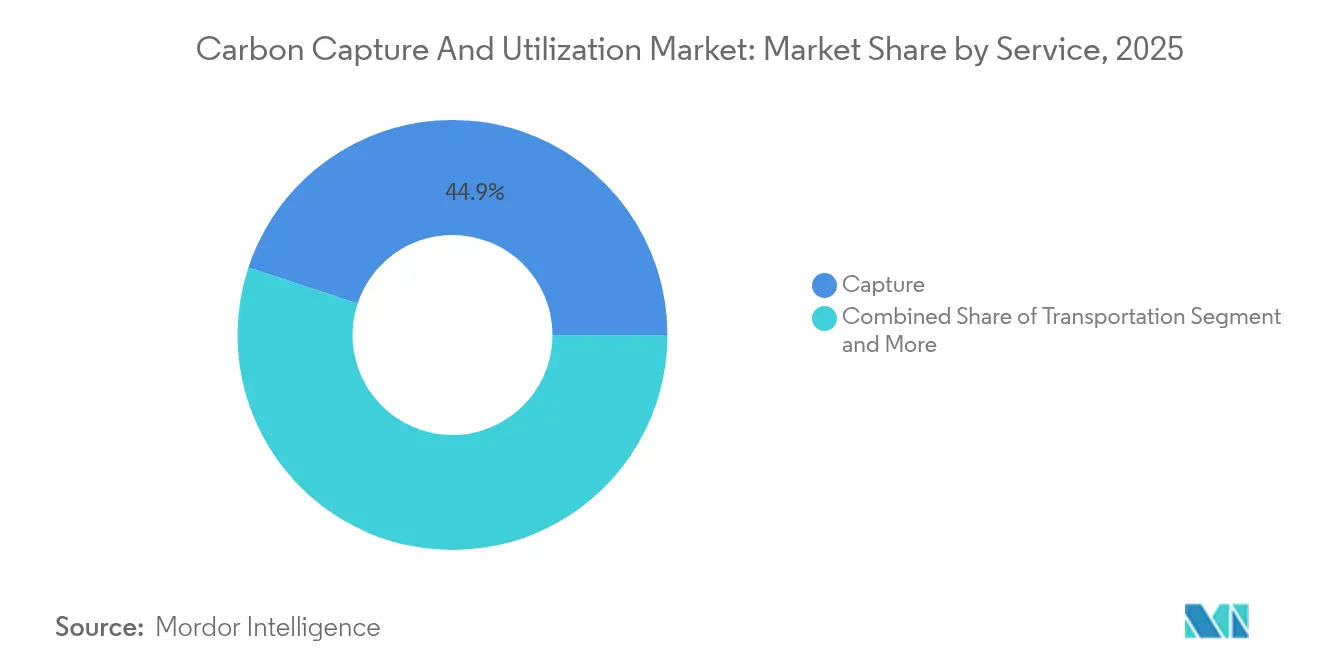
- By service, capture technologies commanded 44.92% of the carbon capture and utilization market share in 2025, whereas utilization services are expanding the fastest at a 9.45% CAGR through 2031.
- By technology, post-combustion capture held 38.12% revenue share in 2025, while direct air capture is forecast to accelerate at an 8.41% CAGR to 2031.
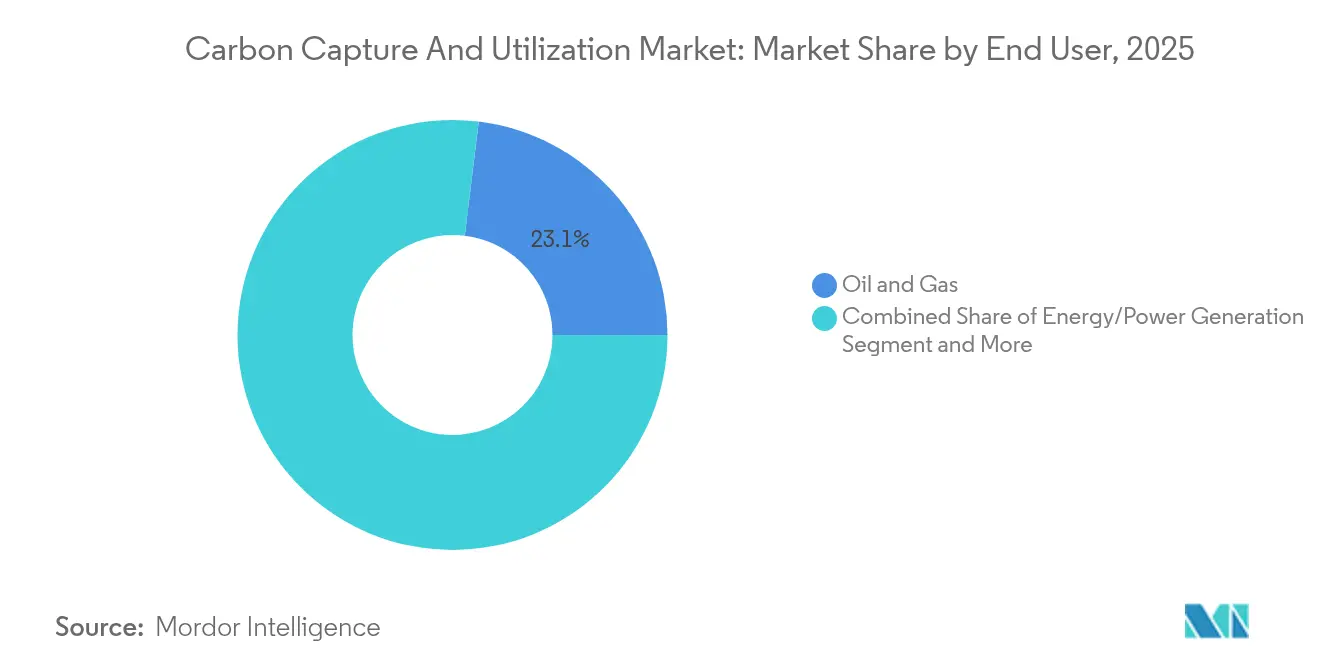
- By end user, oil and gas accounted for 23.05% share of the carbon capture and utilization market size in 2025, whereas chemicals and petrochemicals are advancing at a 9.22% CAGR through 2031.
- By geography, North America led with 30.20% revenue share in 2025; Asia-Pacific is projected to post the fastest 8.34% CAGR to 2031.
- SLB, Aker Carbon Capture, and Linde together controlled roughly 15% of the project pipeline capacity in 2024.
Note: Market size and forecast figures in this report are generated using Mordor Intelligence’s proprietary estimation framework, updated with the latest available data and insights as of 2026.
Global Carbon Capture And Utilization Market Trends and Insights
Drivers Impact Analysis*
| Driver | (~) % Impact on CAGR Forecast | Geographic Relevance | Impact Timeline |
|---|---|---|---|
| Enhanced 45Q, CBAM revenue recycling | +1.3% | North America, EU, APAC spillover | Short term (≤ 2 years) |
| Stringent carbon pricing and net-zero mandates | +1.1% | EU, North America, Global spillover | Medium term (2-4 years) |
| CO₂-based EOR and e-fuel demand | +1.0% | North America, Middle East, Global | Medium term (2-4 years) |
| Investor-led ESG capital flows | +0.9% | Developed markets worldwide | Short term (≤ 2 years) |
| Cross-sector demand for carbon-derived chemicals | +0.9% | APAC, North America | Medium term (2-4 years) |
| CO₂ use in low-carbon building materials | +0.8% | APAC core, Global | Long term (≥ 4 years) |
| AI- and IoT-enabled OPEX optimization | +0.6% | Early adoption in developed markets | Long term (≥ 4 years) |
| Source: Mordor Intelligence | |||
Government Incentives Such as 45Q Credits and EU CBAM Revenue Recycling
The 2024 enhancement of US 45Q raised utilization incentives to USD 85 per t and direct air capture incentives to USD 180 per t while clarifying eligibility for chemical and building-material pathways[1]U.S. Department of Energy, “Guidance on Section 45Q Credit for Carbon Oxide Sequestration,” U.S. Department of Energy, energy.gov. Canada’s parallel CCUS credit supports up to 60% of direct air capture capital outlays, creating a continental corridor of aligned incentives[2]Government of Canada Department of Finance, “Investment Tax Credit for Carbon Capture, Utilization, and Storage,” Government of Canada, canada.ca. Early CBAM proceeds are earmarked for technology deployment in the EU, positioning the bloc for a self-funding decarbonization loop. Heidelberg Materials and Linde secured EUR 15 million in German funding for a 70 kt/y CCU cement facility, underlining how fiscal measures catalyze scale-ups.
Stringent Carbon Pricing and Net-Zero Compliance Mandates
The phased rollout of the EU’s Carbon Border Adjustment Mechanism is compelling exporters to adopt capture solutions or pay border levies, effectively globalizing European climate policy[3]European Commission, “Regulation (EU) 2023/956 Establishing a Carbon Border Adjustment Mechanism,” Official Journal of the European Union, europa.eu. China is accelerating large CCUS projects to safeguard export competitiveness, while the US EPA’s 2032 emission limits for new gas-fired power plants are turning capture from an option into a requirement[4]United States Environmental Protection Agency, “New Source Performance Standards for Fossil-Fuel-Fired Electric Generating Units,” United States Environmental Protection Agency, epa.gov. Corporate net-zero targets reinforce these mandates, with Aramco committing to a 9 million t/y hub by 2027.
Growing Demand for CO₂-Based EOR and Synthetic E-Fuels in Aviation and Shipping
ExxonMobil’s takeover of Denbury secures the industry’s largest CO₂ pipeline network, enabling integrated EOR and utilization economics. SAF mandates in Europe, 2% by 2025 and 70% by 2050, are stimulating power-to-liquid capacity for jet fuel, while the IMO’s net-zero 2050 target is encouraging CO₂-derived methanol and ammonia for maritime fuel. Falling renewable power prices are narrowing cost gaps for these e-fuels.
Rising ESG-Linked Capital Flows and Investor Pressure on Emissions
Institutional investors are embedding carbon intensity caps in portfolios, steering capital into projects that cut Scope 1-3 emissions. TotalEnergies, Shell, and Equinor collectively allocated USD 714 million for new storage capacity in 2025, proving that access to funds increasingly hinges on credible decarbonization pathways. Technology majors such as Tencent have begun seed-funding capture start-ups, indicating that ESG criteria now span multiple sectors. The result is a widening valuation gap between low- and high-carbon assets.
Restraints Impact Analysis*
| Restraint | (~) % Impact on CAGR Forecast | Geographic Relevance | Impact Timeline |
|---|---|---|---|
| High capital intensity of retrofits and new builds | -1.2% | Global, acute in developing regions | Short term (≤ 2 years) |
| Underdeveloped CO₂ transport and storage networks | -0.9% | Global variance | Medium term (2-4 years) |
| Public resistance to injection sites | -0.6% | Agricultural & water-sensitive regions | Long term (≥ 4 years) |
| Carbon credit market volatility | -0.6% | Emerging markets most exposed | Medium term (2-4 years) |
| Unclear rules for CO₂-derived products | -0.5% | Global, evolving | Short term (≤ 2 years) |
| Source: Mordor Intelligence | |||
High Capital Intensity of Carbon Capture Retrofits and New Builds
Retrofits cost USD 50-100 per t captured, pricing out small industrial sites. SLB’s modular Just Catch™ skid trimmed capex for a 100 kt/y Dutch facility, yet financing hurdles persist in markets lacking concessional loans[5]National Energy Technology Laboratory, “Cost and Performance Baseline for Fossil Energy Plants: Volume 5—Carbon Capture Retrofit,” National Energy Technology Laboratory, netl.doe.gov. The US Department of Energy’s USD 500 million grant for transport links signals policy recognition of the issue, but private capital must still underwrite the bulk of deployment.
Public Resistance to CO₂ Injection Sites and Perceived Environmental Risks
Queensland blocked Glencore’s Great Artesian Basin storage bid and legislated a basin-wide ban after groundwater contamination concerns. Louisiana communities are raising similar objections, slowing permitting despite industry backing. Research shows that simplified monitoring communications can defuse risk perceptions, yet project proponents still struggle to convey long-term safety assurance.
*Our forecasts treat driver/restraint impacts as directional, not additive. The impact forecasts reflect baseline growth, mix effects, and variable interactions.
Segment Analysis
By Service: Utilization Drives Value Creation
Capture services generated 44.92% of 2025 revenue as plants prioritized securing CO₂ streams, anchoring the carbon capture and utilization market. Utilization, however, is growing at a 9.45% CAGR as firms monetize CO₂ in methanol, urea, and e-fuel production. Transportation remains a bottleneck because dedicated pipelines are sparse outside North America. ExxonMobil’s Denbury deal provides a ready network, illustrating how transport assets de-risk regional rollouts. Storage keeps steady demand under compliance schemes, while engineering and EPC firms see rising orders for integrated capture-to-product systems.
The utilization upswing mirrors technological maturity. Air Liquide’s latest methanol line can process captured CO₂ into a USD 750 per t product at commercial scale, narrowing the parity with fossil routes. Engineering houses that master multidisciplinary integration are grabbing premium contracts. North American and European governments continue to fund early pipeline links, recognising that without midstream build-out, the carbon capture and utilization market will not reach its forecast potential.


By Technology: Direct Air Capture Emerges Despite Post-Combustion Dominance
Post-combustion held a 38.12% share in 2025 because it retrofits seamlessly onto boilers and process stacks, anchoring the current carbon capture and utilization market size. Direct air capture, at 8.41% CAGR, is closing the cost gap through modular sorbent upgrades; Climeworks and CapturePoint aim for 1 Mt/y in Louisiana under a USD 50 million DOE grant. Pre-combustion and oxy-fuel serve niche power and steel applications, providing steady though slower growth. Hybrid facilities combining flue-gas capture with air-capture polishing are surfacing in Japan and Canada to maximize credit revenues.
Cost trajectories are encouraging. Projected direct air capture costs of USD 230-540 per t could qualify for 45Q credits well before 2030, making negative-emission offerings bankable. Oxy-fuel retrofits in cement plants improve heat efficiency while generating near-pure CO₂ streams, positioning the technology to gain share as plants approach refurbishment cycles.
By End User: Chemicals Lead Growth Despite Oil and Gas Dominance
Oil and gas retained a 23.05% slice of the carbon capture and utilization market in 2025, owing to legacy EOR infrastructure and regulatory familiarity. Chemical and petrochemical players, however, are spearheading growth at 9.22% CAGR as CO₂-to-chemicals processes achieve commercial yield. Power utilities are next in line, driven by EPA mandates requiring capture on new gas turbines by 2032. Metals producers are piloting oxy-fuel and pre-combustion routes to curtail Scope 1 emissions. Cement projects like Heidelberg’s Norwegian plant combine capture and mineralization, showcasing value-added cementitious outputs.
Advances in electrolysis now convert CO₂ into feedstock-grade carbon monoxide with 93% efficiency, lowering resource costs for syngas and polymer chains. Aerospace and automotive innovators are trialing CO₂-derived composites to curb embodied emissions in vehicles and aircraft. Agriculture remains small yet is adopting CO₂ for greenhouse enrichment, adding resilience to the overall carbon capture and utilization market.
Geography Analysis
North America contributed 30.20% of global revenue in 2025, underpinned by mature pipeline grids and enhanced 45Q tax credits that transform project economics. ExxonMobil’s expansion via Denbury secures 1,300 km of CO₂ lines, translating regulatory incentives into physical capacity. Canada’s CCUS credit, offering up to 60% of direct air capture capex, aligns policies across the continent to accelerate the carbon capture and utilization market. Political headwinds exist; Louisiana’s proposed restrictions underscore the need for community engagement to avoid permitting delays.
Asia-Pacific is forecast to post the highest 8.34% CAGR to 2031 as China rolls out multi-Mt clusters and Japan/South Korea pool R&D resources. China holds nearly half of all CCUS patents, helping local firms cut learning curves. JOGMEC and private Japanese groups are bankrolling pilot hubs, creating exportable engineering know-how. Transport infrastructure lags, but government-backed pipeline blueprints are advancing. Sumitomo’s stake in Global Thermostat signals interest in direct air capture for negative-emission offsets.
Europe remains a regulatory pace-setter. The carbon capture and utilization market benefits from CBAM-driven demand as exporters scramble to decarbonize. Norway’s Longship program integrates capture, ship transport, and North Sea storage, offering a blueprint now emulated in the Netherlands and Denmark. The Brevik cement project captures 400 kt/y, proving feasibility in energy-intensive sectors. Nordic funding pools and EU innovation grants drive utilization pilots, such as Lhoist’s EVEREST lime project targeting 1.4 Mt/y capture with 89% emission cuts.

Competitive Landscape
Competition is moderating from fragmented toward mid-level concentration as players knit together end-to-end offerings. SLB’s USD 400 million acquisition of 80% of Aker Carbon Capture forms a vertically integrated service powerhouse spanning solvents, modular units, and large-scale EPC delivery. Mitsubishi Heavy Industries is deploying its CO2MPACT™ line in Belgium and Canada, diversifying geographically while cultivating regional partnerships for localization advantages. Linde couples oxygen and hydrogen technologies with capture, capitalizing on synergies in chemical hubs.
White-space opportunities reside in modular skids for 30-150 kt/y throughput, reducing per-unit capex by up to 25%. Digital players are inserting AI platforms to cut solvent make-up, offering SaaS-priced performance contracts. As cross-sector alliances proliferate, oil majors link with cement and chemical groups to pool capture volumes, optimizing shared transport and storage assets. Emerging disruptors specialize in solid sorbents and electrochemical upgrade paths, attracting venture funding even amid macro-tight liquidity.
Competitive positioning now revolves around technology breadth, integration depth, and regional regulatory expertise. Companies able to package capture, utilization sales outlets, and financing structuring hold an edge in an environment where paybacks hinge on multi-revenue stacking.
Carbon Capture And Utilization Industry Leaders
Royal Dutch Shell PLC
Fluor Corporation
Mitsubishi Heavy Industries, Ltd.
Linde Plc
Exxon Mobil Corporation
- *Disclaimer: Major Players sorted in no particular order

Recent Industry Developments
- January 2025: SLB Capturi and Aker Solutions won an EPCIC deal from Hafslund Celsio to install a 350 kt/y capture system at Oslo’s waste-to-energy plant under Norway’s Longship program.
- January 2025: SLB Capturi commissioned its first modular Just Catch™ plant in Hengelo, Netherlands, capturing 100 kt/y for use in horticulture and beverages.
- December 2024: Aramco, SLB, and Linde unveiled plans for a 9 Mt/y hub in Jubail to be online by 2027.
- December 2024: SLB Capturi finalized the 400 kt/y Brevik cement capture unit, marking the first full-scale plant in the sector.


Global Carbon Capture And Utilization Market Report Scope
Carbon capture and utilization (CCU) is an innovative process that seizes carbon dioxide (CO2) emissions from industrial operations or the atmosphere. It then transforms these emissions into valuable commodities. This dual benefit of CCU is that it curbs greenhouse gas emissions, combats climate change, and generates economic value by repurposing CO2 into valuable materials. The carbon capture and utilization forecast is segmented by service, technology, end user, and geography. By service, the market is segmented into capture, transportation, utilization, and storage. By technology, the market is segmented into oxy-fuel combustion capture, pre-combustion capture, and post-combustion capture. By end user, the market is segmented into oil and gas, iron and steel, power generation, chemical and petrochemical, cement, and other end users. By geography, the market is segmented into Asia-Pacific, North America, Europe, South America, and the Middle East and Africa. The reports offer the market sizing and forecasts for the carbon capture and utilization in value (USD) for all the above segments.
| Capture |
| Transportation |
| Utilization |
| Storage |
| Engineering & EPC Services |
| Pre-combustion Capture |
| Oxy-fuel Combustion Capture |
| Post-combustion Capture |
| Direct Air Capture |
| Oil & Gas |
| Energy/ Power Generation |
| Iron & Steel |
| Chemical & Fertilizer |
| Construction & Cement |
| Aerospace & Automotive |
| Others (Agricultre, Food & Beverage, etc.) |
| North America | United States |
| Canada | |
| Mexico | |
| South America | Brazil |
| Argentina | |
| Peru | |
| Rest of South America | |
| Europe | United Kingdom |
| Germany | |
| France | |
| Italy | |
| Spain | |
| BENELUX (Belgium, Netherlands, and Luxembourg) | |
| NORDICS (Denmark, Finland, Iceland, Norway, and Sweden) | |
| Rest of Europe | |
| Asia-Pacific | China |
| India | |
| Japan | |
| Australia | |
| South Korea | |
| ASEAN (Indonesia, Thailand, Philippines, Malaysia, Vietnam) | |
| Rest of Asia-Pacific | |
| Middle East and Africa | Saudi Arabia |
| United Arab Emirates | |
| Qatar | |
| Kuwait | |
| Turkey | |
| Egypt | |
| South Africa | |
| Nigeria | |
| Rest of Middle East and Africa |
| By Service | Capture | |
| Transportation | ||
| Utilization | ||
| Storage | ||
| Engineering & EPC Services | ||
| By Technology | Pre-combustion Capture | |
| Oxy-fuel Combustion Capture | ||
| Post-combustion Capture | ||
| Direct Air Capture | ||
| By End User | Oil & Gas | |
| Energy/ Power Generation | ||
| Iron & Steel | ||
| Chemical & Fertilizer | ||
| Construction & Cement | ||
| Aerospace & Automotive | ||
| Others (Agricultre, Food & Beverage, etc.) | ||
| By Geography | North America | United States |
| Canada | ||
| Mexico | ||
| South America | Brazil | |
| Argentina | ||
| Peru | ||
| Rest of South America | ||
| Europe | United Kingdom | |
| Germany | ||
| France | ||
| Italy | ||
| Spain | ||
| BENELUX (Belgium, Netherlands, and Luxembourg) | ||
| NORDICS (Denmark, Finland, Iceland, Norway, and Sweden) | ||
| Rest of Europe | ||
| Asia-Pacific | China | |
| India | ||
| Japan | ||
| Australia | ||
| South Korea | ||
| ASEAN (Indonesia, Thailand, Philippines, Malaysia, Vietnam) | ||
| Rest of Asia-Pacific | ||
| Middle East and Africa | Saudi Arabia | |
| United Arab Emirates | ||
| Qatar | ||
| Kuwait | ||
| Turkey | ||
| Egypt | ||
| South Africa | ||
| Nigeria | ||
| Rest of Middle East and Africa | ||


Key Questions Answered in the Report
What is the current carbon capture and utilization market size?
The carbon capture and utilization market size stands at USD 3.84 billion in 2026.
Which service segment is growing the fastest?
Utilization services are growing the fastest, posting a 9.45% CAGR through 2031 as companies commercialize CO₂-derived fuels and chemicals.
Which technology segment holds the largest share today?
Post-combustion capture leads with 38.12% carbon capture and utilization market share due to retrofit ease across existing plants.
How are incentives like 45Q impacting project economics?
The enhanced 45Q credit, paying up to USD 85 per t for utilization and up to USD 180 per t for direct air capture, is shortening paybacks and unlocking finance for large-scale facilities in North America.
Page last updated on:


