Hazardous Waste Management Market Size and Share
Market Overview
| Study Period | 2020 - 2031 |
|---|---|
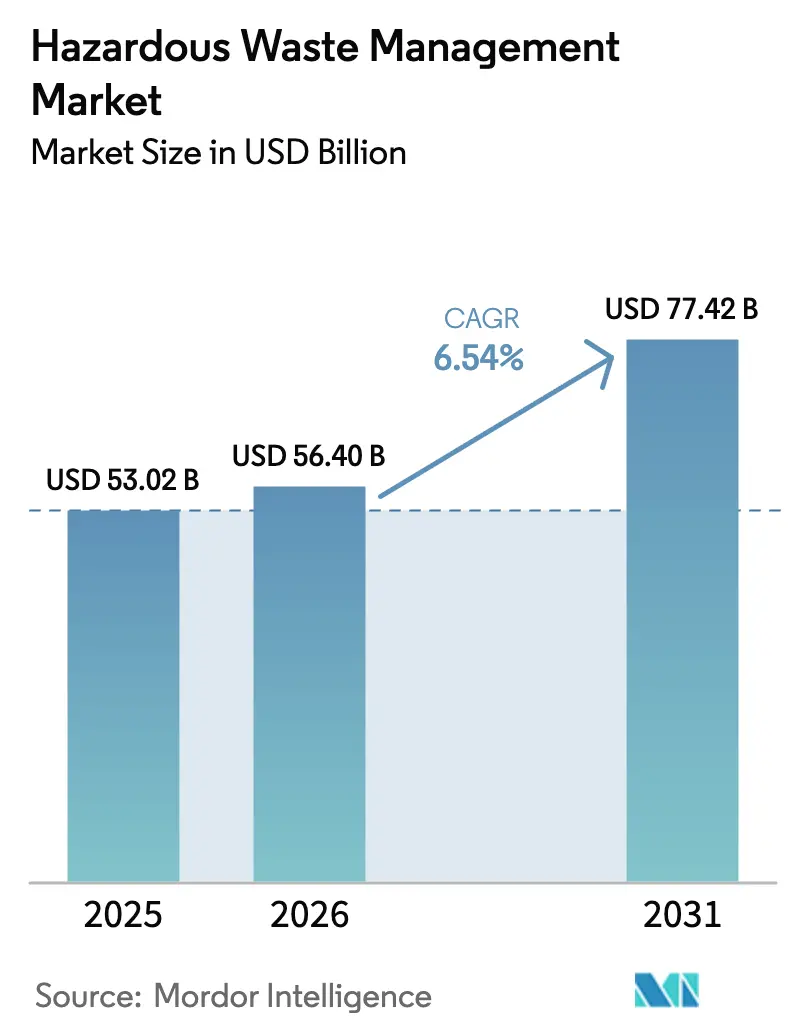
| Market Size (2026) | USD 56.40 Billion |
| Market Size (2031) | USD 77.42 Billion |
| Growth Rate (2026 - 2031) | 6.54% CAGR |
| Fastest Growing Market | Asia Pacific |
| Largest Market | Asia Pacific |
| Market Concentration | Medium |
Major Players *Disclaimer: Major Players sorted in no particular order Image © Mordor Intelligence. Reuse requires attribution under CC BY 4.0. | |
Hazardous Waste Management Market Analysis by Mordor Intelligence
The Hazardous Waste Management Market size was valued at USD 53.02 billion in 2025 and is estimated to grow from USD 56.40 billion in 2026 to reach USD 77.42 billion by 2031, at a CAGR of 6.54% during the forecast period (2026-2031), reflecting stronger global enforcement of e-waste, battery, and co-processing regulations. Liquid, sludge, and chemical streams dominate current volumes, yet electronics, biomedical, and resource-recovery segments are accelerating as circular-economy targets tighten. Generators are shifting from landfill reliance toward advanced thermal, recycling, and on-site stabilization routes in response to ESG scrutiny and rising insurance costs for high-risk cargo. Asia-Pacific leads capacity additions through cement-kiln co-processing and AI-enabled sorting, while North America and Europe adopt plasma and supercritical technologies to comply with PFAS and battery directives. Multinationals continue to consolidate collection fleets, analytics platforms, and destruction technologies to secure long-term feedstock and environmental permits.[1]https://www.basel.int/
Key Report Takeaways
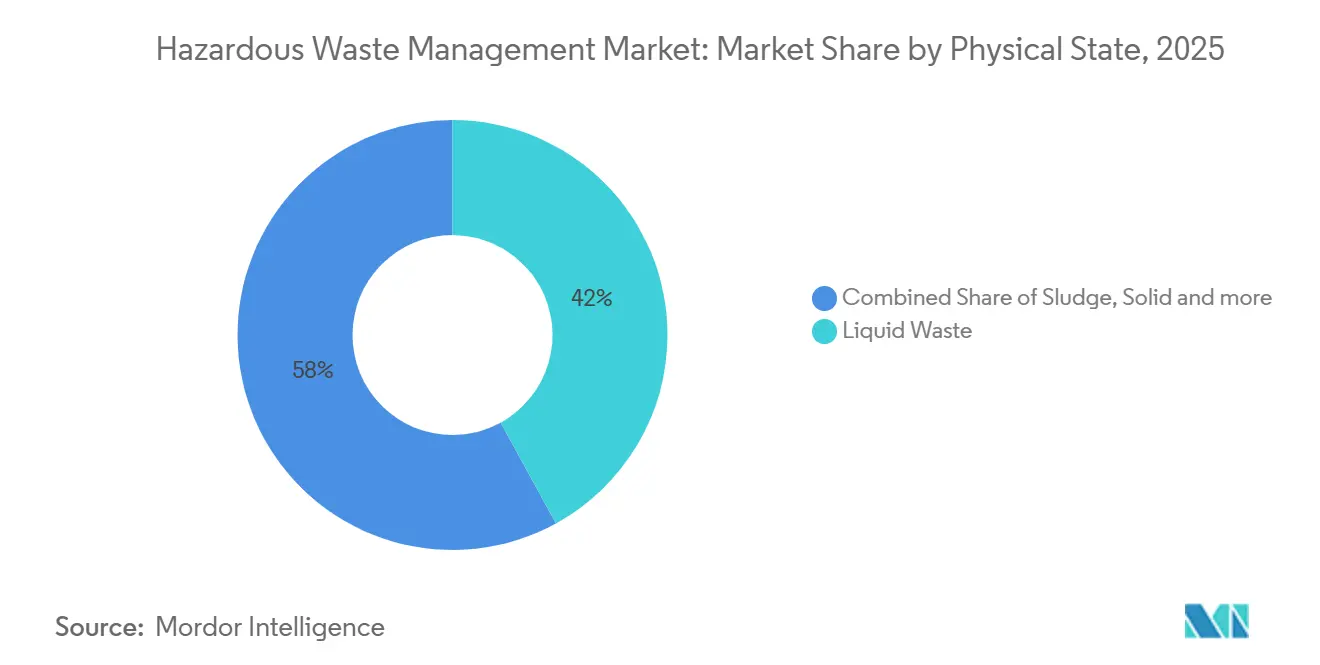
- By physical state, liquid waste held 42% of the Hazardous Waste Management market share in 2025, whereas sludge streams are advancing at a 6.8% CAGR through 2031.
- By waste category, chemical streams commanded 41% of the mix in 2025, while biomedical waste is on track for an 8.7% CAGR to 2031.
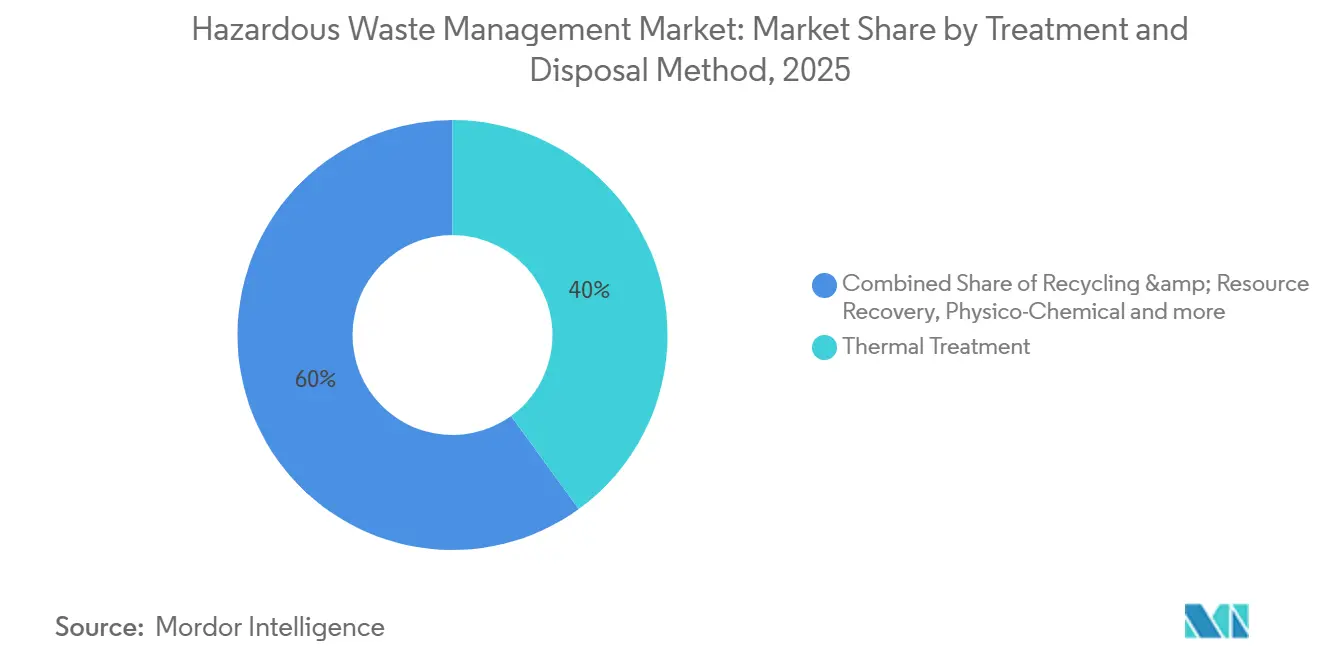
- By treatment method, thermal processes accounted for 40% of revenue in 2025; recycling and resource recovery is the fastest-growing at a 10.9% CAGR.
- By service, collection and transportation captured 32% in 2025, yet consulting, audit, and training services are rising at an 8.9% CAGR.
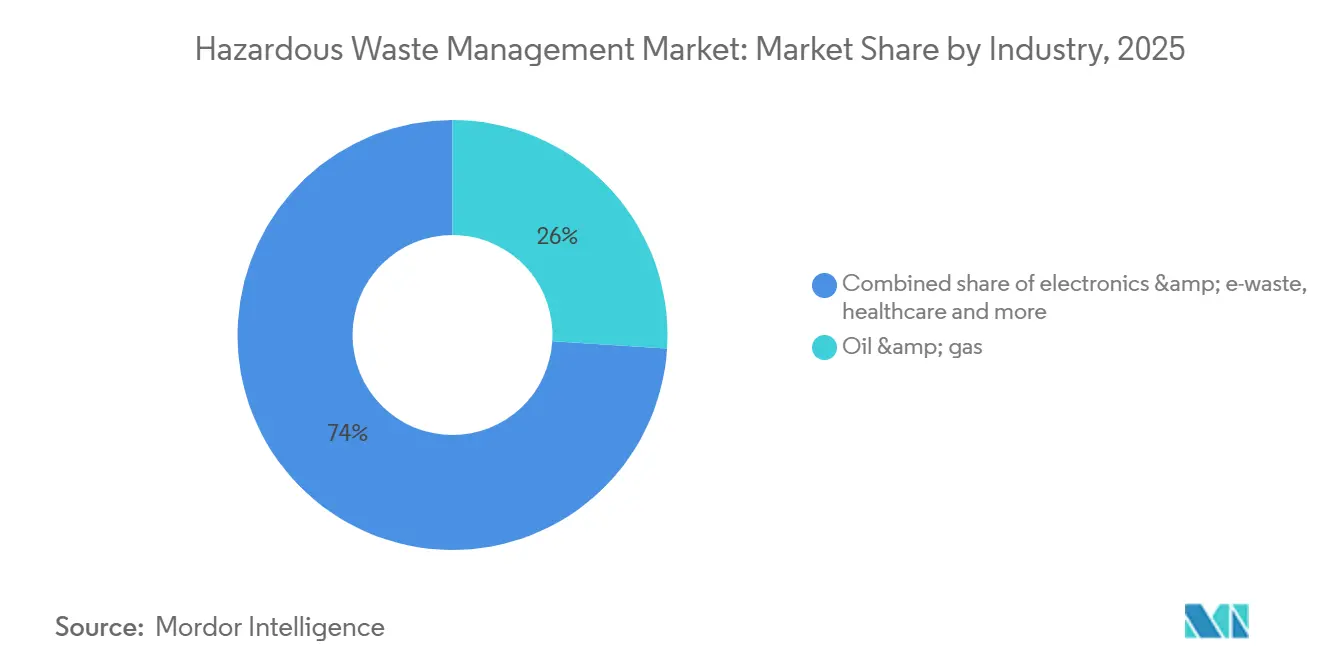
- By industry, oil and gas produced 26% of demand in 2025, and electronics generators are the quickest climber with a 10.3% CAGR.
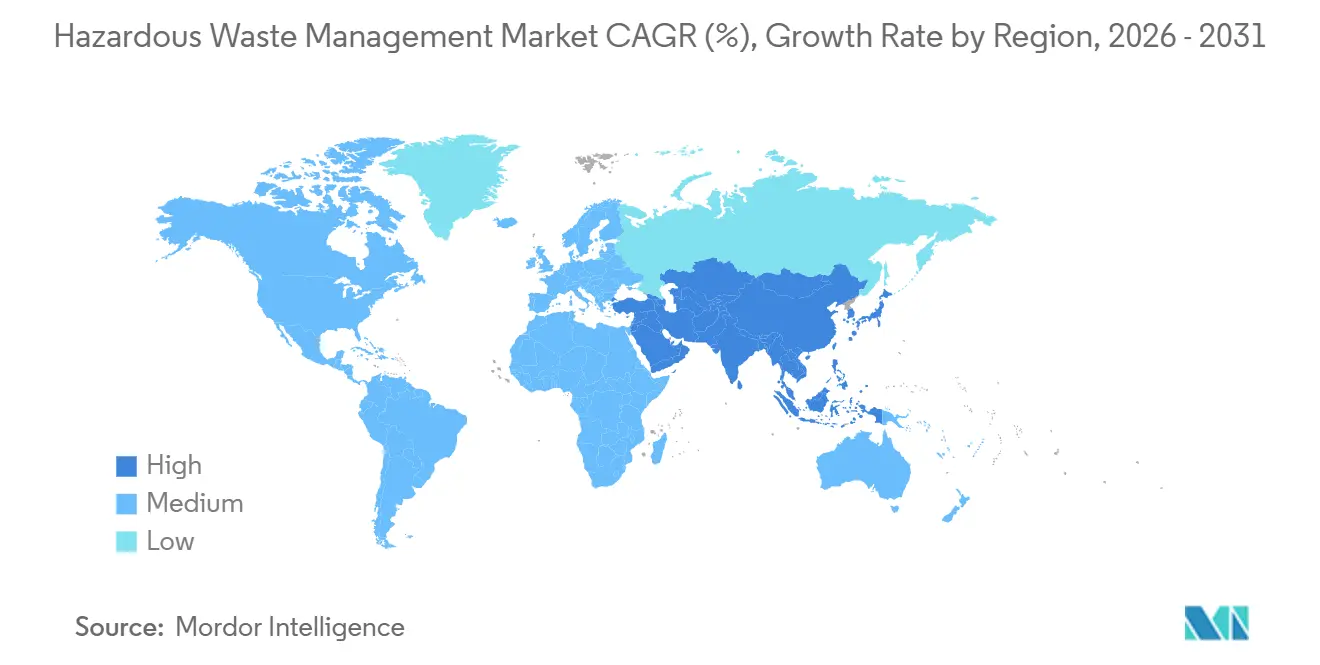
- By geography, Asia-Pacific contributed 40.24% in 2025 and will maintain a 6.80% CAGR to 2031.
Note: Market size and forecast figures in this report are generated using Mordor Intelligence’s proprietary estimation framework, updated with the latest available data and insights as of January 2026.
Global Hazardous Waste Management Market Trends and Insights
Drivers Impact Analysis*
| Drivers | (~) % Impact on CAGR Forecast | Geographic Relevance | Impact Timeline |
|---|---|---|---|
| EU Green Deal Recycled-Content Mandates for Batteries & Electronics (2025) | +1.2% | EU core, spillover to UK and EFTA states | Medium term (2-4 years) |
| China 15th Five-Year Plan Incentives for Hazardous-Waste Co-Processing (2026-2030) | +1.0% | China, pilots in Vietnam and Indonesia | Long term (≥4 years) |
| Basel Convention Plastic-Waste Amendments Enforcement (2025) | +0.8% | Global with heightened compliance in the EU, Japan, and South Korea | Medium term (2-4 years) |
| Carbon-Credit Monetization for Waste-to-Energy Projects | +0.7% | Global, early gains in Japan, Switzerland, Singapore | Medium term (2-4 years) |
| AI-Powered Spectral Sorting at Asian Manufacturing Sites | +0.6% | China, India, Thailand, Malaysia | Short term (≤2 years) |
| Source: Mordor Intelligence | |||
EU Green Deal Recycled-Content Mandates for Batteries & Electronics (2025)
Regulation 2023/1542 obliges industrial and EV batteries sold in the EU to contain 16% cobalt, 6% lithium, and 6% nickel from recycled sources by 2031. Automakers, therefore, co-locate dismantling lines at gigafactories and fund hydrometallurgical pilots that preserve cathode chemistry. Collection thresholds climb to 63% in 2027 and 73% in 2030, pushing logistics firms to install GPS tracing on pickup routes. The UK and EFTA states are harmonizing rules to stay within European supply chains, while Asian contract manufacturers feel upstream pressure to meet parallel targets.[2]https://commission.europa.eu/index_en
China 15th Five-Year Plan Incentives for Hazardous-Waste Co-Processing (2026-2030)
Beijing offers tax rebates and fast-track permits to cement plants that retrofit kilns for hazardous-waste fuel substitution, aiming for a 20% rate by 2030. Solvents, sludges, and contaminated soils gain entry at 1,450 °C, displacing coal and cutting landfill use. Independent incinerators face fee pressure as kilns underbid tipping charges. Vietnam and Indonesia are importing Chinese designs for similar co-processing strategies in export zones.[3]https://www.ndrc.gov.cn/
Basel Convention Plastic-Waste Amendments Enforcement (2025)
The 2025 amendment reclassified mixed and contaminated plastics as hazardous, requiring prior informed consent for cross-border shipments. Exporting countries are boosting domestic sorting and chemical-recycling capacity to avoid rejection at Southeast Asian ports. Japan and South Korea have already commissioned new pyrolysis trains adjacent to petrochemical hubs. Near-infrared sorters equipped with AI now cut contamination rates below 5% at two-meter-per-second belt speeds. Small generators increasingly pool volumes through third-party aggregators to reduce per-ton handling fees.[4]https://www.basel.int/
Carbon-Credit Monetization for Waste-to-Energy Projects
Article 6 bilateral deals let operators earn USD 20-40 per tonne of CO₂e for energy-from-waste that displaces fossil generation. Japan and Switzerland approved the first credits in 2025, adding two to three percentage points to project returns. Biomedical-waste incinerators, already required by health codes, now monetize their unavoidable combustion. The UK plans to fold energy-from-waste into its emissions-trading scheme by 2028.
Restraints Impact Analysis*
| Restraints | (~) % Impact on CAGR Forecast | Geographic Relevance | Impact Timeline |
|---|---|---|---|
| Inflation-Driven Cost Surge of Specialty Liners & Sorbents | -0.5% | Global, acute in North America and EU | Short term (≤2 years) |
| ESG Scrutiny Limiting Offshore Waste Exports | -0.4% | OECD core, pressure on ASEAN import terminals | Medium term (2-4 years) |
| Lithium-Ion Battery Fire Risk Raising Insurance Premiums | -0.3% | Global, concentrated in high-volume corridors | Short term (≤2 years) |
| Limited Commercial Availability of PFAS Destruction Technologies | -0.3% | North America, EU, Australia | Long term (≥4 years) |
| Source: Mordor Intelligence | |||
Inflation-Driven Cost Surge of Specialty Liners & Sorbents
Prices for polyethylene liners, bentonite clay, and activated carbon climbed 15-25% in 2024-2025 on feedstock volatility. These materials form 10-15% of total treatment costs, squeezing mid-tier landfill operators in North America and Europe. Larger players leverage bulk contracts and pass-through clauses, while smaller firms test bio-based substitutes pending regulatory approvals. The cost spike accelerates mergers as financially stressed independents seek scale.
ESG Scrutiny Limiting Offshore Waste Exports
Investors now demand end-of-life transparency in sustainability reports, discouraging shipments from OECD ports to lower-cost ASEAN destinations. Rotterdam, Hamburg, and Los Angeles face backlogs because local incineration and stabilization capacity have not kept pace. Generators respond by installing on-site treatment units and forming regional hubs that meet OECD standards, reducing voyage distances.
*Our forecasts treat driver/restraint impacts as directional, not additive. The impact forecasts reflect baseline growth, mix effects, and variable interactions.
Segment Analysis
By Physical State: Liquid Dominance Amid Sludge Acceleration
Liquid streams delivered 42% of the Hazardous Waste Management market in 2025, anchored by petrochemical and pharmaceutical effluents that require incineration or physico-chemical treatment. Sludge volumes are rising at a 6.8% CAGR to 2031 as wastewater plants upgrade under tighter discharge codes in the United States and the EU. Operators are upgrading membrane systems and electro-coagulation units to reduce liquid volumes before off-site shipment, easing transportation charges.
Sludge investors focus on thermal dryers, anaerobic digesters, and pyrolysis lines that convert biosolids to biochar and syngas, creating saleable by-products. EU Waste Framework amendments adopted in 2024 prioritize energy recovery for non-recyclable sludges. Liquid-waste service providers, meanwhile, add mobile filtration rigs for refinery turnarounds, boosting high-margin emergency response revenue. This dual path keeps the Hazardous Waste Management Market flexible across varying waste profiles.


By Waste Category: Chemical Streams Lead, Biomedical Surges
Chemical residues retained 41% of category revenue in 2025, reflecting heavy use of solvents, acids, and reactives in industrial processing. Biomedical and clinical waste is the fastest mover at an 8.7% CAGR, fueled by post-pandemic infection-control rules and single-use device growth. Major hospital networks in India and China installed GPS-tracked autoclave lines to comply with updated 2024 waste rules.
Direct-recycling pilots for e-waste intersect with chemical waste strategies when hydrometallurgical leaching extracts precious metals. Pathogen-bearing waste requires thermal disinfection before shredding, and regulators now insist on barcode tracking to guarantee full treatment. These protocols raise compliance costs yet foster trust among institutional investors that demand ESG alignment from the Hazardous Waste Management industry.
By Treatment/ Disposal Method: Thermal Leads, Recycling Gains Momentum
Thermal routes contributed 40% of 2025 revenue, prized for 90% volume reduction and destruction of organics at 1,200 °C. Recycling and resource recovery grow at a 10.9% CAGR as battery and electronics producers chase recycled-content mandates. Plasma gasification and pyrolysis teams in Japan and South Korea now run plants that export electricity and vitrified slag.
Air-quality limits push operators to add scrubbers and continuous monitors, boosting capital spend by USD 5-15 million per stack. Resource-recovery plants offset higher cost through Article 6 carbon credits and premium sales of secondary metals. That dynamic underpins the sustained expansion of the Hazardous Waste Management market size in this segment.
By Service: Collection Dominates, Consulting Accelerates
Collection and transportation secured 32% of 2025 revenue on specialized tankers and GPS tracking. Consulting, audit, and training will climb at an 8.9% CAGR as global manufacturers embed ESG metrics into supplier contracts. Outsourcing trends favor integrated vendors that combine trucks, labs, and advisory teams under multi-year agreements.
Digital route optimization trims empty miles and slashes carbon footprints, enhancing bid scores in municipal tenders. Advisory divisions certify ISO 14001 and perform life-cycle assessments, helping clients avoid fines while driving the Hazardous Waste Management Market toward higher-margin knowledge services.
By Industry: Oil & Gas Leads, Electronics Surges
Oil and gas producers generated 26% of demand in 2025 through drilling muds and refinery sludges. Electronics manufacturers are set for a 10.3% CAGR to 2031 as battery volumes soar with electric-vehicle uptake. Smartphone replacement cycles have shortened to two to three years, feeding growing secondary markets for repurposed batteries.
Refinery clients adopt thermal desorption units to reclaim hydrocarbons, whereas electronics generators contract dismantlers that extract cobalt, lithium, and rare earths. Logistics providers are innovating passive cooling crates to cut insurance premiums on lithium-ion shipments. These moves diversify revenue and broaden the Hazardous Waste Management industry footprint.
Geography Analysis
Asia-Pacific held 40.24% of market revenue in 2025 and is set to compound at 6.80% through 2031 on the back of China’s co-processing incentives, India’s EPR mandates, and ASEAN investments in waste-to-energy facilities. Chinese cement kilns now substitute up to one-fifth of fossil fuel with hazardous residues, trimming both emissions and tipping fees. India expanded dismantling hubs for electronics in 2025 and linked them to hydrometallurgical refineries that meet battery-grade output specs.
North America and Europe tighten landfill caps and PFAS rules, catalyzing on-site plasma and SCWO installations. The United States finalized 4 ppt limits for PFOA and PFOS in 2024, pushing utilities and manufacturers to secure destruction capacity. The EU updated its Waste Framework in 2024 to prioritize prevention, reuse, and recycling over disposal, with member states piloting blockchain manifests for intra-EU shipments to cut paperwork by half.
The Middle East and Africa, though smaller, are accelerating. Saudi Arabia, the UAE, and Qatar approved integrated complexes that couple incineration, landfill, and energy recovery under public-private partnerships. South Africa’s EnviroServ expanded capacity to treat mining and healthcare wastes, while Nigeria and Egypt secured development-bank funds for feasibility studies. These moves broaden regional access to compliant disposal and grow the global Hazardous Waste Management Market.
Note: Segment shares of all individual regions available upon report purchase

Competitive Landscape
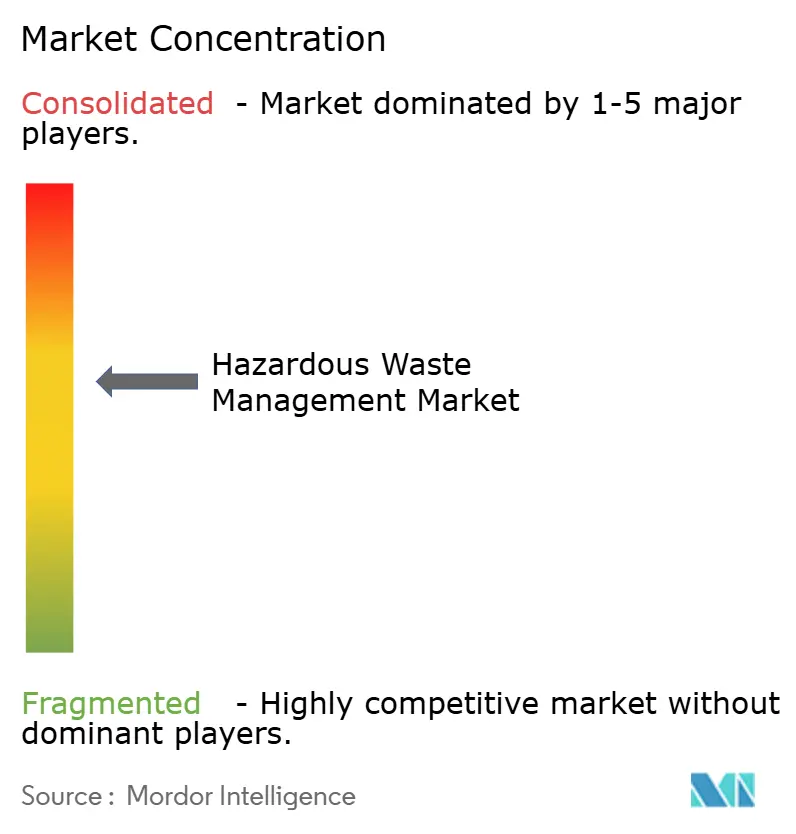
The Hazardous Waste Management Market is moderately concentrated. The top five companies, Veolia, Suez, Waste Management Inc., Clean Harbors, and Republic Services, control roughly 30% of global revenue, leaving room for regional specialists. Vertical integration remains the core play: Veolia recently absorbed Suez’s European assets, adding incinerators and landfills that lock in feedstock and permit positions. Competitors respond by acquiring collection fleets or securing long-term power-purchase deals for waste-to-energy plants.
Strategic alliances accelerate tech uptake. Battery gigafactories partner with waste firms to co-locate dismantling lines, and cement producers sign multi-year offtake contracts for hazardous residues that replace coal. AI vendors embed sensors and blockchain IDs into containers, offering generator clients proof of custody. Patent filings in plasma torch and electrochemical oxidation surged 15% year-over-year in 2025, signaling intensifying R&D rivalry.
White-space entrants chase niche pain points such as PFAS destruction and lithium-ion fire mitigation. Venture-backed firms pilot supercritical water oxidation with throughput guarantees, while container makers test passive cooling composites that cut thermal-runaway risk. Digital marketplaces bundle small-quantity generator loads, improving fleet utilization and granting remote clients access to premium treatment. These innovations widen service menus and drive organic growth in the Hazardous Waste Management Market.
Hazardous Waste Management Industry Leaders
Veolia Environnement SA
Waste Management Inc.
Clean Harbors Inc.
Suez SA
Republic Services Inc.
- *Disclaimer: Major Players sorted in no particular order

Recent Industry Developments
- January 2025: General Atomics began demonstrating its industrial SCWO system at Clean Earth’s North Carolina site under a Department of Defense contract, achieving 99.99% PFAS destruction efficiency.
- January 2025: Basel Convention e-waste amendments took effect, reclassifying contaminated electronic waste as hazardous and forcing domestic treatment expansion.
- December 2024: Redwood Materials committed USD 1 billion to enlarge its Nevada battery-recycling plant to 100 GWh capacity by 2026.
- November 2024: Veolia finalized a USD 14.3 billion purchase of Suez’s European waste assets, cementing its position as the region’s largest integrated provider.


Research Methodology Framework and Report Scope
Market Definitions and Key Coverage
Our study defines the hazardous waste management market as the worldwide revenue earned when regulated wastes that are toxic, flammable, corrosive, reactive, infectious, or radioactive are collected, stored, transported, treated, disposed of, or recycled through secure facilities. It tracks solid, liquid, and sludge streams handled by collection fleets, transfer stations, physico-chemical plants, high-temperature incinerators, biotreatment units, energy-recovery kilns, and engineered landfills.
Scope exclusion: routine municipal solid waste and inert construction debris that fall outside hazardous classifications are not counted.
Segmentation Overview
- By Physical State
- Solid
- Liquid
- Sludge
- By Waste Category
- Chemical Waste (Industrial)
- E-Waste (batteries, etc)
- Biomedical / Clinical Waste
- Radioactive Waste
- Others (Flammable & Explosive Waste, Corrosive & Oxidising Waste)
- By Treatment/ Disposal Method
- Physico-Chemical Treatment (Neutralisation, Precipitation, Stabilisation, Solidification, Oxidation, etc)
- Thermal Treatment (Incineration, Plasma Arc, Pyrolysis)
- Biological Treatment (Anaerobic, Composting)
- Landfill
- Recycling & Resource Recovery
- Others (Encapsulation, Deep-Well, etc)
- By Service
- Collection & Transportation
- On-site Storage
- Treatment & Disposal
- Consulting, Audit & Training
- By Industry
- Oil & Gas
- Chemical & Petrochemical Manufacturing
- Healthcare & Pharmaceuticals
- Mining & Metallurgy
- Power Generation (Coal, Nuclear)
- Construction & Demolition
- Automotive & General Manufacturing
- Electronics & E-waste Recycling
- Others (marine, municipal, agriculture, etc.)
- By Geography
- North America
- United States
- Canada
- Mexico
- South America
- Brazil
- Argentina
- Rest of South America
- Asia-Pacific
- China
- India
- Japan
- South Korea
- ASEAN (Indonesia, Thailand, Philippines, Malaysia, Vietnam)
- Australia
- Rest of Asia-Pacific
- Europe
- Germany
- United Kingdom
- France
- Italy
- Spain
- BENELUX (Belgium, Netherlands, and Luxembourg)
- NORDICS (Denmark, Finland, Iceland, Norway, and Sweden)
- Rest of Europe
- Middle East & Africa
- Saudi Arabia
- United Arab Emirates
- Qatar
- Turkey
- South Africa
- Nigeria
- Egypt
- Rest of Middle East and Africa
- North America
Detailed Research Methodology and Data Validation
Primary Research
Fortnightly calls and structured surveys with regulators, treatment operators, fleet managers, and industrial EHS heads in North America, Europe, China, India, and the Gulf validated pricing bands, capacity use, and planned regulation, which sharpened assumptions that literature alone could not resolve.
Desk Research
We began with open data from the US EPA, Eurostat, the Basel Convention shipment database, OECD Environment Statistics, and the World Bank, and then broadened coverage to trade-body bulletins such as ISWA and national environment ministries. Regulatory filings, company 10-Ks, investor decks, patent archives, and respected science journals filled technical gaps. To profile financials and news, we accessed D&B Hoovers and Dow Jones Factiva, and this list is illustrative and supplemented by several other sources that informed data checks and context.
Market-Sizing & Forecasting
We rebuilt the 2025 baseline top-down: country hazardous waste arisings (tons) were multiplied by average compliant handling charges and adjusted for cross-border trade. Bottom-up spot checks on operator revenue, tender values, and sampled ASP × volume pairs anchored the totals. Key inputs include industrial production, battery and pharmaceutical output, incinerator capacity additions, fee escalation indices, and shipment permit data. A multivariate regression, stress tested through scenario analysis, projects demand to 2030, while gaps in low-visibility regions are bridged with calibrated proxy ratios from comparable economies.
Data Validation & Update Cycle
Outputs pass two analyst reviews; variance thresholds trigger re-contact with sources, and models refresh each year, with mid-cycle updates when material policy or capacity shifts occur.
Why Mordor's Hazardous Waste Management Baseline Earns Decision Maker Trust
Published estimates often diverge because firms slice the market differently and apply uneven refresh rates.
Key gap drivers include narrower service coverage, exclusion of trade flows, and static fee assumptions used by some publishers, whereas we report the full cradle to grave value chain and update annually.
Benchmark comparison
| Market Size | Anonymized source | Primary gap driver |
|---|---|---|
| USD 52.94 bn (2025) | Mordor Intelligence | Baseline |
| USD 17.64 bn (2024) | Global Consultancy A | Counts treatment only and omits collection plus advisory revenue |
| USD 41.56 bn (2024) | Regional Consultancy B | Uses static ASPs and ignores cross-border waste exports |
These contrasts show that Mordor analysts deliver a balanced, transparent baseline tied to clear variables and repeatable steps, giving stakeholders a figure they can rely on.


Key Questions Answered in the Report
What is the current size of the hazardous waste management market?
The market is valued at USD 56.40 billion in 2026.
How fast will the market grow through 2031?
It is projected to register a 6.54% CAGR, reaching USD 77.42 billion.
Which region leads in market share?
Asia-Pacific holds 40.24% of global revenue and will maintain a 6.80% CAGR to 2031.
Which treatment method is expanding the quickest?
Recycling and resource recovery is rising at a 10.9% CAGR between 2026 and 2031.
Which industry segment shows the fastest growth?
Electronics and e-waste generators are forecast to grow at a 10.3% CAGR through 2031.
What technologies face supply shortfalls?
Commercial-scale PFAS destruction systems remain scarce, with fewer than ten plants operating worldwide.
Page last updated on:


