Plastic Waste Management Market Size and Share
Market Overview
| Study Period | 2020 - 2031 |
|---|---|
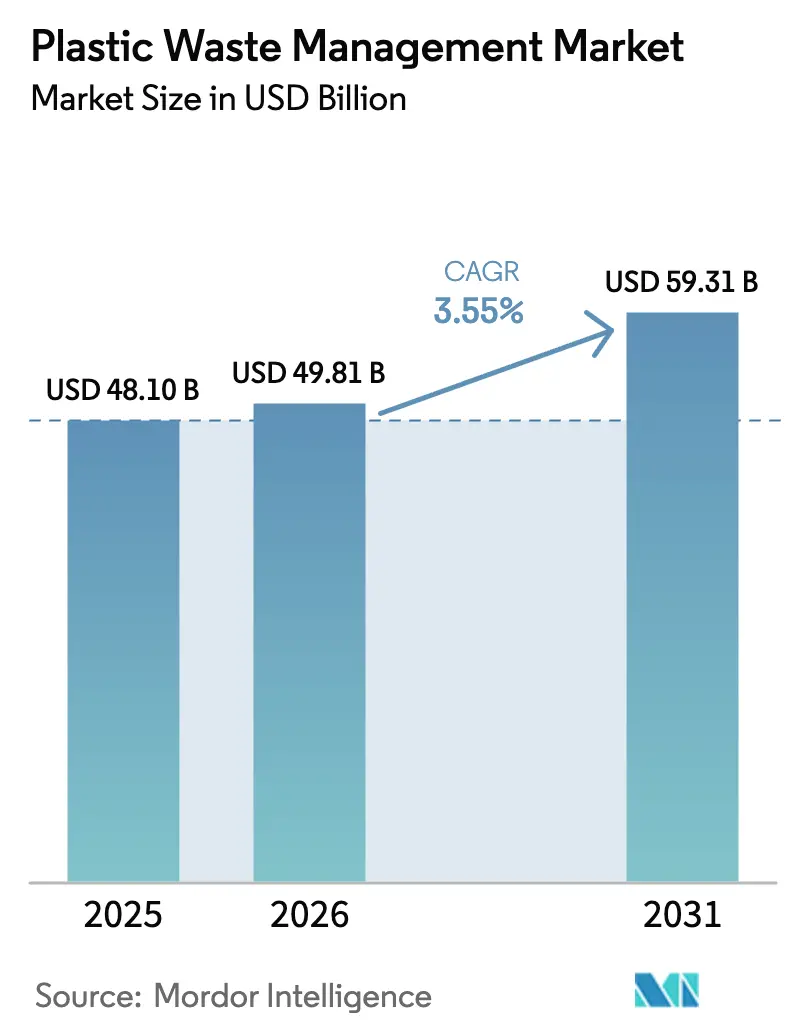
| Market Size (2026) | USD 49.81 Billion |
| Market Size (2031) | USD 59.31 Billion |
| Growth Rate (2026 - 2031) | 3.55% CAGR |
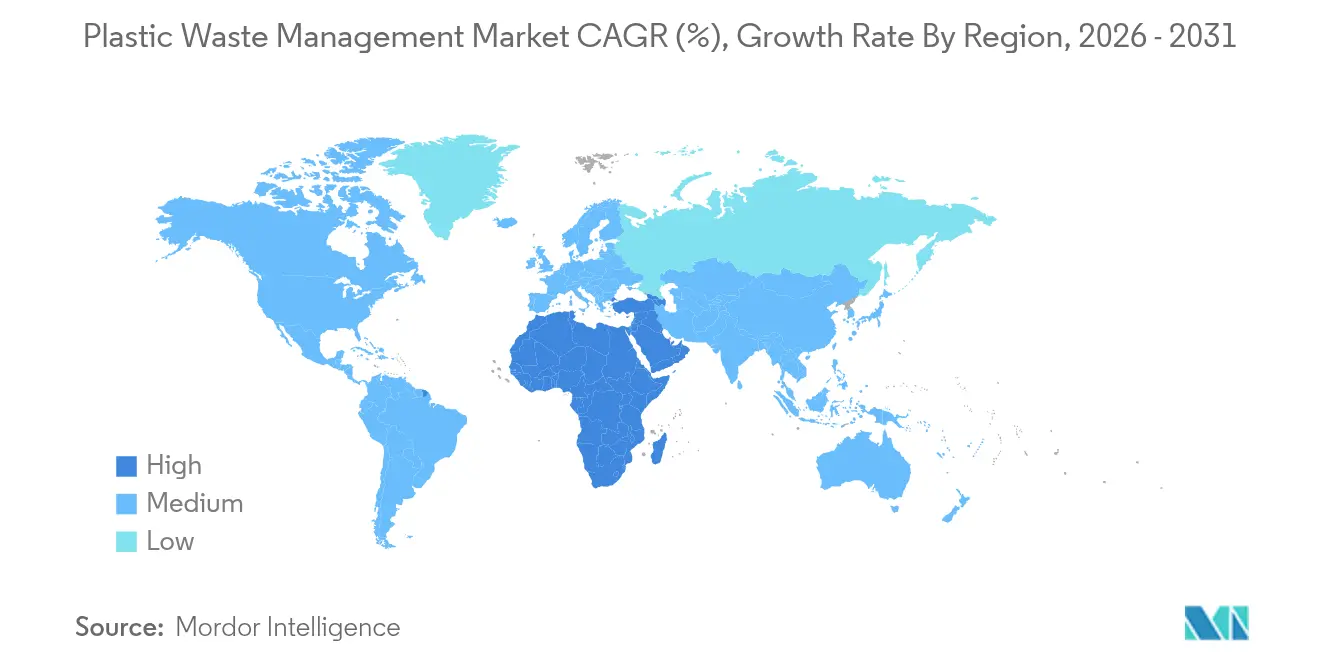
| Fastest Growing Market | Middle East and Africa |
| Largest Market | Asia Pacific |
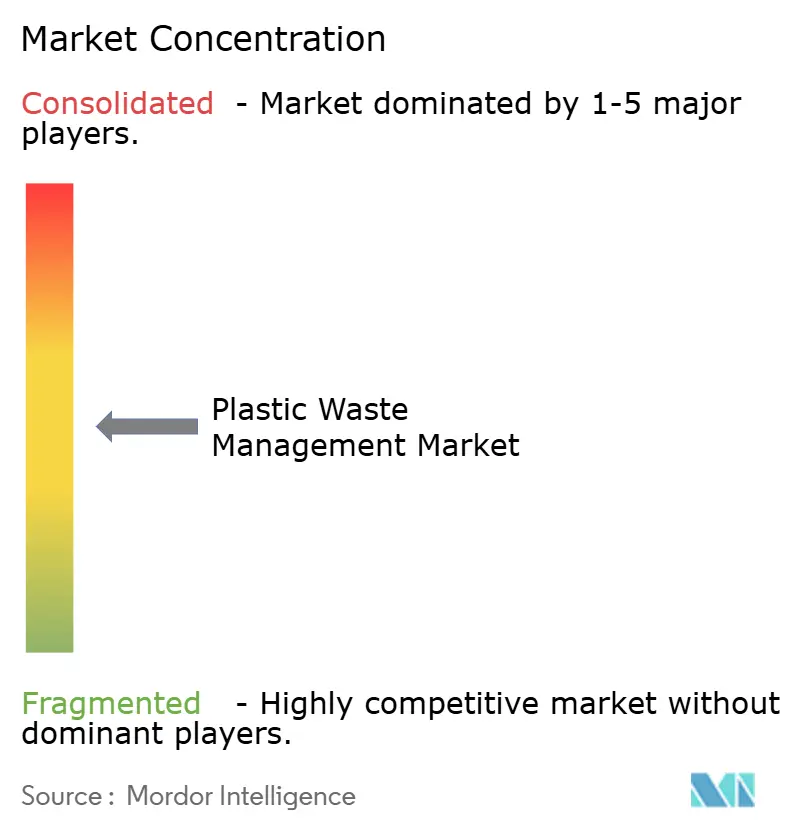
| Market Concentration | Medium |
Major Players
*Disclaimer: Major Players sorted in no particular order Image © Mordor Intelligence. Reuse requires attribution under CC BY 4.0. |
|
Plastic Waste Management Market Analysis by Mordor Intelligence
The Plastic Waste Management Market size is expected to grow from USD 48.10 billion in 2025 to USD 49.81 billion in 2026 and is forecast to reach USD 59.31 billion by 2031 at 3.55% CAGR over 2026-2031.
Tightening regulations, notably Extended Producer Responsibility (EPR) schemes across more than 25 jurisdictions, are pushing stakeholders to redesign packaging and invest in recovery systems that meet recycled-content mandates. Asia-Pacific retains the highest regional demand as well as the largest installed recycling base, while the Middle East and Africa outpace other regions as governments adopt ambitious landfill-diversion targets. Investment momentum is shifting from traditional disposal toward advanced chemical recycling, supported by private “circularity” funds and corporate off-take agreements that de-risk new capacity. On-site AI-powered optical sorters are cutting Material Recovery Facility operating costs by up to 25%, improving feedstock quality and bolstering recyclate margins even when virgin polymer prices soften.
Key Report Takeaways
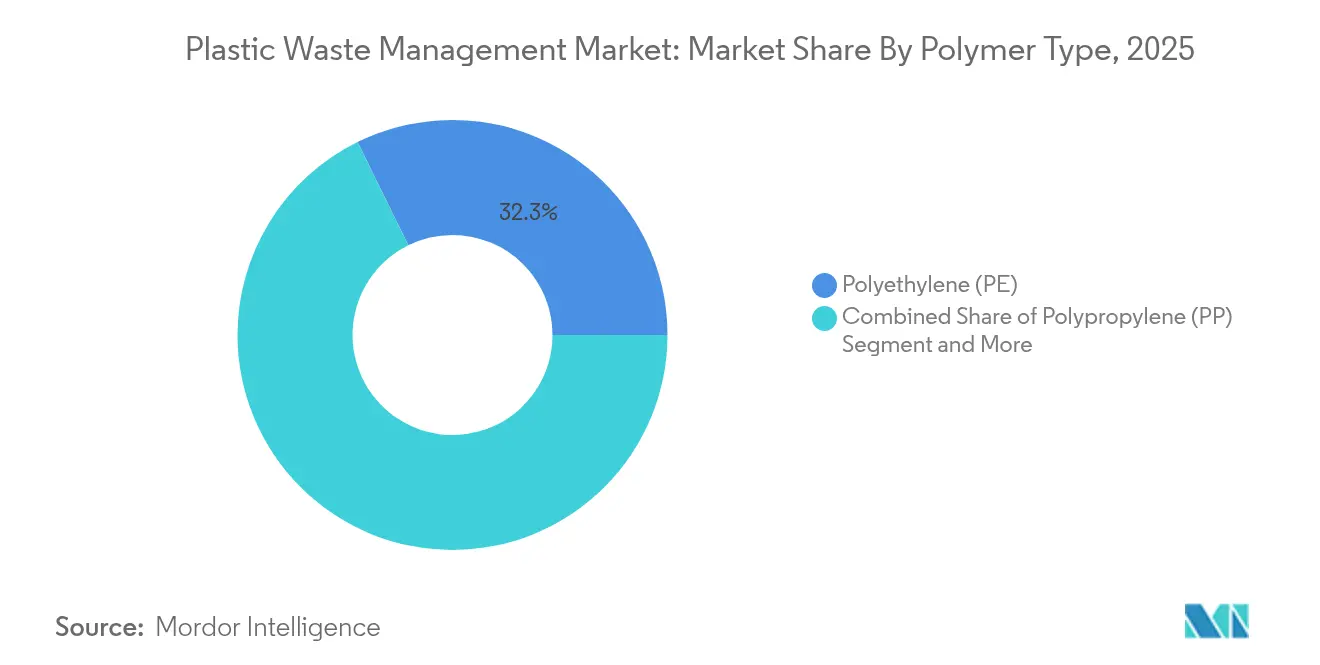
- By polymer type, polyethylene captured 32.28% of the plastic waste management market share in 2025; polyethylene terephthalate (PET) is forecast to expand at a 5.82% CAGR to 2031.
- By source, industrial generators held 51.74% of the plastic waste management market in 2025, whereas residential collection is the fastest-growing stream at 6.08% CAGR through 2031.
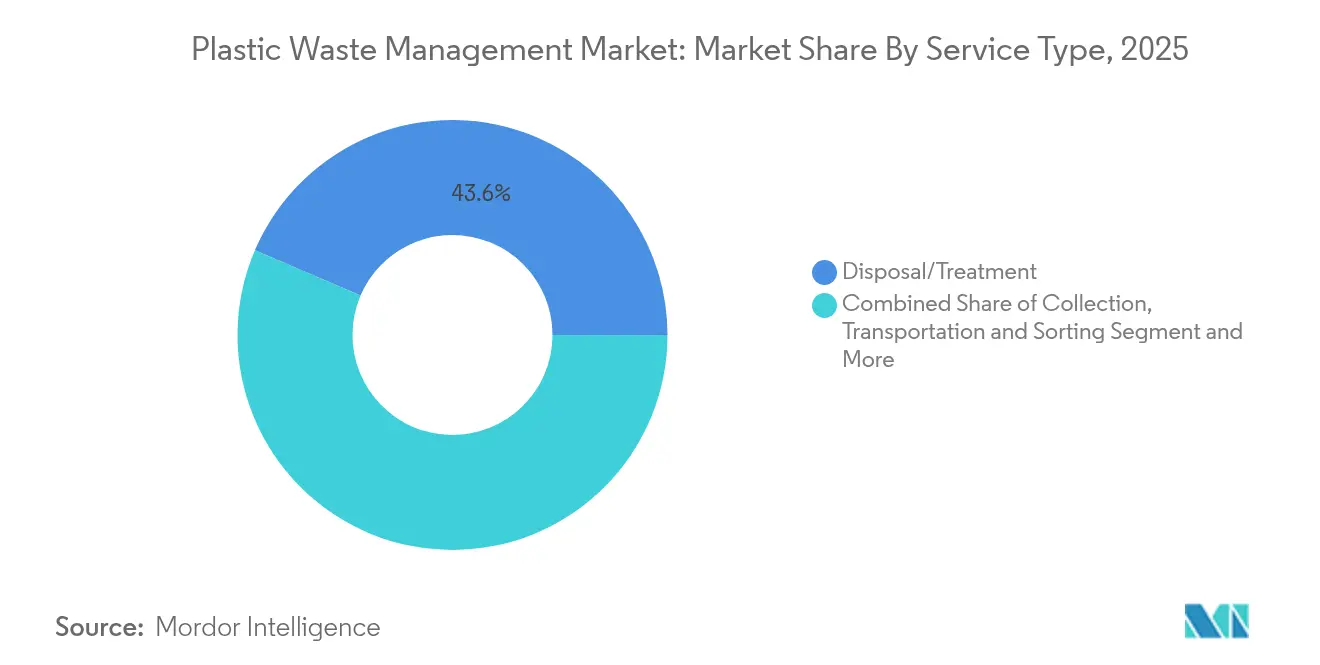
- By service type, disposal and treatment dominated with 43.55% revenue share in 2025, while chemical recycling records the highest projected CAGR at 6.76% to 2031.
- By end-use industry, packaging accounted for 58.72% of the plastic waste management market size in 2025; automotive applications led growth at 6.39% CAGR.
- By geography, Asia-Pacific led with 40.21% revenue share in 2025, and the Middle East and Africa segment is advancing at a 6.09% CAGR to 2031.
Note: Market size and forecast figures in this report are generated using Mordor Intelligence’s proprietary estimation framework, updated with the latest available data and insights as of 2026.
Global Plastic Waste Management Market Trends and Insights
Drivers Impact Analysis*
| Driver | (~) % Impact on CAGR Forecast | Geographic Relevance | Impact Timeline |
|---|---|---|---|
| EPR mandates accelerating fee-based collection in EU and Canada | +0.8% | EU, Canada, expanding to US states | Medium term (2-4 years) |
| China’s ban on low-grade scrap imports boosting domestic recycling margins | +0.6% | Asia-Pacific core, spill-over to MEA | Long term (≥ 4 years) |
| Rapid scale-up of advanced recycling facilities in the US Gulf Coast | +0.5% | North America, technology transfer globally | Medium term (2-4 years) |
| Corporate-backed circularity funds de-risking infrastructure projects | +0.4% | Global, concentrated in developed markets | Long term (≥ 4 years) |
| AI-driven optical sorting lines cutting MRF operating costs | +0.3% | Global, faster adoption in high-labor-cost regions | Short term (≤ 2 years) |
| FMCG redesign toward mono-material flexible packaging lifting recoverable volumes | +0.2% | Global, led by EU regulatory pressure | Medium term (2-4 years) |
| Source: Mordor Intelligence | |||
Extended Producer-Responsibility (EPR) Mandates Accelerating Fee-based Collection in EU & Canada
EPR systems are reshaping economics by shifting collection and processing costs onto producers, creating direct incentives to reduce material weight and increase recycled content. The EU regulation, effective February 2025, sets a 30% recycled-PET requirement for food packaging by 2030, while Canadian provinces such as British Columbia already record 79.6% recovery rates under mature schemes. Emerging US state programs in California, Minnesota, and others mirror this approach, signalling continent-wide convergence. Producers now budget for compliance fees alongside raw-material purchasing, making design-for-recycling and closed-loop sourcing central to cost control and brand reputation.
China’s Ban on Low-grade Scrap Imports Boosting Domestic Recycling Margins in Asia
China’s 2017 prohibition on most plastic scrap imports forced exporters to improve bale purity or divert shipments elsewhere, simultaneously widening domestic profit margins for licensed recyclers. The State Council’s circular-economy plan targets 4.5 billion tons of annual resource recycling by 2025, and PET beverage containers already achieve 96.48% recovery. Regional hubs in Guangdong and Zhejiang sell flakes into both domestic packaging and export markets, demonstrating that higher local feedstock prices can coexist with global arbitrage opportunities. Neighboring ASEAN members have responded with quality standards to avoid becoming low-grade dumps, reinforcing regional capacity build-out[1]National Development and Reform Commission, “Special Report on Plastic Pollution Control, 2024,” Government of China, ndrc.gov.cn.
Rapid Scale-up of Advanced (Pyrolysis & Solvolysis) Recycling Facilities in U.S. Gulf Coast
Abundant feedstock, supportive state incentives, and collocation with petrochemical assets make the Gulf Coast a hotspot for chemical recycling. Clean Vision Corporation’s USD 50 million West Virginia plant converts 100–500 tons daily into recycled-plastics precursors and hydrogen. Similar projects leverage shared utilities and off-take agreements with resin producers, though project delays—such as the cancelled USD 300 million Pennsylvania plant—show financing risk when feedstock contracts or credit support fall through. As technology moves beyond pilot scale, successful operators secure multi-year supply guarantees and qualify outputs for food-contact or fuel specifications.
Corporate-backed Circularity Funds De-risking Infrastructure Projects
Specialist investment vehicles channel private capital into high-capex recycling assets by offering blended returns tied to environmental performance. The Future of Plastics Fund seeks a USD 109 million final close and has already backed Greyparrot’s AI waste-recognition software that improves MRF sort purity. The World Bank’s USD 100 million Plastic Waste Reduction-Linked Bond finances plants in Ghana and Indonesia, tying coupons to verified plastic-credit output. Investors view secured EPR fee income and guaranteed recycled-content demand as quasi-infrastructure cash flows, mitigating commodity-price swings.
Restraints Impact Analysis*
| Restraint | (~) % Impact on CAGR Forecast | Geographic Relevance | Impact Timeline |
|---|---|---|---|
| Plastic overproduction and overconsumption strain waste management, hindering recycling and circular economy efforts | -0.7% | Global, acute in emerging markets | Long term (≥ 4 years) |
| Negative netbacks for recycled PE & PP when Brent < USD 55/bbl | -0.5% | Global, most severe in oil-producing regions | Short term (≤ 2 years) |
| High contamination (> 12%) in curb-side streams limiting mechanical recyclate quality | -0.4% | Global, pronounced in North America and Europe | Short term (≤ 2 years) |
| Carbon-tax exemptions for incineration undercutting recycling economics in Nordics | -0.3% | Northern Europe (Norway, Sweden, Denmark, Finland, Iceland) | Medium term (2-4 years) |
| Source: Mordor Intelligence | |||
Plastic Overproduction and Overconsumption Strain Waste Management, Hindering Recycling and Circular-economy Efforts
Global polymer output hit 400.3 million tons in 2022 and could double by 2035, overwhelming existing collection networks and depressing recyclate prices when supply outpaces end-market demand. Only 9% of plastic waste is recycled worldwide, with 22% mismanaged in Africa, where 65% of marine leakage originates. Overcapacity also lowers virgin-polymer prices, undermining recycled-content economics absent policy-mandated offtake.
Negative Netbacks for Recycled PE & PP When Brent Less Than USD 55/barrel
Recycled polyethylene and polypropylene struggle to compete with virgin resin when crude oil slips below USD 55 per barrel. Mechanical recyclers in Europe reported costs of USD 608–790 per metric ton (converted from EUR) at times when virgin prices sat lower, eroding margins. Carbon-tax exemptions on waste-to-energy incineration in Nordic markets amplify the problem by making energy recovery a cheaper outlet, driving Norway’s incineration rate to 65% in 2024.
*Our forecasts treat driver/restraint impacts as directional, not additive. The impact forecasts reflect baseline growth, mix effects, and variable interactions.
Segment Analysis
By Polymer Type: PET Growth Accelerates While PE Keeps the Lead
Polyethylene held 32.28% of plastic waste management market share in 2025, reflecting its dominance in flexible and rigid packaging streams. Robust curbside programs and widespread mechanical-recycling infrastructure support steady volumes. Yet PET is the fastest-growing polymer segment, expanding at a 5.82% CAGR on the back of bottle-to-bottle mandates such as the EU’s 30% recycled-content rule by 2030. China’s closed-loop system already recovers 96.48% of PET beverage bottles, creating high-quality flake for domestic converters. As more food-grade depolymerization plants come on stream, PET positions itself as the preferred material for high-specification recycling applications.
Demand dynamics go beyond regulation. PET’s chemical structure allows solvent-based depolymerization that returns resin to monomer purity, facilitating infinite reuse without property loss. Polypropylene and polystyrene lag because of contamination and limited end-markets, while PVC recycling gains traction through AI-assisted pre-sorting systems and high-efficiency shredders. Technology developers now target mixed-polymer pyrolysis that yields hydrocarbons for refinery feedstocks or hydrogen co-products. Such diversification may temper PE’s lead, but its scale and low-cost collection ensure continued relevance in the plastic waste management market.


By Source: Industrial Streams Dominate but Residential Waste Gains Pace
Industrial generators contributed 51.74% of total plastic waste volumes in 2025, benefiting from homogenous material flows and lower contamination. Manufacturing off-cuts, distribution film, and pre-consumer scrap feed specialized plants that achieve higher recovery yields and enjoy predictable input pricing. Residential waste streams are projected to grow fastest at 6.08% CAGR through 2031, as municipalities roll out standardized bins, anti-contamination education, and smart cameras. King County’s pilot reduced contamination below the critical 12% threshold, unlocking higher bale values.
Residential expansion is underpinned by EPR fee revenue that finances household collection upgrades. Smart-sensor trials in Rhode Island cut rejected tonnage, saving taxpayers millions in hauling charges. Industrial streams will still command premium contracts because scale simplifies logistics, yet the broadest tonnage uplift will come from homes as digital route optimization reduces the per-household cost of collection. The plastic waste management market, therefore, pivots toward solutions that reconcile small-lot pick-ups with material purity standards.
By Service Type: Chemical Recycling Challenges the Status Quo
In the plastic waste management market, disposal and treatment services accounted for 43.55% of 2025 revenue, covering mechanical recycling, waste-to-energy, and sanitary landfills. However, chemical recycling is forecast to rise at 6.76% CAGR to 2031, the highest of any service category, as pyrolysis and solvolysis plants scale from pilot to commercial. Advanced reactors break polymer chains to produce naphtha, diesel, or monomers, overcoming the down-cycling ceiling of mechanical methods. Policy momentum, such as US state legislation classifying chemical recycling as manufacturing, expedites permitting and investment.
Mechanical recycling retains a role for high-purity streams in the plastic waste management market, but feedstock availability fluctuates with contamination levels. Incineration remains a fallback, particularly in regions with landfill constraints or carbon-credit incentives for energy recovery. Landfill disposal faces mounting fees and outright bans on recyclable plastics. The emerging service hierarchy favours integrated players that can blend mechanical and chemical routes, hedge against oil-price swings, and offer offtake guarantees to brand owners craving recycled content.
By End-use Industry: Automotive Growth Challenges Packaging Hegemony
Packaging absorbed 58.72% of plastic waste in 2025 due to short life cycles and stringent EPR coverage within the plastic waste management market. Regulators push for mono-material formats and recycled-content thresholds that secure end-market demand for rPET and rPE. In contrast, automotive polymers are poised for the fastest growth at 6.39% CAGR through 2031 as OEMs pursue lightweight components and battery-housing solutions that tolerate high-recycled content without compromising structural integrity.
Electrification amplifies this push because every kilogram saved extends vehicle range. Recycled polypropylene compounds and polyethylene foam enter under-hood and interior applications, while chemical-recycled polyamides enable high-heat parts. Construction and consumer-goods segments provide additional outlets for lower-grade recyclate, yet their uptake hinges on building-code acceptance and cosmetic requirements. Packaging is unlikely to cede its top slot soon, but diversification into mobility, textiles, and E&E broadens revenue pools for the plastic waste management market.
Geography Analysis
Asia-Pacific generated 40.21% of global revenue in 2025 and remains the anchor of the plastic waste management market. China’s circular-economy policies aim for 4.5 billion tons of annual resource recycling by 2025, and India’s July 2025 barcode mandate improves producer accountability. Japan posts an 11% reduction in plastic waste but still needs stricter enforcement to hit 2030 benchmarks. Indonesia relies on community “waste banks” and private haulers to tackle its 58% uncollected rate, while Vietnam’s pilot circular-city programs showcase integrated collection and treatment paths. Foreign direct investment flows into regional hubs where high bale prices offset infrastructure risk, maintaining Asia’s leadership despite rising compliance costs.
The Middle East and Africa segment in the plastic waste management market holds the fastest growth trajectory at 6.09% CAGR to 2031. Saudi Arabia’s Vision 2030 targets 94% landfill diversion, supported by more than 840 treatment centers and a plan to divide waste management into 25 regional clusters. Egypt formally enacted EPR on shopping bags in March 2025, spurring private-sector sorting and pelletizing projects. The UAE’s single-use plastic ban, effective January 2025, adds tariffs on carrier bags and imposes data-reporting duties. Africa overall recycles only 9% of its plastic, but donor-funded projects and rising urban-waste tipping fees create a medium-term runway for technology transfer.
Europe sustains regulatory leadership through the Packaging and Packaging Waste Regulation that demands all packaging be recyclable by 2030 and sets a 30% rPET threshold. Harmonized EPR fees across member states cut administrative burdens and fund trans-frontier waste-tracking systems. Canada mirrors success with British Columbia’s 79.6% recovery under full producer funding, and Alberta’s framework goes live in April 2025. In the United States, the EPA’s National Strategy to Prevent Plastic Pollution presses voluntary action but also encourages state-level EPR adoption. Cross-border material flows adjust as exporters seek high-quality bale outlets after China’s import ban, underscoring the plastic waste management market’s shift toward localized circular loops.
Mordor Intelligence provides coverage of the plastic waste management market across other key regional markets, including North America, Asia, and Europe, each with their regulatory frameworks and demand patterns. Detailed country-level analysis extends to India incorporating local coverage and market participation, as required.

Competitive Landscape
Competition in the plastic waste management market is moderate, with national waste-management majors, specialized recyclers, and technology startups each staking territory. Veolia and Waste Management Inc. leverage route density and landfill ownership to offer turnkey collection-to-processing packages. TOMRA and Pellenc supply vision-sorting hardware that integrates AI upgrades capable of 99.99% accuracy, letting processors command premium bale pricing. Chemical-recycling pioneers such as Plastic Energy and Agilyx license depolymerization processes to resin producers seeking scope-3 emissions cuts, often backed by multiyear offtake contracts that stabilize cash flow.
Strategic alliances define 2025 playbooks. Brightmark collaborates with oil majors to co-site feedstock-flexible pyrolysis units within refinery complexes, reducing logistics cost and tapping existing hydrogen supplies. Packaging converters like DS Smith and Borealis sign up for closed-loop agreements that guarantee recycled-content volumes, locking in input security amid volatile bale markets. Corporate venture arms funnel capital into AI-enabled robotics for downstream quality control, echoing Greyparrot’s funding from the Future of Plastics Fund.
Regional consolidation accelerating in the plastic waste management market as midsized operators struggle with new EPR reporting and contamination penalties. Republic Services’ acquisition of several local haulers expands its West Coast collection footprint, feeding its polymers center in Las Vegas. In emerging markets, firms partner with local municipalities to secure exclusivity over curbside rollout in exchange for infrastructure investments. Patent filings cluster around solvent-based recycling, contamination-detection algorithms, and carbon-capture-equipped waste-to-energy, underscoring the sector’s technology race.
Plastic Waste Management Industry Leaders
-
Veolia Environment
-
SUEZ Environment
-
Waste Management, Inc.
-
Republic Services, Inc.
-
Clean Harbors Inc.
- *Disclaimer: Major Players sorted in no particular order

Recent Industry Developments
- March 2025: California Governor Gavin Newsom reopens EPR rule-making to address cost concerns prior to final adoption.
- March 2025: Egypt implements mandatory EPR for shopping bags as part of national waste-reduction strategy.
- February 2025: EU Packaging and Packaging Waste Regulation enters into force, setting 2030 recyclability and content targets.
- January 2025: India mandates barcode or QR codes on plastic packaging from July 2025 to support traceability.


Research Methodology Framework and Report Scope
Market Definitions and Key Coverage
Our study defines the plastic waste management market as all organized activities that collect, transport, sort, treat, recycle, recover energy from, or safely dispose of post-consumer and post-industrial plastic materials across residential, commercial, construction, and industrial streams. These activities also include supporting technologies such as sensor-based sorting, advanced recycling reactors, engineered landfills, and waste-to-energy facilities; every step that turns discarded plastics into usable feedstock, energy, or stable residues.
Scope Exclusions: We exclude services focused solely on non-plastic municipal solid waste, hazardous medical waste, and informal backyard recycling operations that lack traceable financial records.
Segmentation Overview
-
By Polymer Type
- Polyethylene (PE)
- Polypropylene (PP)
- Polyethylene Terephthalate (PET)
- Polystyrene (PS)
- Polyvinyl Chloride (PVC)
- Other Polymers (ABS, PA, etc.)
-
By Source
- Industrial
- Commercial (Retail & Office)
- Residential
- Construction & Demolition
- Others(Institutional, Healthcare, Curb-side waste, etc.))
-
By Service Type
- Collection, Transportation & Sorting
-
Disposal/ Treatment
- Mechanical Recycling
- Chemical / Advanced Recycling
- Incineration with Energy Recovery
- Controlled Landfilling
- Others (Consulting, Audit & Training, etc.)
-
By End-Use Industry
- Packaging
- Construction
- Automotive & E-Mobility
- Electrical & Electronics
- Textiles & Fashion
- Healthcare
- Others (Agriculture, Consumer Goods, etc.)
-
By Geography
-
North America
- United States
- Canada
- Mexico
-
South America
- Brazil
- Argentina
- Peru
- Rest of South America
-
Europe
- United Kingdom
- Germany
- France
- Italy
- Spain
- BENELUX (Belgium, Netherlands, and Luxembourg)
- NORDICS (Denmark, Finland, Iceland, Norway, and Sweden)
- Rest of Europe
-
Asia-Pacific
- China
- India
- Japan
- Australia
- South Korea
- ASEAN (Indonesia, Thailand, Philippines, Malaysia, Vietnam)
- Rest of Asia-Pacific
-
Middle East and Africa
- Saudi Arabia
- United Arab Emirates
- Qatar
- Kuwait
- Turkey
- Egypt
- South Africa
- Nigeria
- Rest of Middle East and Africa
-
North America
Detailed Research Methodology and Data Validation
Primary Research
To validate desk findings, we interview municipal waste operators, integrated recyclers, landfill managers, equipment makers, and policy specialists in Asia-Pacific, Europe, North America, and the Middle East. These discussions clarify local collection efficiencies, treatment costs, and upcoming regulations, enabling us to fine-tune adoption curves and price assumptions.
Desk Research
We start by gathering baseline figures from globally recognized, open datasets such as UNEP's Global Plastics Outlook, OECD waste statistics, Eurostat's treatment volumes, United States EPA Facts & Figures, and Customs trade flows under HS-39. These sources give us generation volumes, polymer splits, and treatment pathways. Company 10-Ks, sustainability reports, and association portals like PlasticsEurope fill revenue, capacity, and investment gaps. Where deeper financial intelligence is required, analysts access D&B Hoovers and Dow Jones Factiva. The sources listed are illustrative only; many additional public and proprietary references inform the evidence pool.
Market-Sizing & Forecasting
A top-down approach reconstructs market revenue by linking national plastic consumption, documented waste generation rates, and capture factors; results are then sense-checked through selective bottom-up supplier roll-ups and channel checks. Key variables include per-capita plastic use, formal collection coverage, average tipping fees, virgin and recycled resin price spreads, extended producer responsibility charges, and capital spending on recycling infrastructure. Forecasts employ multivariate regression with scenario analysis, allowing us to stress-test how policy shifts or resin price swings may alter future values. Where bottom-up inputs are thin, we fill gaps with peer benchmarks and conservative elasticity factors vetted during expert calls.
Data Validation & Update Cycle
Model outputs pass through variance scans against external indicators, after which senior analysts review assumptions. Mordor Intelligence refreshes every study annually and issues interim updates when material events, such as policy bans, major capacity additions, or macro shocks, warrant a recalibration. A final pre-publication check ensures clients receive the most current view.
Why Mordor's Plastic Waste Management Baseline Deserves Your Confidence
Published estimates often diverge because firms adopt different service scopes, polymer baskets, currency year bases, and refresh cadences. Our analysts acknowledge these structural gaps upfront and design the study to minimize them.
Key gap drivers seen across the landscape include narrower service coverage that excludes chemical or energy recovery, reliance on single-year production proxies without waste-flow validation, or application of one blanket growth rate across all regions. We counter these issues through transparent scope setting, calibrated variables, and yearly model resets.
Benchmark comparison
| Market Size | Anonymized source | Primary gap driver |
|---|---|---|
| USD 48.10 B (2025) | Mordor Intelligence | |
| USD 37.95 B (2024) | Regional Consultancy A | Omits chemical recycling revenue and uses mid-2024 exchange rates |
| USD 38.85 B (2024) | Trade Journal B | Depends on production-side proxies without waste-generation reconciliation |
| USD 38.91 B (2024) | Global Consultancy C | Applies a universal CAGR and updates biennially |
The comparison shows that by selecting the right scope, refreshing figures every year, and cross-validating both volume and price drivers, we deliver a balanced, transparent baseline that decision-makers can trace back to clear variables and repeatable steps.


Key Questions Answered in the Report
What is the size of the plastic waste management market and how fast is it growing?
The market stands at USD 49.81 billion in 2026 and is projected to reach USD 59.31 billion by 2031, reflecting a 3.55% CAGR.
Which polymer type dominates the market and which one is expanding quickest?
Polyethylene leads with 32.28% share in 2025, while PET records the fastest growth at a 5.82% CAGR through 2031.
Which service segment is expected to post the highest growth rate?
Chemical recycling is forecast to advance at a 6.76% CAGR between 2026 and 2031, ahead of all other services.
Which region offers the strongest growth outlook?
The Middle East and Africa cluster is set to expand at a 6.09% CAGR from 2026-2031, outperforming all other regions.
How are Extended Producer Responsibility (EPR) regulations reshaping the industry?
EPR shifts collection and processing costs to producers, driving packaging redesign and securing demand for mandated 30% recycled-PET content in the EU by 2030.
What operational technology delivers the greatest cost savings in Material Recovery Facilities?
AI-driven optical sorters cut operating expenses by 18–25% while achieving up to 99.99% material-identification accuracy.
Page last updated on:


