Captive Portal Market Size and Share
Market Overview
| Study Period | 2019 - 2030 |
|---|---|
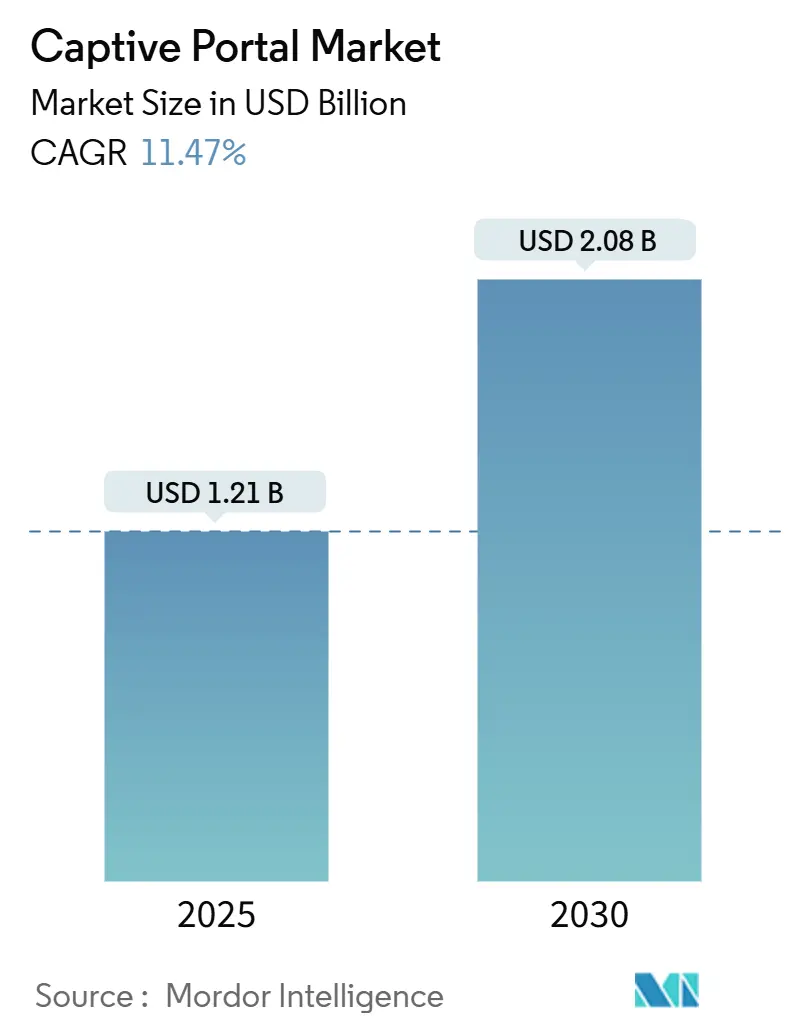
| Market Size (2025) | USD 1.21 Billion |
| Market Size (2030) | USD 2.08 Billion |
| Growth Rate (2025 - 2030) | 11.47% CAGR |
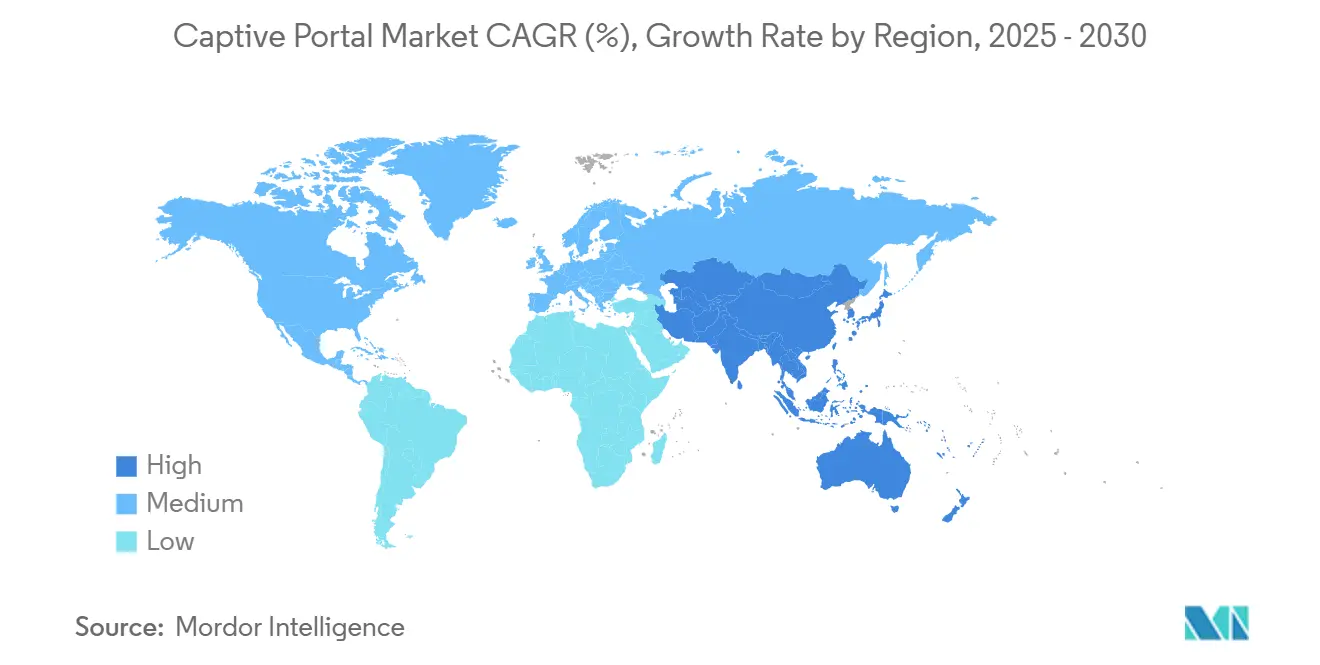
| Fastest Growing Market | Asia Pacific |
| Largest Market | North America |
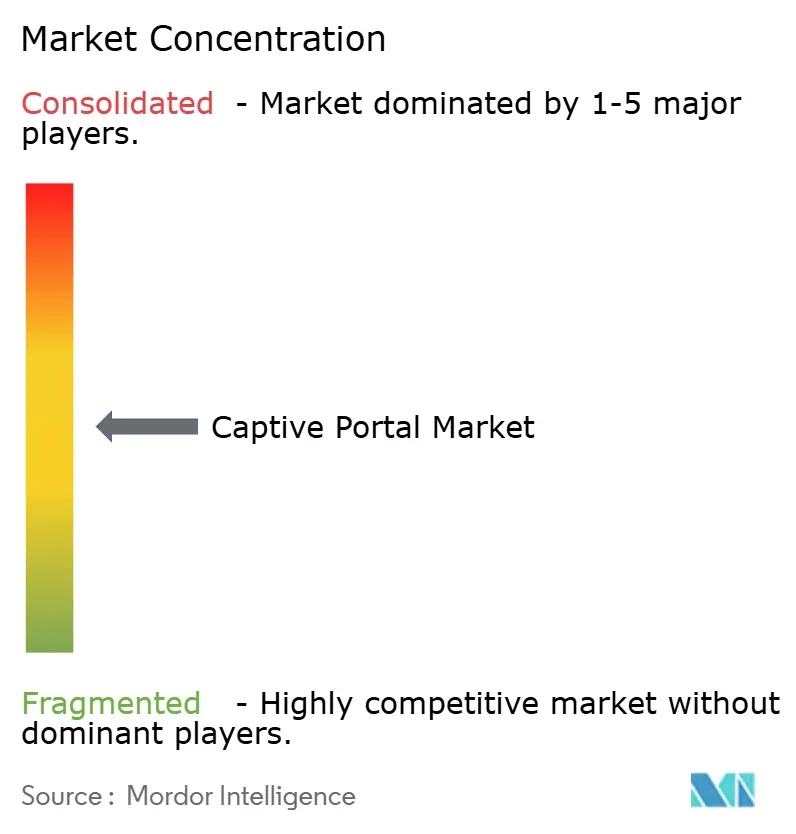
| Market Concentration | Medium |
Major Players *Disclaimer: Major Players sorted in no particular order Image © Mordor Intelligence. Reuse requires attribution under CC BY 4.0. | |
Captive Portal Market Analysis by Mordor Intelligence
The captive portal market size stood at USD 1.21 billion in 2025 and is forecast to reach USD 2.08 billion by 2030, expanding at an 11.47% CAGR. The surge is tied to accelerated cloud migration, regulatory identity-logging mandates, and soaring IoT onboarding needs that together are transforming network access models. Cloud-managed authentication platforms allow enterprises to unify security and marketing analytics, cut capital outlays, and scale across multiple sites. At the same time, Wi-Fi 6E/7 rollouts are fueling refresh cycles, while AI-driven analytics convert guest networks from cost centers to revenue engines. Competitive strategies revolve around feature depth, compliance readiness, and the ability to integrate with broader digital-transformation programs.
Key Report Takeaways
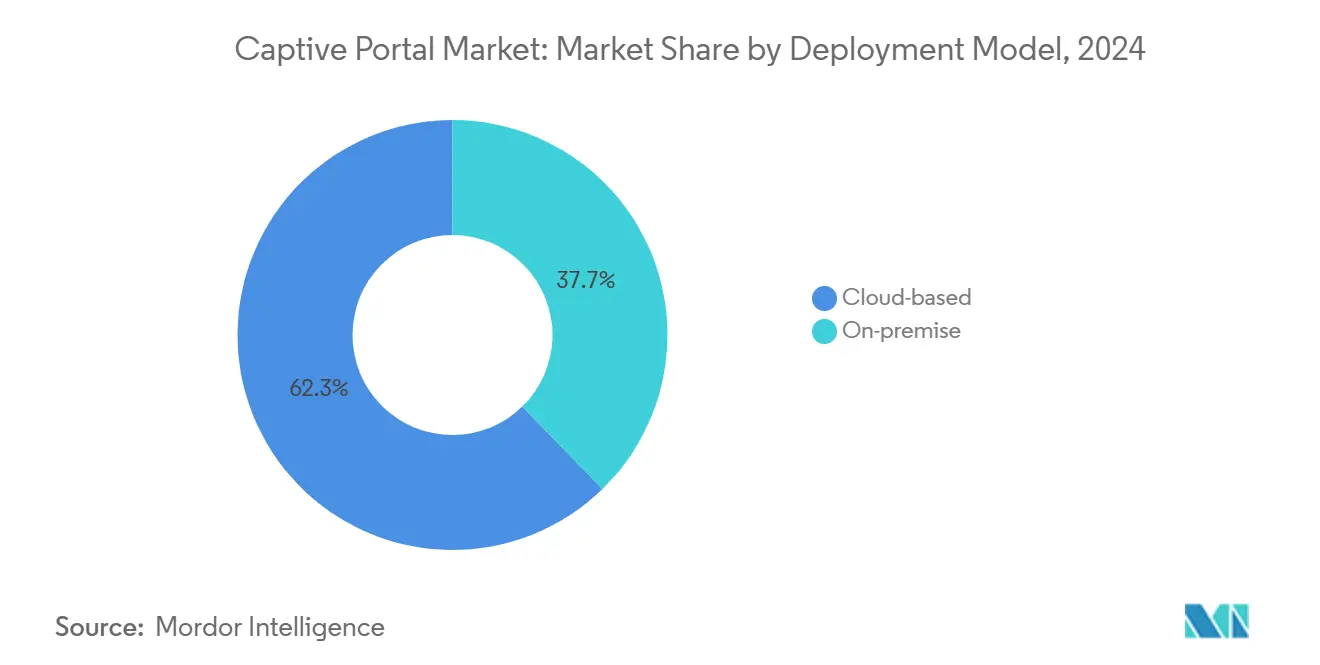
- By deployment model, cloud-based solutions captured 62.3% of the captive portal market share in 2024; the segment is advancing at a 13.4% CAGR through 2030.
- By authentication method, social-login accounted for 45.2% share of the captive portal market size in 2024, while Passpoint/OpenRoaming is registering the fastest growth at 15.8% CAGR to 2030.
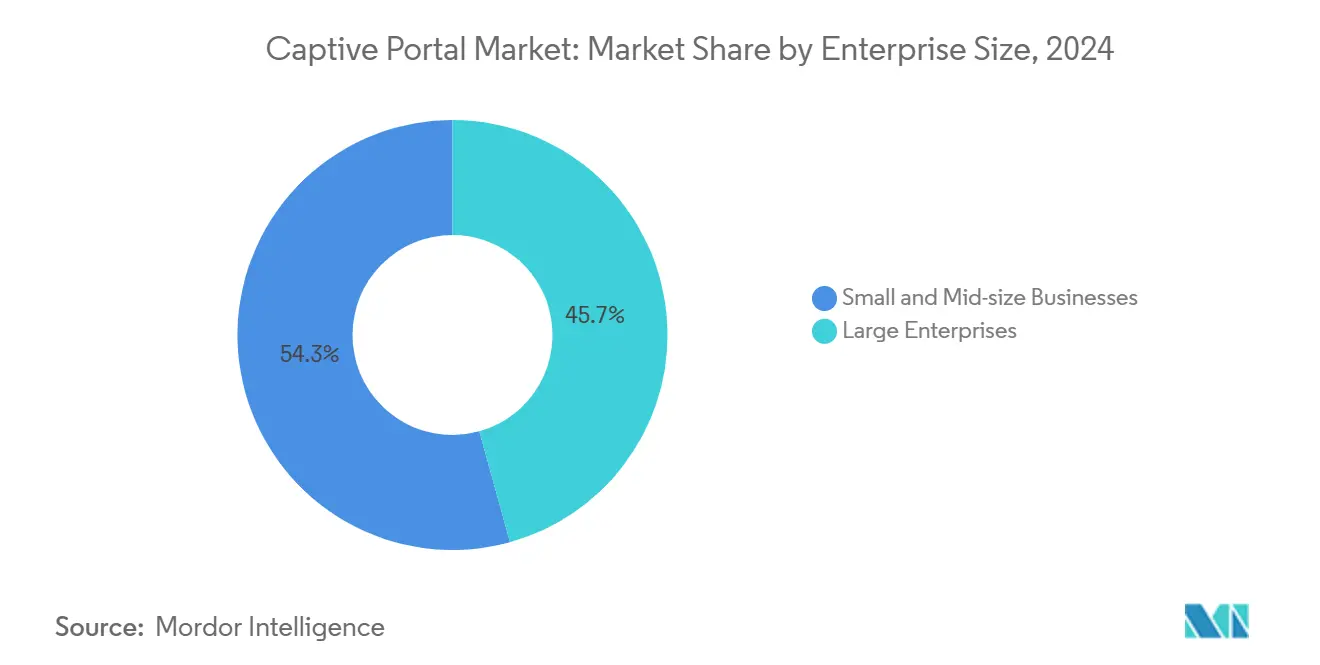
- By enterprise size, small and mid-size businesses held 54.3% of the captive portal market share in 2024 and are expanding at a 12.7% CAGR through 2030.
- By end-user industry, hospitality generated 38.2% of 2024 revenue, whereas transportation hubs are projected to grow at a 14.6% CAGR to 2030.
- By geography, North America led with 33.2% revenue share in 2024; Asia-Pacific is poised to outpace all regions at a 16.2% CAGR to 2030.
Global Captive Portal Market Trends and Insights
Drivers Impact Analysis*
| Driver | (~) % Impact on CAGR Forecast | Geographic Relevance | Impact Timeline |
|---|---|---|---|
| Rapid migration to cloud-managed Wi-Fi platforms | +2.8% | Global, with North America and the EU leading | Medium term (2-4 years) |
| Growth of guest Wi-Fi marketing and analytics demand | +2.1% | Global, concentrated in retail-heavy regions | Short term (≤ 2 years) |
| Regulatory mandates for identity logging (eIDAS, KYC Wi-Fi) | +1.9% | Europe primary, expanding to Asia-Pacific | Long term (≥ 4 years) |
| Upsurge in IoT devices needing secure onboarding | +2.3% | Global, with Asia-Pacific manufacturing hubs leading | Medium term (2-4 years) |
| Expansion of smart hospitality and retail digital journeys | +1.7% | Global, concentrated in urban centers | Short term (≤ 2 years) |
| 6 GHz Wi-Fi 6E/7 upgrades unlocking captive-portal refreshes | +1.4% | North America and EU early adopters | Long term (≥ 4 years) |
| Source: Mordor Intelligence | |||
Rapid migration to cloud-managed Wi-Fi platforms
Organizations are shifting from on-premise controllers to cloud services that deliver centralized policy management, automatic updates, and elastic scaling. Cisco’s transition guide from CMX to Spaces showcases improved GDPR compliance and feature velocity that eliminates hardware refresh cycles.[1]Cisco, “Guide to Migrating Location Services to Cisco Spaces,” cisco.com Smaller enterprises gain enterprise-grade capabilities without sizable capital spending, while multisite brands maintain consistent guest experiences. The resulting cost efficiency and operational agility are propelling sustained adoption.
Growth of guest-Wi-Fi marketing and analytics demand
Retailers and hoteliers now view captive portals as revenue drivers rather than cost lines. AI-powered platforms such as Cambium Networks’ Wiacom automate personalized offers, letting venues monetize foot-traffic data while staying within consent frameworks. High-traffic sites extract advertising value that offsets infrastructure spend, widening the total addressable base for vendors.
Regulatory mandates for identity logging
The European Digital Identity Regulation obliges cross-border electronic ID recognition by 2026, compelling enterprises to adopt portals that interoperate with EU Digital Identity Wallets. ETSI reports highlight inconsistent identity-proofing across member states, nudging buyers toward compliant, centrally managed solutions. Vendors able to navigate multi-jurisdictional requirements gain a durable advantage.
Upsurge in IoT devices needing secure onboarding
Global IoT connections are on track to more than double by 2030. NIST SP 1800-36 stresses trusted onboarding at the network layer, positioning captive portals as key gateways for policy-based device admission.[2]National Institute of Standards and Technology, “Trusted IoT Device Network-Layer Onboarding and Lifecycle Management,” nccoe.nist.gov Enterprises increasingly seek platforms that discern between human users and IoT nodes, applying tailored authentication to each. This capability is now a purchase-time differentiator.
Restraints Impact Analysis*
| Restraint | (~) % Impact on CAGR Forecast | Geographic Relevance | Impact Timeline |
|---|---|---|---|
| Short product refresh cycles raise integration costs | -1.8% | Global, particularly affecting SMEs | Short term (≤ 2 years) |
| GDPR/CCPA privacy limits on data-harvesting monetisation | -2.1% | EU and California, expanding globally | Medium term (2-4 years) |
| Rogue-AP and spoofing risks undermining portal trust | -1.3% | Global, concentrated in high-density venues | Short term (≤ 2 years) |
| Edge-compute competition (OpenRoaming, Passpoint) bypassing portals | -2.4% | Global, led by mobile carrier deployments | Long term (≥ 4 years) |
| Source: Mordor Intelligence | |||
GDPR/CCPA privacy limits on data-harvesting monetization
Stringent consent rules curtail the depth of user profiling, dampening the revenue potential that originally justified many captive portal rollouts. Venues must implement robust consent flows and granular data-minimization features, adding cost and complexity. Smaller sites lacking legal resources face the toughest trade-offs, which slows platform adoption in privacy-sensitive regions.
Edge-compute competition bypassing portals
Passpoint and OpenRoaming enable credential-free access that removes the captive portal splash page altogether. Deployments by Aruba, Boingo, and handset makers such as OPPO attest to the momentum behind seamless roaming. As user familiarity grows, venues may prefer frictionless connectivity over data capture, eroding the captive portal’s central role.
*Our forecasts treat driver/restraint impacts as directional, not additive. The impact forecasts reflect baseline growth, mix effects, and variable interactions.
Segment Analysis
By Deployment Model: Cloud dominance accelerates
Cloud solutions accounted for 62.3% revenue in 2024 and are climbing at a 13.4% CAGR. The captive portal market size for cloud deployments is set to pass USD 1.3 billion by 2030. Multitenant architectures offer continuous feature rollouts, superior uptime, and built-in analytics. The captive portal market share of on-premise systems will continue shrinking, though they persist in sectors requiring strict data sovereignty. Vendors that deliver hybrid connectors gain flexibility for regulated workloads.
Cloud adoption also lowers the entry threshold for SMBs, fueling wider diffusion. Subscription billing aligns costs with usage, while centralized dashboards reduce in-house IT needs. Combined, these factors reinforce the cloud’s lead through the forecast horizon.


By Authentication Method: Social login leads despite emerging alternatives
Social-login retained 45.2% revenue share in 2024. Familiar social media credentials speed onboarding and supply demographic data valuable for targeted campaigns. However, data-minimization rules are narrowing permissible fields, slightly moderating growth. Passpoint/OpenRoaming is the fastest-rising method, registering 15.8% CAGR thanks to telecom-grade roaming capabilities that meet passenger-mobility demands. SMS/OTP and PMS/Voucher remain niche for high-security or hospitality guest-registry use cases.
Vendors now blend multiple methods into adaptive workflow engines that let venues choose based on context. This flexibility helps mitigate the risk of any single method becoming obsolete.
By Enterprise Size: SMB leadership drives democratization
SMBs generated 54.3% of 2024 revenue. The captive portal market size for this cohort is expected to hit USD 1.1 billion by 2030, reflecting cloud subscription uptake and plug-and-play deployment kits. Large enterprises still represent critical reference accounts due to complex integrations, yet their incremental growth is steadier at single-digit rates. Vendors courting SMBs emphasize low-touch onboarding, template-driven splash pages, and bundled analytics.
By End-user Industry: Hospitality leadership faces transportation challenge
Hospitality delivered 38.2% of 2024 sales. Hotels exploit portals for loyalty sign-ups, upsell prompts, and local advertising. Transportation hubs—airports, rail, and cruise—are advancing at a 14.6% CAGR. Massive passenger footfall and strict security mandates spur demand for high-capacity, standards-compliant portals. Retail and QSR chains harness real-time customer analytics, while education and smart-city initiatives focus on access controls and equitable connectivity.
Geography Analysis
North America commanded 33.2% revenue in 2024. Enterprises here emphasize advanced analytics and privacy compliance, spurring demand for feature-rich platforms that integrate with CRM and SIEM tools. High-profile projects such as Los Angeles International Airport’s unified wireless upgrade illustrate continued capital investment.[3]Los Angeles World Airports, “RFP-LAX Campus-WiFi-Coverage-Improvement,” governmentnavigator.com
Asia-Pacific is the fastest-growing territory at 16.2% CAGR. Rapid urbanization, booming hospitality construction, and large-scale IoT manufacturing drive uptake. Regional players embrace Passpoint-enabled smartphones that bypass portals, yet venues still deploy captive portals for marketing and compliance. Cost-effective cloud licensing is particularly appealing in price-sensitive sub-markets.
Europe blends mature adoption with evolving legal requirements. The forthcoming EU Digital Identity Wallet requirement is reshaping vendor roadmaps toward interoperable, eIDAS-compliant offerings. Member-state variations in identity-proofing create an opportunity for solution providers that package compliance templates.
The Middle East and Africa, and South America are emerging markets. Hospitality projects tied to tourism expansion underpin MEA growth, while economic variability tempers progress in parts of South America. Localized language support and managed-service options are decisive differentiators for entrants.

Competitive Landscape
The field is moderately concentrated. Networking giants like Cisco Meraki, Aruba Networks, and Extreme Networks bundle captive portals into broad infrastructure suites, leveraging channel reach and integration depth. Specialized providers such as Purple WiFi, Cloud4Wi, and Eleven Software focus on vertical-specific analytics and rich engagement features.
Consolidation activity is evident: ASSA ABLOY’s USD 30 million acquisition of Nomadix and Global Reach added end-to-end Wi-Fi engagement capabilities. Extreme Networks launched Platform ONE™ to merge networking and security with AI-based automation, aiming to reduce administrator workloads.[4]Extreme Networks, “Extreme Networks Reports Second Quarter Fiscal Year 2025 Financial Results,” investor.extremenetworks.com
Competitive success hinges on balancing seamless user onboarding with monetizable insights while preparing for bypass technologies. Vendors adding AI-driven personalization and zero-touch IoT onboarding stand to capture premium margins. Partnerships with hospitality brands and transportation authorities also provide marquee references that influence buyer shortlists.
Captive Portal Industry Leaders
Cisco Meraki
Aruba Networks (Hewlett-Packard Enterprise)
Extreme Networks
Ruckus Networks (CommScope)
Cloud4Wi
- *Disclaimer: Major Players sorted in no particular order

Recent Industry Developments
- January 2025: Extreme Networks posted USD 279.4 million Q2 FY2025 revenue and introduced Extreme Platform ONE™, integrating networking and security with AI automation.
- September 2024: Los Angeles World Airports issued an RFP for unified wireless systems at LAX and Van Nuys, seeking a 7-year managed-service partner.
- May 2024: NIST released SP 1800-36, offering guidance for trusted IoT network-layer onboarding that dovetails with captive-portal controls.
- March 2024: ASSA ABLOY acquired Nomadix and Global Reach for USD 30 million, adding hospitality-focused Wi-Fi engagement platforms to its Global Solutions unit.


Global Captive Portal Market Report Scope
| Cloud-based |
| On-premise |
| Social-login |
| SMS / OTP |
| PMS / Voucher |
| Passpoint / OpenRoaming |
| Small and Mid-size Businesses |
| Large Enterprises |
| Hospitality |
| Retail and QSR |
| Transportation (Airports, Rail, Cruise) |
| Education |
| Smart Cities and Public Venues |
| North America | United States | |
| Canada | ||
| Mexico | ||
| South America | Brazil | |
| Argentina | ||
| Rest of South America | ||
| Europe | Germany | |
| United Kingdom | ||
| France | ||
| Italy | ||
| Spain | ||
| Russia | ||
| Rest of Europe | ||
| Asia-Pacific | China | |
| Japan | ||
| India | ||
| South Korea | ||
| Rest of Asia-Pacific | ||
| Middle East and Africa | Middle East | Saudi Arabia |
| United Arab Emirates | ||
| Turkey | ||
| Rest of Middle East | ||
| Africa | South Africa | |
| Nigeria | ||
| Rest of Africa | ||
| By Deployment Model | Cloud-based | ||
| On-premise | |||
| By Authentication Method | Social-login | ||
| SMS / OTP | |||
| PMS / Voucher | |||
| Passpoint / OpenRoaming | |||
| By Enterprise Size | Small and Mid-size Businesses | ||
| Large Enterprises | |||
| By End-user Industry | Hospitality | ||
| Retail and QSR | |||
| Transportation (Airports, Rail, Cruise) | |||
| Education | |||
| Smart Cities and Public Venues | |||
| By Geography | North America | United States | |
| Canada | |||
| Mexico | |||
| South America | Brazil | ||
| Argentina | |||
| Rest of South America | |||
| Europe | Germany | ||
| United Kingdom | |||
| France | |||
| Italy | |||
| Spain | |||
| Russia | |||
| Rest of Europe | |||
| Asia-Pacific | China | ||
| Japan | |||
| India | |||
| South Korea | |||
| Rest of Asia-Pacific | |||
| Middle East and Africa | Middle East | Saudi Arabia | |
| United Arab Emirates | |||
| Turkey | |||
| Rest of Middle East | |||
| Africa | South Africa | ||
| Nigeria | |||
| Rest of Africa | |||


Key Questions Answered in the Report
What is the 2025 valuation for captive portal software and its forecast CAGR to 2030?
The category is valued at USD 1.21 billion in 2025 and is projected to expand at an 11.47% CAGR, reaching USD 2.08 billion by 2030.
Which deployment option is expanding the quickest for captive portal platforms?
Cloud-based solutions lead with a 13.4% CAGR through 2030, fueled by lower capital costs, automatic updates, and centralized policy control.
Why are small and mid-size businesses embracing captive portal software?
Subscription pricing and plug-and-play cloud deployments let SMBs gain enterprise-grade authentication, analytics, and marketing functions without heavy IT overhead.
How do GDPR and CCPA compliance rules influence captive portal return on investment?
Consent mandates limit data harvesting, reducing advertising revenue potential; venues must balance tighter privacy controls with new monetization approaches to maintain ROI.
Which geography shows the strongest growth outlook and why?
Asia-Pacific is advancing at a 16.2% CAGR as digital-transformation projects, hospitality construction, and large-scale IoT rollouts drive demand for scalable, cost-effective portals.
What impact could Passpoint/OpenRoaming have on traditional captive portals?
Seamless credential-free roaming threatens splash-page relevance by prioritizing frictionless connectivity, prompting vendors to add value via advanced analytics and IoT onboarding features.
Page last updated on:


