Transparent Caching Market Size and Share
Market Overview
| Study Period | 2019 - 2030 |
|---|---|
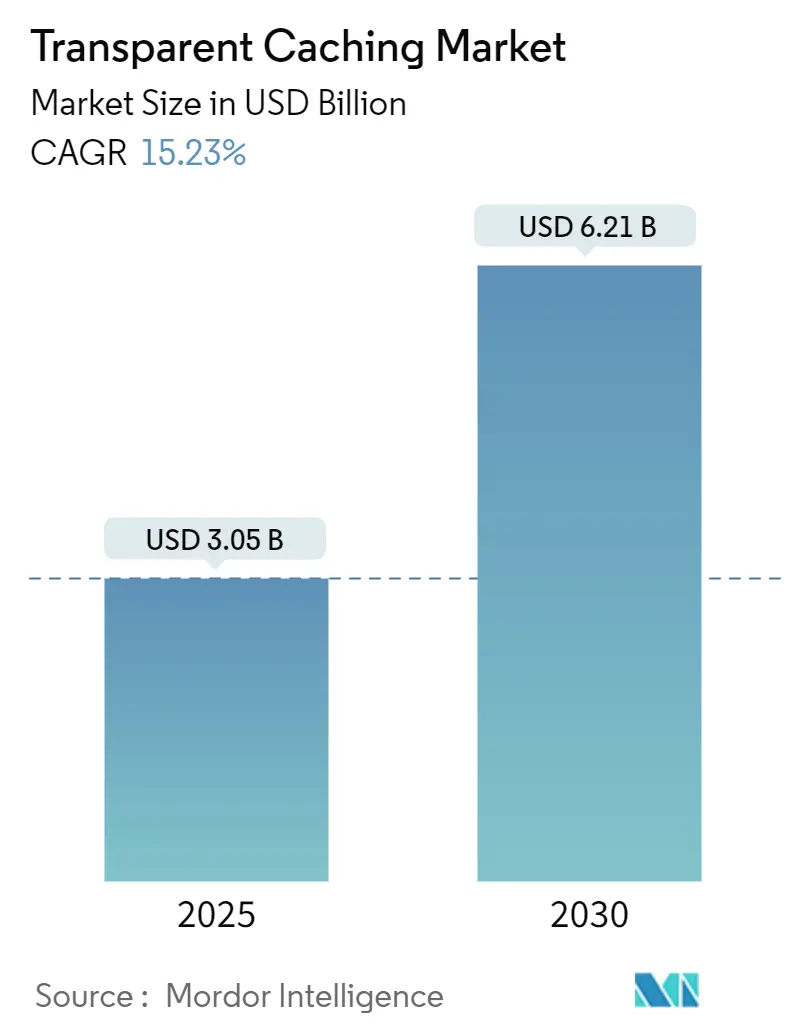
| Market Size (2025) | USD 3.05 Billion |
| Market Size (2030) | USD 6.21 Billion |
| Growth Rate (2025 - 2030) | 15.23% CAGR |
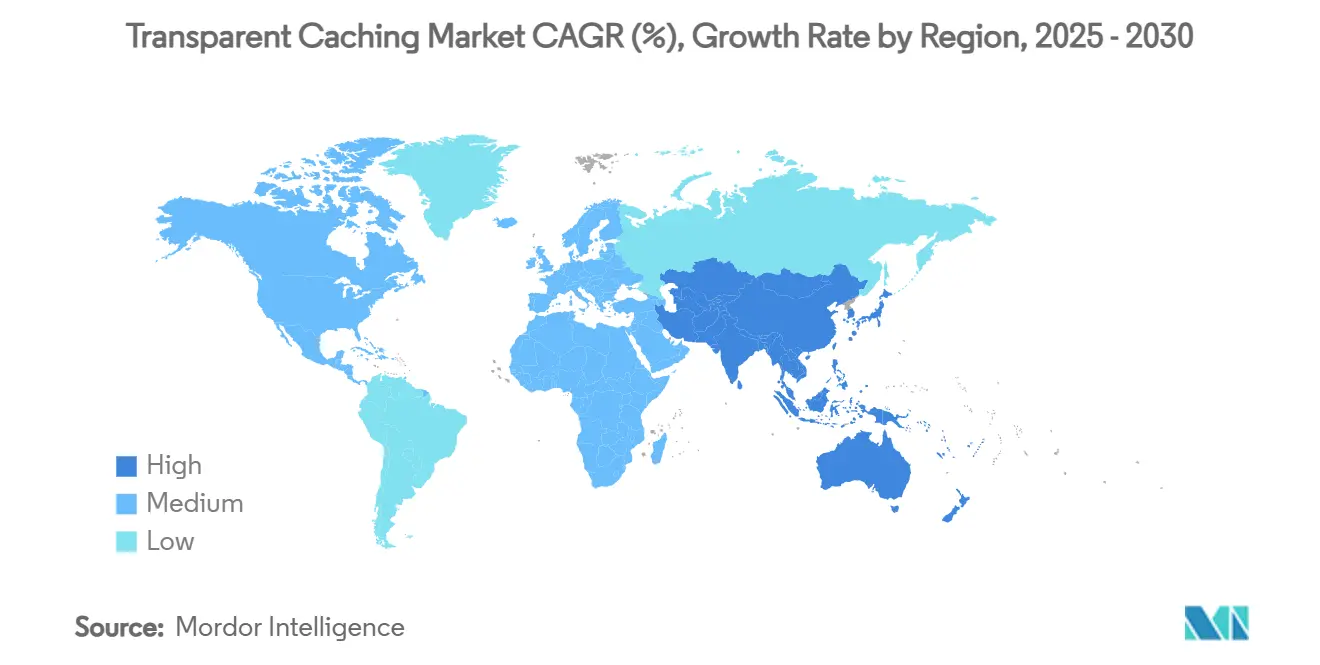
| Fastest Growing Market | Asia Pacific |
| Largest Market | North America |
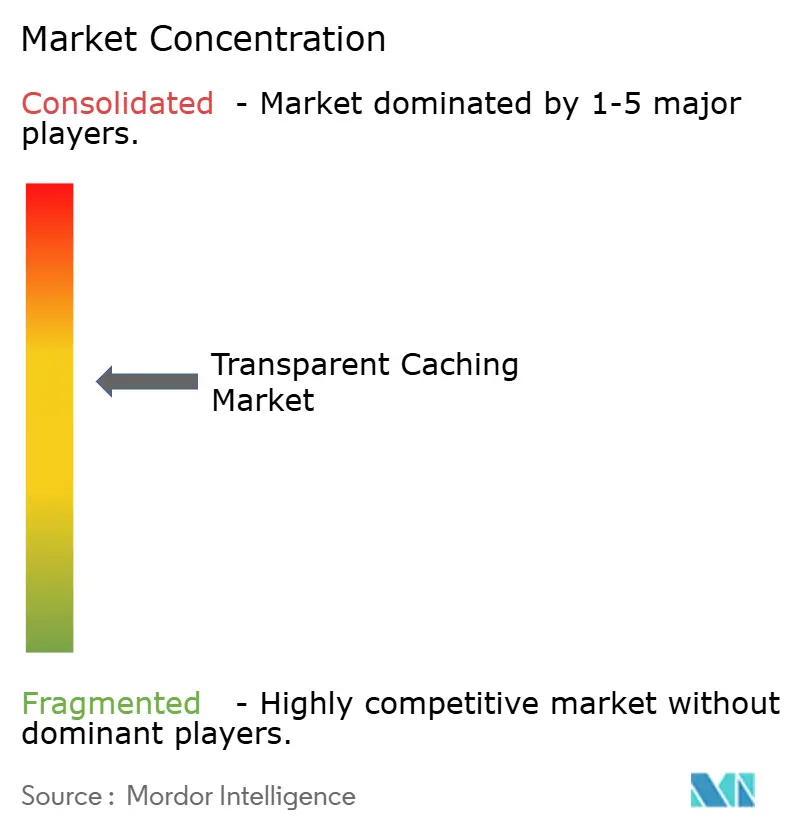
| Market Concentration | Medium |
Major Players *Disclaimer: Major Players sorted in no particular order Image © Mordor Intelligence. Reuse requires attribution under CC BY 4.0. | |
Transparent Caching Market Analysis by Mordor Intelligence
The transparent caching market size stood at USD 3.05 billion in 2025 and is forecast to expand to USD 6.21 billion by 2030, translating into a 15.23% CAGR. This outsized trajectory mirrors the structural pivot toward edge-based content delivery, as video already represents more than 75% of global IP traffic. Rapid 5G roll-outs, the widening adoption of software-defined networking, and the surge in GenAI-generated media are converging to make real-time, low-latency storage indispensable across operator networks. Content providers are embedding cache nodes ever closer to end users to cut backhaul costs, improve quality of experience, and unlock monetization models such as dynamic ad insertion. Operators, in turn, favor transparent integration that preserves session control, minimizes operational overhead, and supports energy-aware orchestration. As a result, the transparent caching market is evolving from a performance add-on into a capital-efficient cornerstone of modern network economics.
Key Report Takeaways
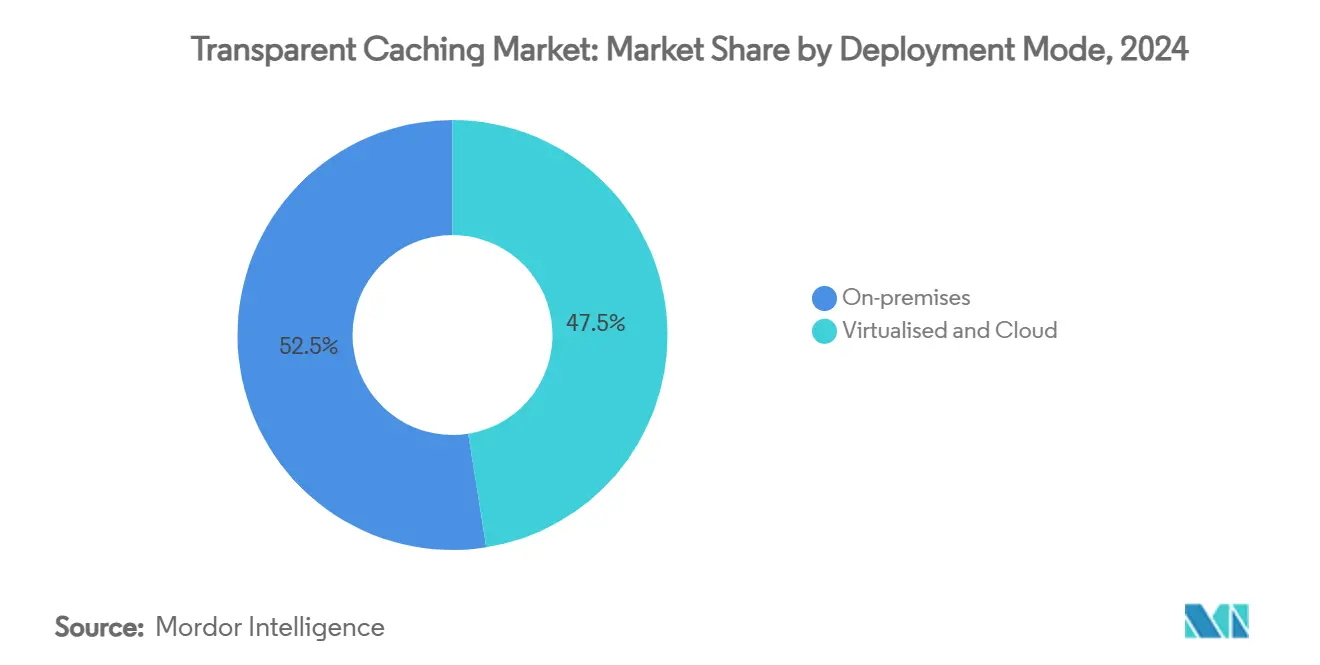
- By deployment mode, on-premises solutions accounted for 52.5% of transparent caching market share in 2024, while cloud/Cache-as-a-Service is projected to post the fastest 17.23% CAGR to 2030.
- By content type, video dominated with a 76.7% share of transparent caching market size in 2024; GenAI-driven short-form video is advancing at an 18.74% CAGR through 2030.
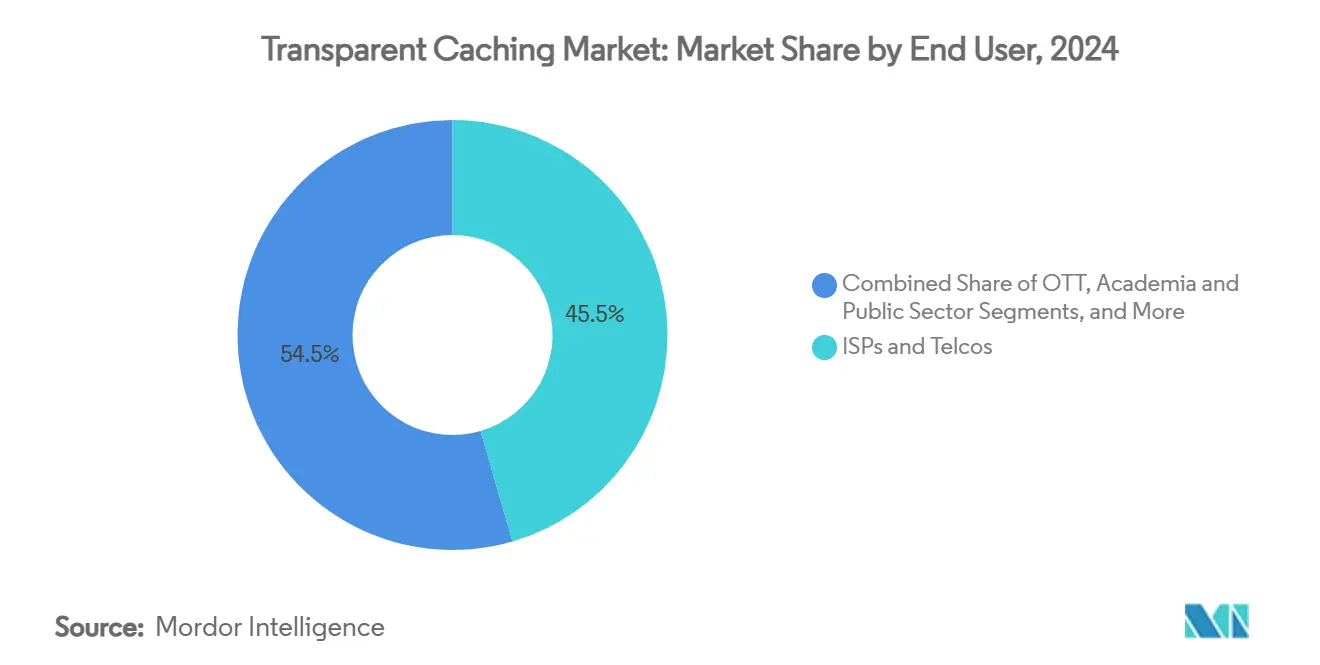
- By end user, ISPs and telcos held 45.5% of transparent caching market share in 2024, whereas OTT platforms are expanding at a 15.40% CAGR.
- By network type, fixed broadband commanded 51.0% of transparent caching market size in 2024; mobile networks are growing at a 16.79% CAGR.
- By geography, North America led with a 34.0% share in 2024, but Asia-Pacific is the fastest-growing region at an 18.90% CAGR to 2030.
Global Transparent Caching Market Trends and Insights
Drivers Impact Analysis*
| Driver | (~) ( %) Impact on CAGR Forecast | Geographic Relevance | Impact Timeline |
|---|---|---|---|
| Video share exceeding 75% of IP traffic | +4.2% | Global, highest in APAC and North America | Medium term (2–4 years) |
| 5G roll-outs shifting caches to edge-cloud | +3.8% | APAC core, spill-over to Europe and North America | Long term (≥ 4 years) |
| ISP monetization of ad-supported OTT tiers | +2.9% | North America and EU, expanding to APAC | Medium term (2–4 years) |
| Software-defined stacks reducing TCO | +2.1% | Global, early adoption in developed markets | Short term (≤ 2 years) |
| GenAI video requiring ultra-low-latency edge | +1.8% | North America, Europe, select APAC markets | Long term (≥ 4 years) |
| Energy-aware caching in power-capped mobile | +1.5% | Global, emphasis on emerging markets | Medium term (2–4 years) |
| Source: Mordor Intelligence | |||
Rising Video Traffic Share Fuels Infrastructure Investments
Online video’s stake in total IP traffic crossed the 75% mark, tipping network economics in favor of deep, transparent cache deployment. Experience from major platforms underscores the cost incentive: Netflix’s Open Connect program delivered more than USD 1 billion in operator savings by locating cache servers inside provider networks. 5G Americas studies show only a small subset of popular titles accounts for the bulk of traffic, making edge storage decisive for bandwidth savings.[1]“5G at the Edge,” 5G Americas, 5gamericas.org Content demand accelerated alongside a 61% annual rise in mobile data volume between 2014 and 2019, forcing operators to invest in distributed caching that reduces backbone strain while guaranteeing premium playback quality.
5G Architecture Evolution Favors Distributed Edge Computing
The migration toward 5G standalone cores prompts operators to swap centralized appliances for cloud-native cache nodes embedded in virtualized radio networks. Telefónica’s first commercial Cloud RAN deployment with Ericsson validated latency gains and service agility achievable through software-defined resources. Academic modelling confirms that edge-centric placement cuts task overhead for terminals and reduces fronthaul congestion, creating room for data-intensive use cases such as augmented reality and live volumetric streaming. Consequently, transparent caching market participants embed compute and storage in tandem, positioning cache as a natural extension of the 5G edge-cloud.
ISP Monetization Through OTT Integration
Operators recognize revenue potential when transparent cache nodes deliver OTT streams under an “operator-integrated” model. Verizon’s Open Caching collaboration with Disney+ demonstrated measurable reductions in start-up delay and rebuffer incidents, translating into higher engagement and a new wholesale income line for the ISP.[2]Dan Rayburn, “Verizon and Disney+: Stream the Highest Quality Content,” verizon.com Open Caching specifications promoted by the Streaming Video Alliance standardize interfaces so that OTT brands can tap operator edges at scale, a framework already adopted by more than 175 service providers worldwide. These arrangements elevate the transparent caching market by aligning operator economics with content-provider quality targets.
Software-Defined Caching Transforms Economics
Replacing proprietary hardware with software-defined cache stacks trims both capital and operating budgets. VMware Cloud Foundation deployments documented 51% total cost-of-ownership savings by consolidating infrastructure, automating orchestration, and supporting consumption-based licensing. Additional modelling shows that in-network caching lowers aggregate traffic loads by 45% and minimizes gateway requirements by 6%, lifting overall network efficiency. These gains encourage enterprises and service providers alike to favor elastic, API-driven cache platforms over fixed appliances, accelerating the shift toward cloud-native transparent caching market offerings.
Restraints Impact Analysis*
| Restraint | (~) % Impact on CAGR Forecast | Geographic Relevance | Impact Timeline |
|---|---|---|---|
| Falling broadband-transit pricing erodes ROI of on-prem caches | –2.8% | Global, with highest impact in mature markets | Short term (≤ 2 years) |
| Vendor lock-in around proprietary cache APIs limits interoperability | –1.9% | North America and Europe, expanding globally | Medium term (2–4 years) |
| Privacy-centric browser protocols (e.g., QUIC + E2EE) reduce cache hit-rates | –1.4% | Global, with early impact in privacy-conscious regions | Medium term (2–4 years) |
| Surging on-device storage (8–16 GB RAM phones) diminishes network-side caching | –1.1% | APAC and North America, spreading to emerging markets | |
| Source: Mordor Intelligence | |||
Declining Transit Costs Challenge ROI
Continuous downward pressure on wholesale IP transit rates weakens the simple cost-offload argument for on-prem cache appliances. As per global carrier reports, per-megabit transit prices have fallen by double-digit percentages annually since the mid-2010s, narrowing the break-even horizon for cache investments. Operators now justify deployments by coupling traffic savings with revenue-generating edge services and latency guarantees rather than relying solely on bandwidth economics. The transparent caching market therefore pivots toward multi-service value propositions that bundle security, analytics, and compute alongside content storage.
Proprietary API Fragmentation Impedes Interoperability
Multi-CDN strategies depend on uniform cache control, yet proprietary interfaces complicate orchestration. The Internet Engineering Task Force has highlighted the absence of harmonized standards for CDN interconnection, prompting ongoing work on Targeted HTTP Response Header Fields. Akamai’s release of Targeted Cache Control marks industry progress but also underscores how vendor-specific extensions can entrench lock-in.[3]“Akamai Completes Acquisition of Select Assets of Edgio,” Akamai, akamai.com Enterprises reluctant to commit to single-vendor stacks may delay deployments until open specifications mature, dampening short-term growth in segments of the transparent caching market.
*Our forecasts treat driver/restraint impacts as directional, not additive. The impact forecasts reflect baseline growth, mix effects, and variable interactions.
Segment Analysis
By Deployment Mode: Cloud Momentum Counters On-Premises Lead
On-premises installations retained 52.5% of transparent caching market share in 2024, reflecting established procurement cycles and regulatory oversight in sectors such as telecom and public services. Yet the cloud/Cache-as-a-Service segment is growing at a 17.23% CAGR as enterprises prize pay-as-you-grow elasticity and rapid provisioning. The transparent caching market size for cloud models is forecast to more than double by 2030, propelled by 5G edge zones that let operators spin up cache capacity within minutes. Software-only virtual appliances occupy a middle ground, delivering hardware independence without full public-cloud reliance.
Akamai’s Gecko initiative demonstrates strategic convergence: the company aims to plant container-ready compute nodes across 4,100 points of presence, effectively turning every cache site into a microcloud with integrated security and routing. Early rollouts in 100 cities by end-2024 are validating the blueprint and encouraging rivals to emulate a cache-plus-compute paradigm. As orchestration frameworks mature, buyers will view caching, serverless compute, and AI inference as inseparable edge-service building blocks, further accelerating cloud-centric demand within the transparent caching market.


By Content Type: GenAI Reshapes Video Dominance
Video held a commanding 76.7% share of transparent caching market size in 2024, anchored by long-form streaming libraries and live sports feeds. GenAI-generated short-form clips now post an 18.74% CAGR, adding high-churn, personalized objects that must be served within tight delays. Large software updates, game patches, and I-frame repairs constitute a rising secondary payload, especially in Asia-Pacific where mobile gaming booms. Static web objects keep a stable baseline, while fast-growing niches such as audiobooks and immersive audio lean on improved compression and low-bit-rate adaptive protocols.
Storage profiles are shifting: McKinsey forecasts 62% annual growth in AI training storage and 105% in inference between 2025 and 2028, injecting unpredictable demand spikes. Transparent cache architectures are therefore adopting NVMe-over-TCP, tiered memory, and predictive prefetching to accommodate write-heavy AI workloads. Vendors able to align cache logic with generative rendering pipelines stand to win disproportionate share as the transparent caching industry evolves.
By End User: OTT Platforms Narrow Gap With ISPs
ISPs and telcos controlled 45.5% of transparent caching market share in 2024, leveraging last-mile ownership and carrier-grade facilities. OTT platforms, however, are advancing at a 15.40% CAGR, pursuing in-operator cache integration to monetize ad-supported tiers and curb content-delivery expenses. Enterprise and colocation providers constitute a fast-diversifying cohort as hybrid cloud pushes data closer to branch offices. Academic and public-sector users employ transparent caches to distribute open educational resources and public-service video.
Netflix’s Open Connect model proved the bilateral benefits of deep cache peering, encouraging Amazon Prime Video, Disney+, and regional streamers to seek similar agreements. Operator acceptance is rising because transparent cache nodes preserve control over QoS while transforming content providers into co-investors in edge infrastructure. The resulting ecosystem blurs traditional boundaries, positioning collaboration as a primary growth lever within the transparent caching market.

By Network Type: Mobile Drives Edge Integration
Fixed broadband networks, including cable and FTTH, held 51.0% of transparent caching market size in 2024 owing to ample backhaul capacity and predictable usage patterns. Mobile networks are expanding at a 16.79% CAGR as 5G architecture mandates ultra-distributed edge nodes colocated with radio units. Power-efficient cache algorithms deliver 21% energy savings in 5G environments, easing operators’ carbon and cost pressures [APPLIEDSCIENCES]. Public Wi-Fi hotspots profit from remote-work proliferation, while private campus networks adopt transparent caching to guarantee throughput for industrial IoT and extended-reality training.
Evolving spectrum allocations and network slicing permit differentiated cache policies that align latency, security, and monetization objectives to individual service tiers. This flexibility cements mobile infrastructure as the most potent catalyst for transparent caching market expansion through 2030.
Geography Analysis
North America’s transparent caching market size benefits from a robust 5G footprint, with operators shifting from appliance-centric to cloud-native nodes that can flex capacity in real time. Strategic alliances, such as Akamai’s USD 100 million cloud-infrastructure agreement with a global technology firm, promise to pump fresh capital into edge locations, sustaining double-digit growth momentum. Competitive upside also stems from ISPs bundling managed Kubernetes and security services around cache assets, creating sticky enterprise propositions that outpace pure bandwidth offerings.
Asia-Pacific’s 18.90% CAGR reflects the scale of regional spectrum auctions, network roll-outs, and device upgrades. Massive subscriber bases multiply the return on each incremental cache deployed, prompting carriers to leapfrog straight to software-defined stacks. Government stimulus and cross-border submarine-cable projects further reinforce bandwidth supply, while low-latency mandates from cloud gaming and live commerce segments make transparent caching indispensable. Regional supply-chain advantages in semiconductor and server manufacturing shorten lead times, accelerating project execution.
Europe aligns transparent caching growth with its Green Deal objectives. Energy-aware placement, use of renewable power contracts, and circular-economy hardware refresh practices influence vendor selection. Interoperability remains a strategic focus: policy bodies favor open standards that avert lock-in, encouraging multi-vendor deployments across incumbent telcos and regional ISPs. As edge data centers proliferate along rail corridors and municipal fiber routes, transparent caching market penetration widens beyond Tier-1 metros into secondary cities that house high-density clusters of remote workers and online learners.

Competitive Landscape
Government smart-infrastructure initiatives
The transparent caching market displays moderate concentration. Incumbent CDN providers strengthen vertical integration by acquiring edge compute, security, and load-balancing capabilities. Akamai’s purchase of Edgio customer contracts, projected to add USD 80 million–100 million in 2025 revenue, exemplifies the push to consolidate downstream service footprints. Cloud hyperscalers embed transparent cache logic into distributed Kubernetes platforms, offering unified policy control across regions.
Technology differentiation converges on software-defined, API-first architectures that cut total cost of ownership by an estimated 51% versus proprietary hardware. Vendors compete on orchestrator intelligence, predictive prefetch algorithms, and zero-trust security baked into cache nodes. Power efficiency is an emerging battleground: research evidences 21% energy savings when caches dynamically migrate objects based on carbon intensity of local grids. Operators evaluating tenders increasingly weigh sustainable-operations roadmaps beside raw throughput metrics.
Strategic partnerships dominate go-to-market activity. More than 175 service providers have adopted Qwilt’s Open Edge Cloud platform, underscoring appetite for white-label cache solutions that preserve branding and customer ownership. Nokia’s Deepfield analytics deal with ISP Fibrus highlights how network visibility augments cache policies to mitigate congestion spikes. As GenAI workloads emerge, competitors race to integrate GPU-assisted transcoding and inference at the edge, promising new lines of value for the transparent caching industry over the next five years.
Transparent Caching Industry Leaders
Akamai Technologies, Inc.
Cisco Systems, Inc.
Huawei Technologies Co., Ltd.
Telefonaktiebolaget LM Ericsson
Juniper Networks, Inc.
- *Disclaimer: Major Players sorted in no particular order

Recent Industry Developments
- 2025: Ericsson and Google Cloud introduced Ericsson On-Demand, a SaaS platform for 5G core-network functions that integrates AI-assisted troubleshooting and elastic resource allocation.
- April 2025: Broadband ISP Fibrus signed a five-year agreement with Nokia to deploy the Deepfield analytics suite, improving network security and traffic optimization as the operator scales beyond 100,000 connections.
- February 2025: Akamai Technologies secured a multi-year cloud-computing agreement exceeding USD 100 million to upgrade global edge infrastructure and deliver managed Kubernetes clusters.
- February 2025: o2 Telefónica activated the first commercial Cloud RAN network using Ericsson software, demonstrating real-time scaling within a 5G standalone architecture.


Global Transparent Caching Market Report Scope
| On-premises Appliances |
| Virtualised/Software-only |
| Cloud / Cache-as-a-Service |
| Video |
| Large Software Updates and Gaming |
| Web Objects and Files |
| Others (Audio, e-books, etc.) |
| ISPs and Telcos |
| OTT / Streaming Platforms |
| Enterprises and Data-centre Operators |
| Academia and Public Sector |
| Other End-users |
| Fixed Broadband (Cable/FTTH) |
| Mobile (3G/4G/5G) |
| Public Wi-Fi / Hot-spots |
| Private and Campus Networks |
| Other Network Types |
| North America |
| South America |
| Europe |
| Asia-Pacific |
| Middle East and Africa |
| By Deployment Mode | On-premises Appliances |
| Virtualised/Software-only | |
| Cloud / Cache-as-a-Service | |
| By Content Type | Video |
| Large Software Updates and Gaming | |
| Web Objects and Files | |
| Others (Audio, e-books, etc.) | |
| By End-user | ISPs and Telcos |
| OTT / Streaming Platforms | |
| Enterprises and Data-centre Operators | |
| Academia and Public Sector | |
| Other End-users | |
| By Network Type | Fixed Broadband (Cable/FTTH) |
| Mobile (3G/4G/5G) | |
| Public Wi-Fi / Hot-spots | |
| Private and Campus Networks | |
| Other Network Types | |
| By Geography | North America |
| South America | |
| Europe | |
| Asia-Pacific | |
| Middle East and Africa |


Key Questions Answered in the Report
What is driving the rapid growth of the transparent caching market?
The main catalysts are video’s 75% share of IP traffic, 5G edge-cloud architectures, and GenAI content that demands ultra-low-latency storage, together pushing the market toward a 15.23% CAGR through 2030.
How large is the transparent caching market today?
The transparent caching market size was USD 3.05 billion in 2025 and is forecast to reach USD 6.21 billion by 2030.
Which deployment model is expanding fastest?
Cloud/Cache-as-a-Service leads with a 17.23% CAGR, outpacing both on-premises appliances and virtual software-only options.
Why are OTT platforms investing in operator-integrated caching?
Integrating caches inside operator networks improves quality of experience and offsets delivery costs; OTT revenue from ad-supported tiers rises while ISPs gain new wholesale income streams.
Which region offers the highest growth potential?
Asia-Pacific, with an expected 18.90% CAGR, driven by USD 259 billion in 5G-focused network investment and rapid data-center expansion.
How does software-defined caching reduce operational costs?
By decoupling cache logic from proprietary appliances, operators see up to 51% TCO savings through automated orchestration and consumption-based licensing.
Page last updated on:


