Capecitabine Market Size and Share
Market Overview
| Study Period | 2020 - 2031 |
|---|---|
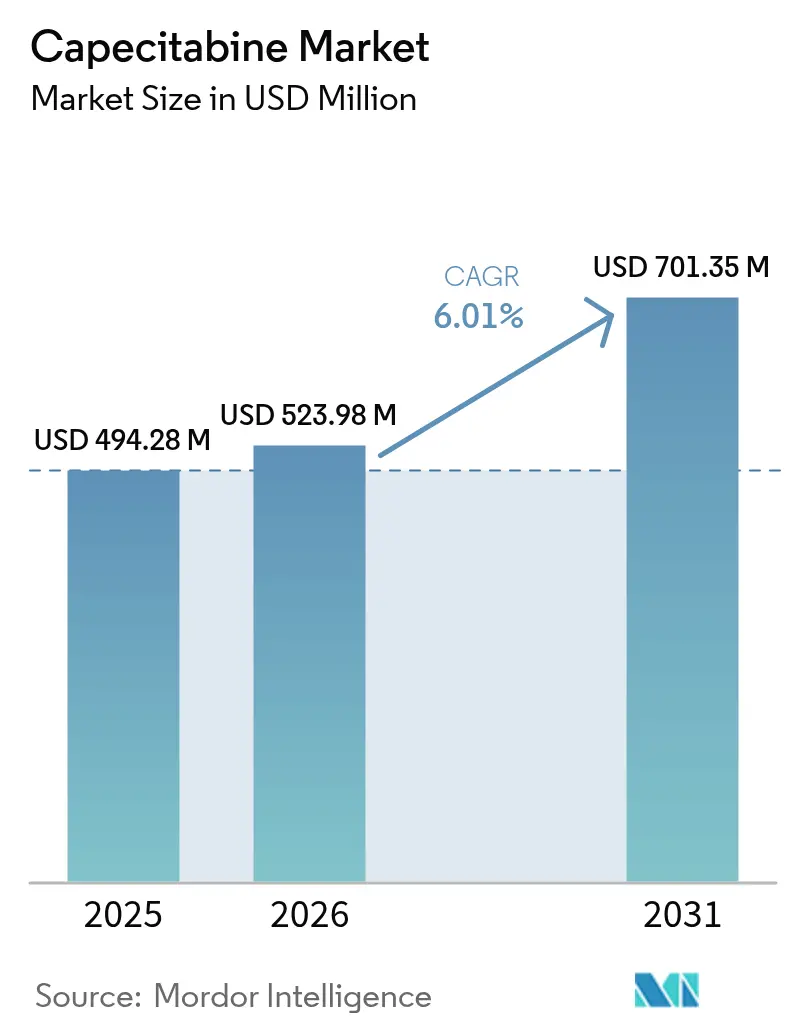
| Market Size (2026) | USD 523.98 Million |
| Market Size (2031) | USD 701.35 Million |
| Growth Rate (2026 - 2031) | 6.01% CAGR |
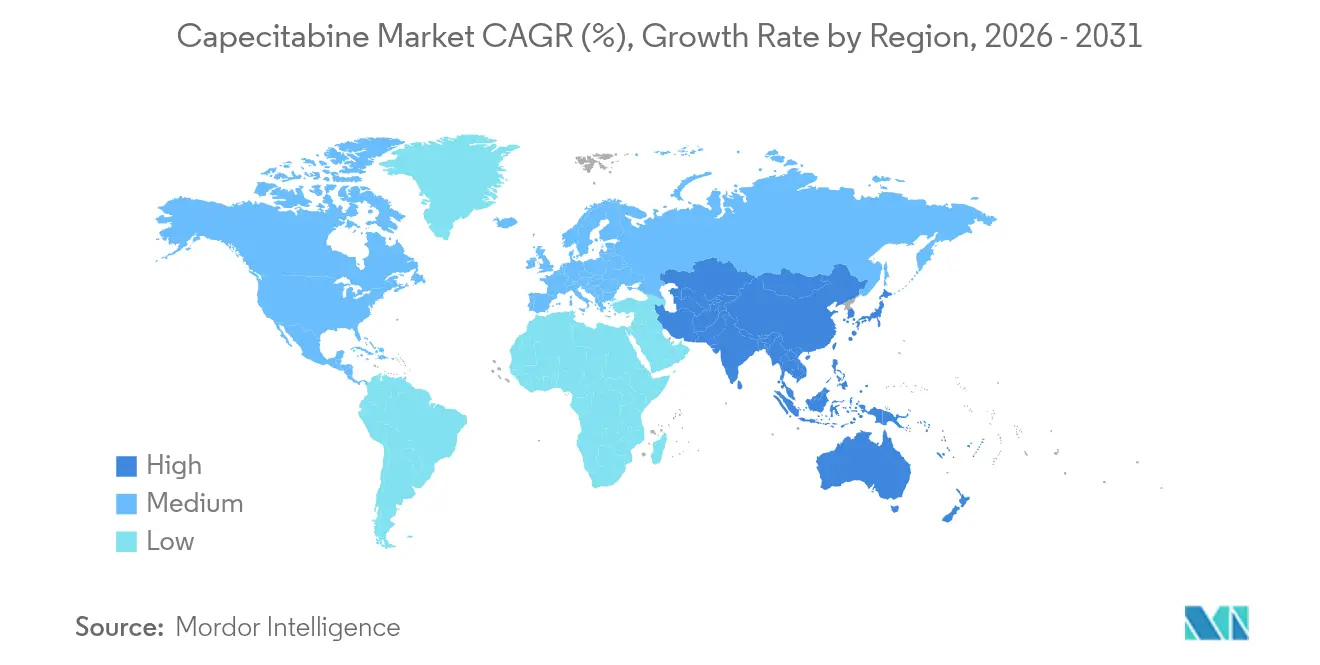
| Fastest Growing Market | Asia Pacific |
| Largest Market | North America |
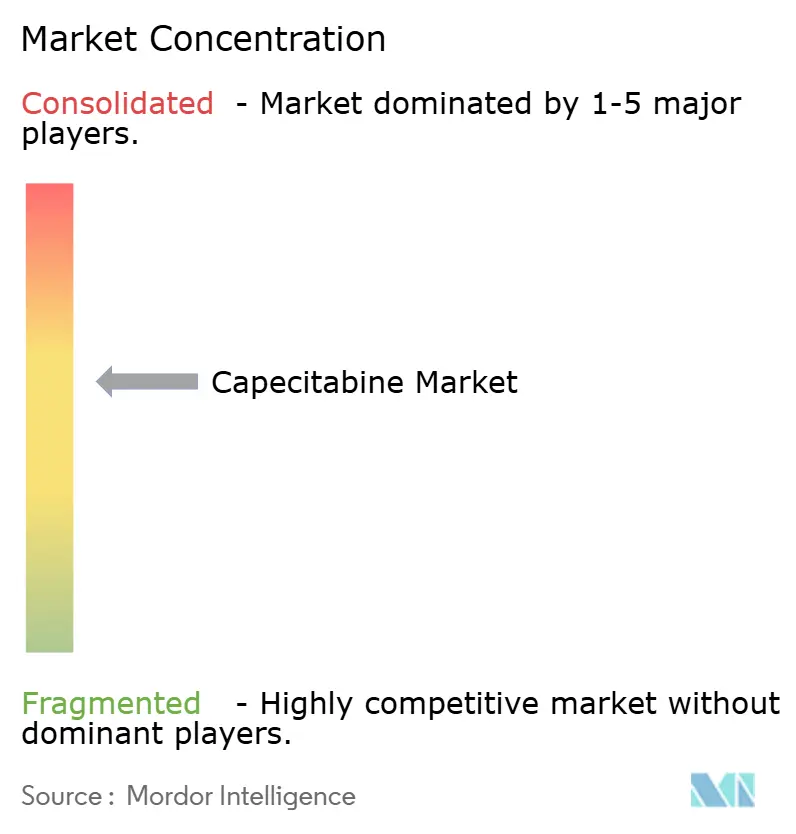
| Market Concentration | Medium |
Major Players *Disclaimer: Major Players sorted in no particular order Image © Mordor Intelligence. Reuse requires attribution under CC BY 4.0. | |
Capecitabine Market Analysis by Mordor Intelligence
The capecitabine market size is expected to grow from USD 494.28 million in 2025 to USD 523.98 million in 2026 and is forecast to reach USD 701.35 million by 2031 at 6.01% CAGR over 2026-2031. Consistent demand for home-based oral chemotherapy, rising cancer incidence and expanding healthcare access in emerging economies underpin this growth trajectory. Colorectal cancer continues to absorb the largest volume of capecitabine prescriptions, while pancreatic cancer exhibits the quickest uptake as newer combination protocols become standard. Hospital pharmacies still dominate distribution, yet retail and online channels are gaining traction as vertically integrated health-system models expand. North America maintains market leadership owing to robust reimbursement and mature oncology infrastructure, but Asia-Pacific is set to be the primary growth engine through 2030 on the back of policy incentives for domestic active pharmaceutical ingredient (API) production and wider screening programs. An evolving competitive landscape, characterised by accelerated generic penetration, expanding pharmacogenetic testing and renewed focus on supply-chain resilience, adds further momentum to the capecitabine market.
Key Report Takeaways
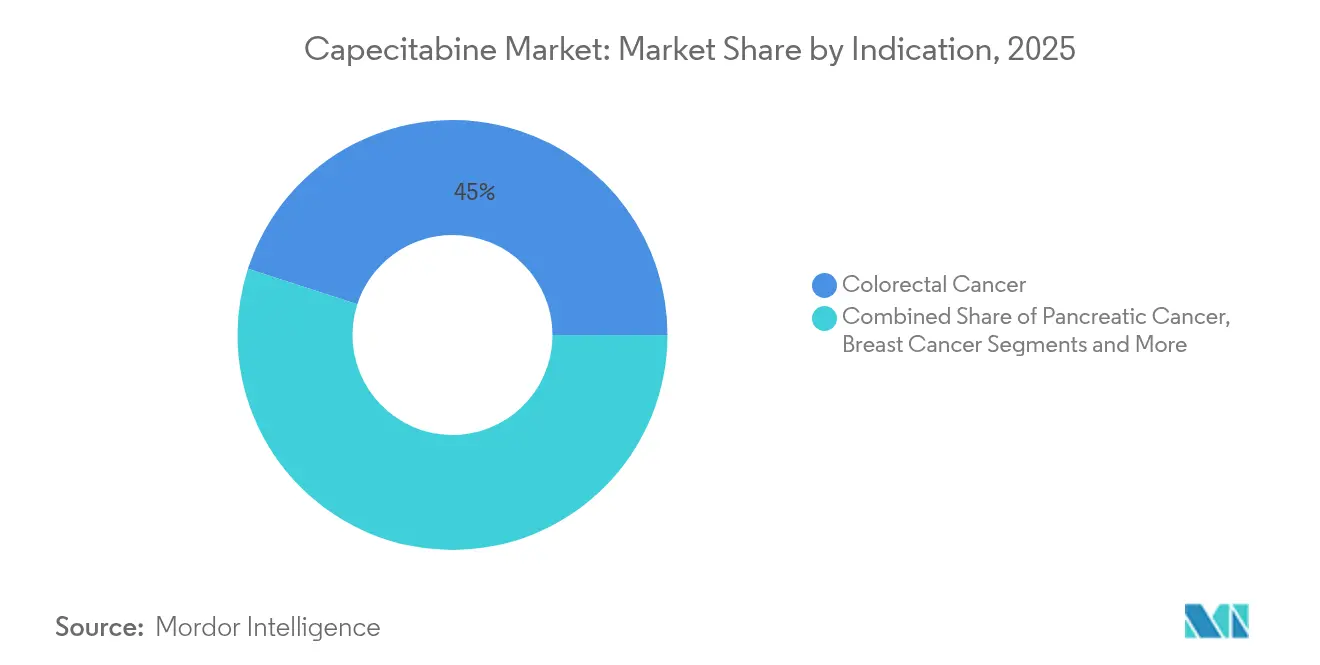
- By indication, colorectal cancer held 45.02% of capecitabine market share in 2025, whereas pancreatic cancer is projected to register the fastest 7.22% CAGR through 2031.
- By distribution channel, hospitals accounted for 52.90% of capecitabine market size in 2025 and retail-plus-online outlets are forecast to expand at an 8.33% CAGR during 2026-2031.
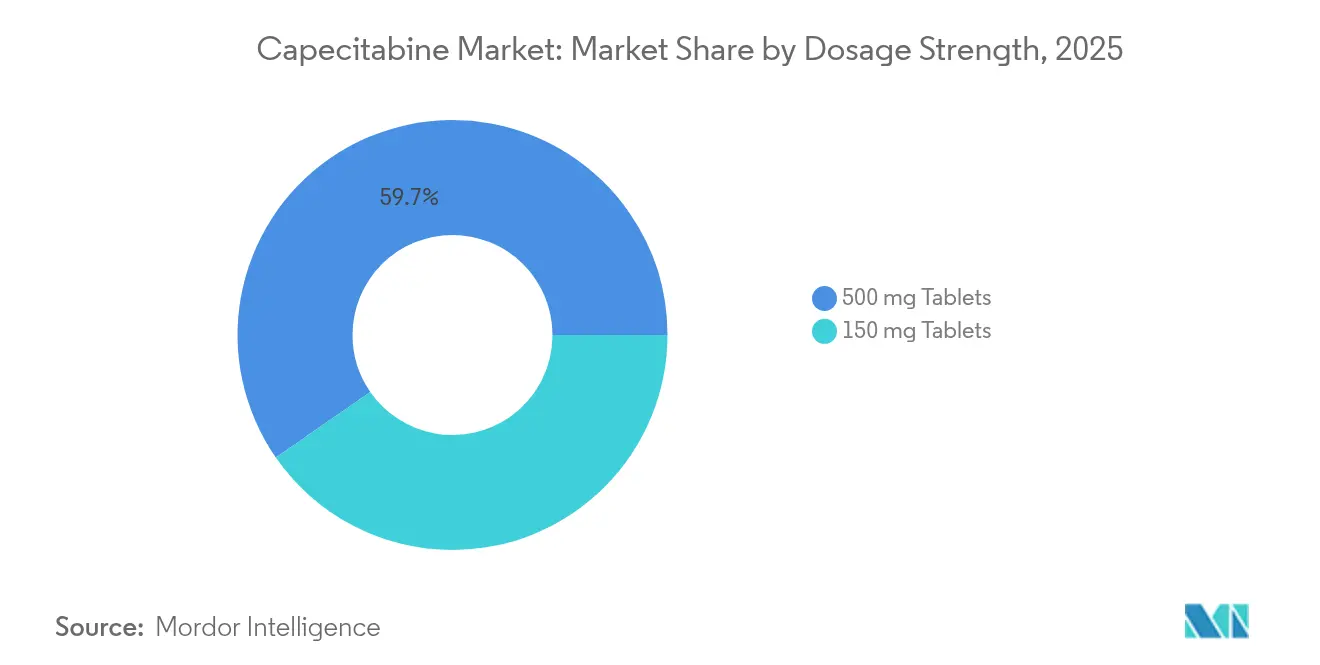
- By dosage strength, the 500 mg tablet commanded 59.65% of capecitabine market size in 2025, while the 150 mg strength is expected to grow at 7.41% CAGR to 2031.
- By formulation, branded products retained 69.35% of capecitabine market share in 2025, but generics are projected to expand at 9.05% CAGR as more manufacturers obtain regulatory approvals.
- By geography, North America captured 38.95% of capecitabine market size in 2025; Asia-Pacific is anticipated to deliver the fastest 7.18% CAGR owing to supportive manufacturing and screening initiatives.
Note: Market size and forecast figures in this report are generated using Mordor Intelligence’s proprietary estimation framework, updated with the latest available data and insights as of 2026.
Global Capecitabine Market Trends and Insights
Drivers Impact Analysis*
| Driver | (~) % Impact on CAGR Forecast | Geographic Relevance | Impact Timeline |
|---|---|---|---|
| Escalating Global Cancer Incidence | +1.8% | Global | Long term (≥ 4 years) |
| Intensifying Government Oncology Initiatives | +1.2% | North America & EU, APAC core | Medium term (2-4 years) |
| Rapid Generic Penetration Post-Xeloda Patent Expiry | +1.5% | Global, with early gains in North America, EU | Short term (≤ 2 years) |
| Patient Preference For Oral & Home-Based Chemotherapy | +0.9% | Global, particularly developed markets | Medium term (2-4 years) |
| Uptake In Immunotherapy Combination Regimens (MSI-H) | +0.6% | North America & EU, spill-over to APAC | Long term (≥ 4 years) |
| Emerging Metronomic Dosing Adoption In LMIC Palliative Care | +0.4% | APAC, MEA, Latin America | Long term (≥ 4 years) |
| Source: Mordor Intelligence | |||
Escalating Global Cancer Incidence
The World Health Organization reports that worldwide cancer cases will reach 35 million by 2050, a 77% jump over current levels[1]World Health Organization, “Global Cancer Burden Growing, Amidst Mounting Need for Services,” who.int. Colorectal and breast cancers—two leading uses of capecitabine—feature prominently in this uptrend, widening the treatment pool for oral fluoropyrimidines. Low- and middle-income countries, where 39% of facilities still lack comprehensive oncology services, view oral regimens as practical substitutes for infusion therapy thanks to simpler logistics and lower infrastructure demands. Ageing demographics in industrialised nations also favour less-toxic outpatient modalities that permit quality-of-life preservation. These converging epidemiological factors steadily support long-term capecitabine market growth.
Intensifying Government Oncology Initiatives
Government spending continues to elevate oncology on public-health agendas. In the United States, the Congressionally Directed Medical Research Program allocated USD 650 million to cancer research in 2025, funding both discovery and access schemes[2]Congressionally Directed Medical Research Program, “2025 Breast Cancer Research Program,” cdmrp.health.mil. Similar commitments in Europe underpin reshoring of critical APIs to safeguard supply. Subsidies for oral chemotherapy, coupled with tele-oncology expansion, expand home-based treatment footprints in both developed and emerging markets. These policies create a supportive environment for the capecitabine market by boosting reimbursement certainty and promoting distribution channels beyond acute-care settings.
Rapid Generic Penetration Post-Xeloda Patent Expiry
The expiry of Xeloda’s exclusivity unleashed robust generic competition. The US FDA has cleared capecitabine generics from multiple manufacturers, including Teva and Camber Pharmaceuticals, in both 150 mg and 500 mg strengths. Generic entry typically trims drug acquisition costs by up to 85%, encouraging payers to broaden patient access while eroding branded price premiums. CHEPLAPHARM’s purchase of Xeloda rights exemplifies originators’ defensive tactics, yet overall competitive intensity aids market volume expansion.
Patient Preference for Oral & Home-Based Chemotherapy
A 2024 patient-advocate survey of metastatic breast-cancer participants reported that 86.1% experienced meaningful side-effects, prompting strong willingness to discuss flexible dosing that balances efficacy and quality of life. Oral capecitabine eliminates central venous access needs and reduces infusion-clinic visits, appealing to patients and health systems alike. Pandemic-era infection-control lessons accelerated acceptance of home-dispensed regimens, while integrated dispensing pharmacies increased their role in adherence monitoring and financial counselling. This alignment between clinical efficacy and patient lifestyle preferences continues to buoy capecitabine market adoption.
Restraints Impact Analysis*
| Restraint | (~) % Impact on CAGR Forecast | Geographic Relevance | Impact Timeline |
|---|---|---|---|
| High Total Treatment Cost Of Multi-Cycle Capecitabine | -0.8% | Global, particularly LMIC and uninsured populations | Medium term (2-4 years) |
| Hand–Foot Syndrome Limiting Adherence & Dosage | -0.6% | Global | Short term (≤ 2 years) |
| API Supply Shortages & Manufacturing Disruptions | -0.9% | Global, with acute impact in North America & EU | Short term (≤ 2 years) |
| Mandatory DPD-Deficiency Genetic Testing Delays | -0.4% | EU, expanding to North America & developed APAC | Medium term (2-4 years) |
| Source: Mordor Intelligence | |||
High Total Treatment Cost of Multi-Cycle Capecitabine
Even after generic entry, cumulative therapy costs over several months can burden uninsured patients and public payers. Coverage disparities between oral and infusion drugs persist in many systems, limiting uptake despite documented clinical parity. Recent US legislation capping Medicare Part D out-of-pocket spending may shift that balance, yet the mid-term outlook remains sensitive to national reimbursement reforms.
Hand-Foot Syndrome Limiting Adherence & Dosage
More than 50% of users experience some grade of palmar-plantar erythrodysaesthesia, with treatment interruptions occurring in roughly one quarter of cases. Pharmacogenetic data implicate MTHFR and TYMS polymorphisms as risk factors, driving the oncology community to adopt pre-emptive dose modifications and supportive care protocols. Although research into protective agents is active, the toxicity profile restrains optimal dosing in a sizeable sub-cohort.
*Our forecasts treat driver/restraint impacts as directional, not additive. The impact forecasts reflect baseline growth, mix effects, and variable interactions.
Segment Analysis
By Indication: Colorectal Cancer Remains the Volume Anchor
Colorectal cancer generated 45.02% of capecitabine market size in 2025, sustained by guideline-endorsed CAPOX protocols across adjuvant and metastatic settings. Clinical parity with continuous 5-fluorouracil infusions and superior convenience underpin durable demand. Pancreatic malignancies, though currently smaller in absolute terms, are set to log a 7.22% CAGR through 2031 as evidence mounts for capecitabine’s benefit in combination regimens such as gemcitabine-capecitabine following surgical resection.
Growing interest in immunotherapy-augmented strategies positions capecitabine for niche expansion beyond first-line colorectal applications. Investigator-initiated studies are also exploring esophageal and biliary cancers, signalling incremental broadening of the capecitabine market. Regulatory approvals in these additional disease states would reinforce its multi-indication footprint.


By Distribution Channel: Hospitals Retain Primacy While Retail Accelerates
Hospitals captured 52.90% of capecitabine market share in 2025 thanks to oncology clinics embedded in tertiary centres. Physician-pharmacy integration allows on-site dispensing and close adherence monitoring, reinforcing institutional dominance. Nevertheless, retail and online pharmacies are set to rise 8.33% annually as health-systems pursue omni-channel strategies that improve refill convenience and geographic reach.
Medically integrated dispensing models inside health-systems have been shown to offer lower out-of-pocket prices on high-cost oral oncology drugs compared with external stores. Specialty pharmacies further bolster patient support through counselling and financing assistance. Consequently, channel diversification provides redundancy that strengthens overall capecitabine market resilience during localised shortages.
By Dosage Strength: 500 mg Tablets Streamline Pill Burden
The 500 mg strength accounted for 59.65% of capecitabine market size in 2025, reflecting clinician preference for fewer tablets per dosing cycle. Standard body-surface-area-based regimens frequently align neatly with 500 mg multiples, simplifying adherence. Meanwhile, the 150 mg dosage is forecast to expand at a 7.41% CAGR because it offers valuable flexibility for patients requiring dose reductions due to toxicity or genetic DPD deficiency.
Increasing uptake of pharmacogenetic testing reveals that roughly 8.4% of oncology patients harbour DPYD variants mandating upfront dose modification. Availability of both strengths therefore keeps prescribers nimble, enabling precision titration without compromising treatment schedules.
By Formulation: Generics Close In on Branded Leadership
Branded capecitabine retained 69.35% of market share in 2025 on the back of physician familiarity and comprehensive patient-support programmes. Generic formulations, however, are expanding briskly at 9.05% CAGR as payer pressure aligns with bioequivalence data. The US launch of Teva’s 150 mg and 500 mg tablets validates manufacturing quality and fosters physician confidence in substitutability.
Originator companies respond by highlighting premium quality assurance and exploring co-formulated or combination products. Over the forecast horizon, a bifurcated structure is expected in which price-sensitive segments migrate to generics while branded lines cater to patients valuing continuity and ancillary services.
Geography Analysis
North America’s entrenched oncology infrastructure, complete with medically integrated dispensing, ensures dependable access and reimbursement for capecitabine. The region’s high prevalence of colorectal cancer keeps demand stable, while expanding use of metronomic dosing in elderly pancreatic-cancer patients outlines incremental upside. Manufacturers hedging against domestic shortages are partnering with contract development and manufacturing organisations to maintain buffer inventory.
Asia-Pacific’s momentum stems from rapid improvements in diagnostic capacity and public awareness. Large-scale screening campaigns are identifying colorectal and gastric cancers earlier, bringing patients into treatment corridors where oral regimens offer logistical convenience. Government grants that offset capital costs for local API plants reduce vulnerability to external supply shocks, fostering sustainable growth in the capecitabine market.
Europe’s universal health systems facilitate equitable access, yet stringent pharmacovigilance standards demand upfront genotyping and therapeutic-drug-monitoring, slightly lengthening the treatment pathway. Regional manufacturers are investing in process intensification and green-chemistry initiatives to align with European Union sustainability goals, actions that may translate into competitive export positions over the long term.

Competitive Landscape
The capecitabine market displays moderate fragmentation. Established generic manufacturers—including Teva, Cipla and Dr Reddy’s—leverage vertically integrated supply chains to compete aggressively on price. Branded steward CHEPLAPHARM seeks to protect its franchise through patient-support services and exploration of novel combination regimens.
Supply-chain resilience has become a differentiator; companies are adopting dual-sourcing strategies and commissioning continuous-flow production lines that shorten cycle times and boost quality consistency. Manufacturers with diversified geographic footprints are better positioned to weather regulatory or logistical disruptions.
Strategic collaborations between pharmaceutical firms and diagnostics companies aim to streamline DPYD testing, shortening therapy onset and enhancing safety profiles. Furthermore, partnerships with specialty pharmacies reinforce patient-adherence programmes, a feature valued by payers aiming to minimise waste and maximise therapeutic outcomes.
Capecitabine Industry Leaders
CHEPLAPHARM Arzneimittel GmbH
Teva Pharmaceuticals
Viatris Inc
Hikma Pharmaceuticals
Dr Reddy's Laboratories
- *Disclaimer: Major Players sorted in no particular order

Recent Industry Developments
- May 2025: Data from a Japanese phase 2 study (UMIN000005209) showed that adding bevacizumab to capecitabine improved outcomes in metastatic colorectal-cancer patients aged ≥76 years who could not tolerate oxaliplatin or irinotecan.
- August 2024: Camber Pharmaceuticals introduced 150 mg and 500 mg capecitabine tablets in 60-count bottles, expanding generic availability in the United States.


Global Capecitabine Market Report Scope
Capecitabine is a nucleoside metabolic inhibitor that acts as a prodrug. The molecule gets converted to fluorouracil and inhibits DNA synthesis, thereby reduces the progression of cancer cells. It is administered orally and approved for the treatment of various cancers metastatic colorectal cancer, breast cancer, and others.
| Colorectal Cancer |
| Breast Cancer |
| Gastric Cancer |
| Pancreatic Cancer |
| Other Cancers |
| Hospitals |
| Oncology Clinics / Clinical Laboratories |
| Retail & Online Pharmacies |
| Others |
| 150 mg Tablets |
| 500 mg Tablets |
| Branded |
| Generic |
| North America | United States |
| Canada | |
| Mexico | |
| Europe | Germany |
| United Kingdom | |
| France | |
| Italy | |
| Spain | |
| Rest of Europe | |
| Asia-Pacific | China |
| Japan | |
| India | |
| South Korea | |
| Australia | |
| Rest of Asia-Pacific | |
| Middle East and Africa | GCC |
| South Africa | |
| Rest of Middle East and Africa | |
| South America | Brazil |
| Argentina | |
| Rest of South America |
| By Indication | Colorectal Cancer | |
| Breast Cancer | ||
| Gastric Cancer | ||
| Pancreatic Cancer | ||
| Other Cancers | ||
| By Distribution Channel | Hospitals | |
| Oncology Clinics / Clinical Laboratories | ||
| Retail & Online Pharmacies | ||
| Others | ||
| By Dosage Strength | 150 mg Tablets | |
| 500 mg Tablets | ||
| By Formulation | Branded | |
| Generic | ||
| Geography | North America | United States |
| Canada | ||
| Mexico | ||
| Europe | Germany | |
| United Kingdom | ||
| France | ||
| Italy | ||
| Spain | ||
| Rest of Europe | ||
| Asia-Pacific | China | |
| Japan | ||
| India | ||
| South Korea | ||
| Australia | ||
| Rest of Asia-Pacific | ||
| Middle East and Africa | GCC | |
| South Africa | ||
| Rest of Middle East and Africa | ||
| South America | Brazil | |
| Argentina | ||
| Rest of South America | ||


Key Questions Answered in the Report
What is the current value of the capecitabine market?
The capecitabine market size reached USD 523.98 million in 2026 and is forecast to hit USD 701.35 million by 2031 at a 6.01% CAGR.
Which cancer type drives the largest capecitabine demand?
Colorectal cancer led usage with a 45.02% capecitabine market share in 2025, owing to guideline-standard CAPOX regimens.
Why is Asia-Pacific considered the fastest-growing regional market?
Asia-Pacific shows a projected 7.18% CAGR thanks to wider screening, rising disposable incomes and government incentives for domestic API production that stabilise supply.
How rapidly are generics capturing capecitabine prescriptions?
Generic formulations are projected to grow at a 9.05% CAGR during 2026-2031 as multiple manufacturers obtain approvals and payers prioritise cost savings.
What is the principal safety concern restricting capecitabine adherence?
Hand-foot syndrome affects over half of treated patients and prompts dose interruptions or reductions in roughly one quarter of cases, necessitating proactive toxicity management strategies.
Page last updated on:


