
Market Overview
| Study Period | 2020 - 2031 |
|---|---|
| Forecast Data Period | 2026 - 2031 |
| Base Year Market Size (2025) | USD 39.02 Billion |
| Market Size (2026) | USD 40.41 Billion |
| Market Size (2031) | USD 48.10 Billion |
| Growth Rate (2026 - 2031) | 3.55 % |
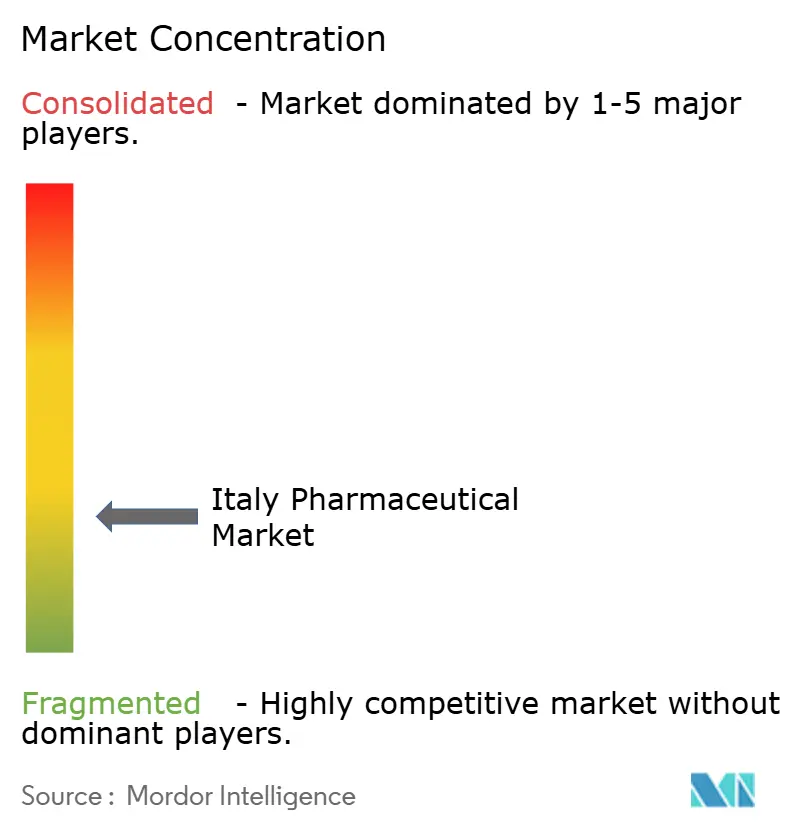
| Market Concentration | Low |
Major Players *Disclaimer: Major Players sorted in no particular order Image © Mordor Intelligence. Reuse requires attribution under CC BY 4.0. | |
Italy Pharmaceutical Market Analysis by Mordor Intelligence
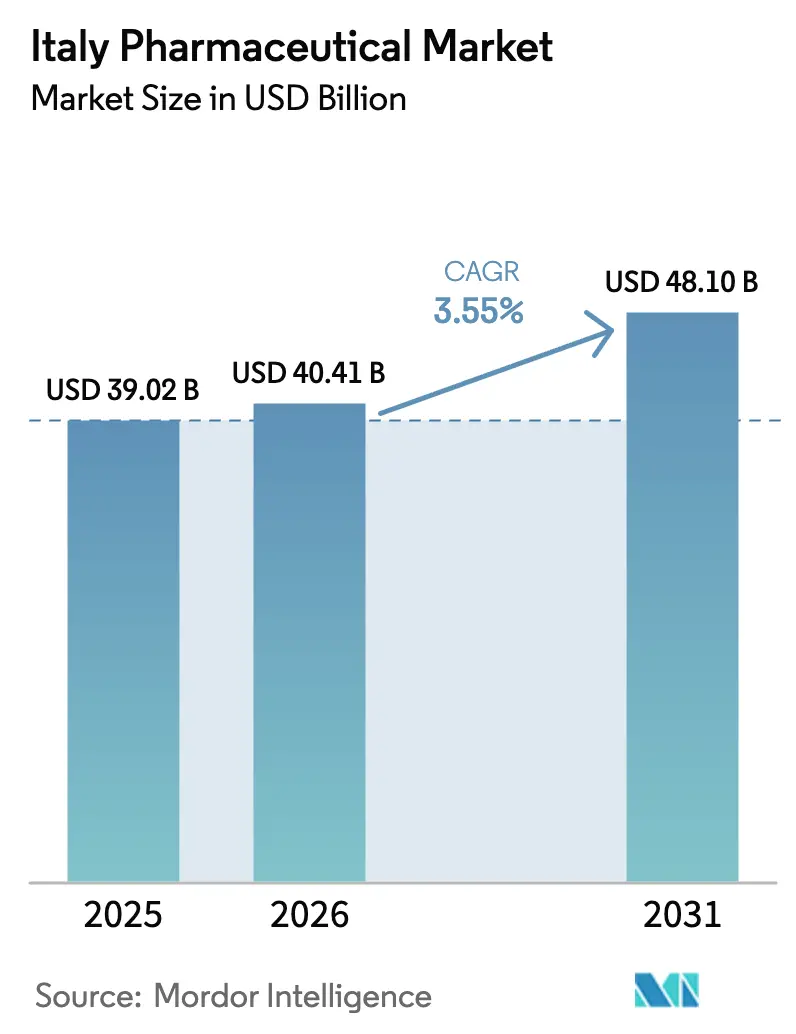
The Italy pharmaceutical market size is projected to expand from USD 40.41 billion in 2026 to USD 48.10 billion by 2031, registering a 3.55% CAGR between 2026 and 2031. A gradual shift toward high-value biologics, accelerated biosimilar substitution and regionally funded manufacturing upgrades under the National Recovery and Resilience Plan (PNRR) underpin this trajectory. While generic penetration remains stalled at a significant volume share, Italy’s position as Europe’s second-largest medicines producer supports export-oriented growth even as domestic margins tighten. Digital prescription infrastructure, broader pharmacy-led diagnostic services and rising self-care among older citizens further expand addressable demand. Capital commitments exceeding EUR 5.5 billion since 2024 from both domestic champions and multinationals underscore confidence in the long-term vitality of the Italy pharmaceutical market.
Key Report Takeaways
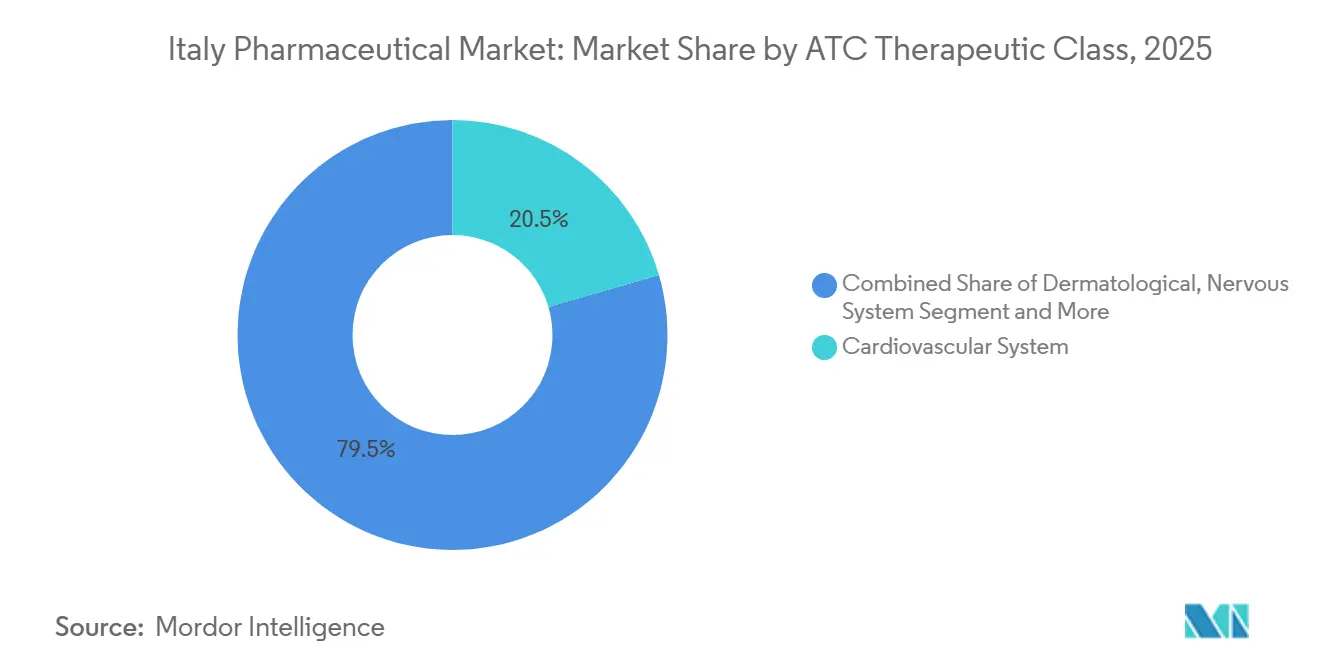
- By therapeutic class, cardiovascular therapies led with 20.54% of the Italy pharmaceutical market share in 2025, while blood and hematopoietic agents are forecast to advance at an 8.25% CAGR through 2031.
- By drug type, generics captured 55.54% of 2025 revenue, whereas biosimilars are projected to grow at a 6.65% CAGR during 2026-2031.
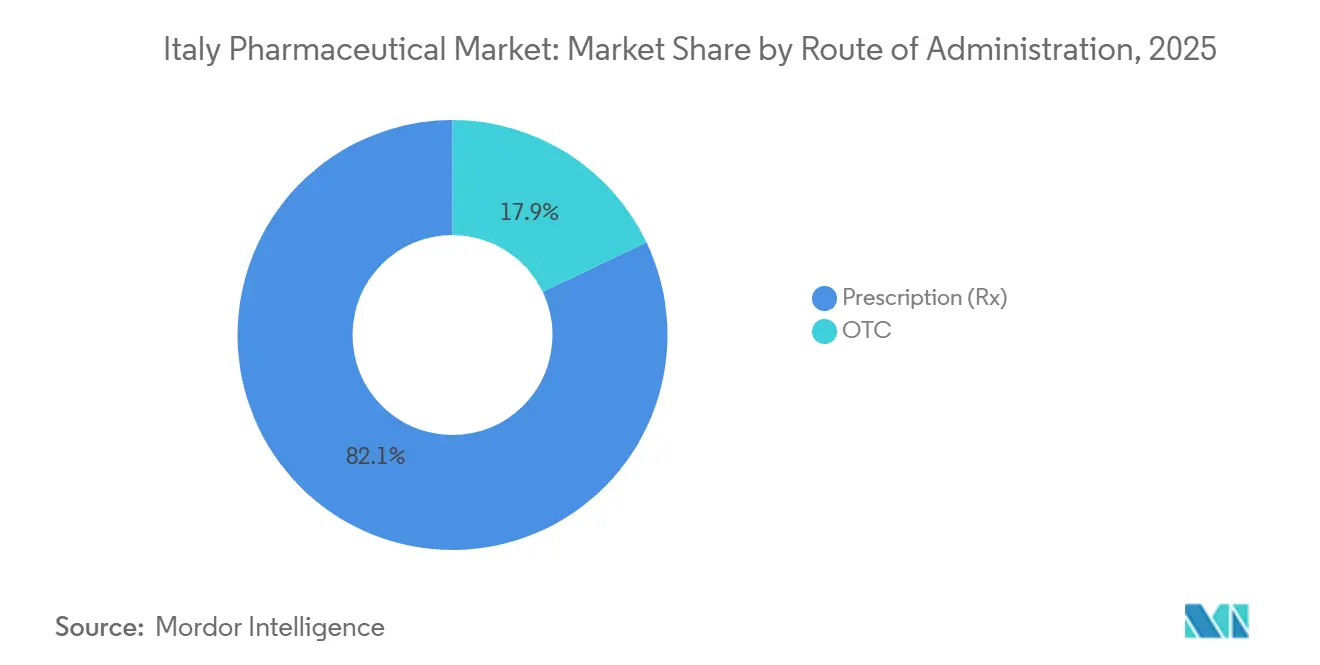
- By prescription type, prescription medicines accounted for 82.15% of 2025 sales, yet over-the-counter products are expanding at a 6.82% CAGR on the back of pharmacist-led chronic-disease screening.
- By route of administration, oral formulations generated 58.23% of 2025 revenue, but inhalation therapies will accelerate at a 6.42% CAGR owing to smart-device mandates.
- By distribution channel, hospital pharmacies dispensed 38.23% of 2025 volume, while online channels are on course for a 6.52% CAGR after Schedule C e-commerce liberalization.
Note: Market size and forecast figures in this report are generated using Mordor Intelligence’s proprietary estimation framework, updated with the latest available data and insights as of January 2026.
Italy Pharmaceutical Market Trends and Insights
Drivers Impact Analysis*
| Driver | (~) % Impact on CAGR Forecast | Geographic Relevance | Impact Timeline |
|---|---|---|---|
| Aging population & chronic disease burden | +1.2% | National, pressure in Liguria and Friuli-Venezia Giulia | Long term (≥ 4 years) |
| Government R&D tax incentives & regional grants | +0.6% | Southern regions prioritized under PNRR | Medium term (2-4 years) |
| Biosimilar uptake post-patent cliffs | +0.9% | National, led by Lombardy and Veneto | Short term (≤ 2 years) |
| Digital health & e-prescriptions | +0.5% | National rollout, advanced in Emilia-Romagna and Tuscany | Medium term (2-4 years) |
| Surge in orphan-drug demand | +0.7% | University hospital networks nationwide | Long term (≥ 4 years) |
| PNRR funds catalyzing life-sciences reshoring | +0.8% | Manufacturing hubs in Lazio, Lombardy, Emilia-Romagna | Medium term (2-4 years) |
| Source: Mordor Intelligence | |||


Aging Population & Chronic Disease Burden
Italy’s median age climbed to 48.4 years in 2025, the oldest in the EU, and citizens over 65 consume 4.2 times more medicines than working-age adults. Chronic illnesses affect 39.8% of adults, while polypharmacy among the over-75 cohort reached 28%, contributing to an 11% increase in adverse-event reports. Regions where seniors exceed 30% of residents, such as Liguria, post per-capita pharmaceutical outlays 22% above the national mean. The 2024 Chronic Care Plan now links reimbursement for cardiovascular and metabolic drugs to measurable hospital-avoidance outcomes, nudging suppliers to generate real-world evidence. Collectively, these demographics guarantee sustained demand across cardiometabolic and respiratory portfolios, bolstering the Italy pharmaceutical market even under tighter unit prices.
Government R&D Tax Incentives & Regional Grants
The PNRR earmarked EUR 1.67 billion for plant modernization and EUR 15.63 billion for broader health infrastructure, with preference for facilities located in Campania, Calabria and Sicily. A 5% tax credit on phase III trials in underserved provinces became effective in January 2025, already reversing a multi-year decline in oncology studies. Mid-cap companies capitalized on grants covering 35% of capital expenditure for sterile fill-finish lines, shortening payback periods to under five years. These fiscal carrots modestly lift forecast growth yet deliver oversized benefits to regions historically sidelined in drug development, gradually rebalancing the Italy pharmaceutical industry’s research footprint.
Biosimilar Uptake Post-Patent Cliffs
Italy achieved a 67% average biosimilar substitution rate in 2024, ahead of Germany and France, after regional health authorities mandated first-line biosimilar prescribing[1]Agenzia Italiana del Farmaco, “Rapporto Attività 2025,” aifa.gov.it. Patent expiries for adalimumab and ranibizumab should unlock EUR 800 million in annual National Health Service savings by 2027, freeing budgets for novel cell- and gene-therapies. Lombardy already records 86.8% uptake for rituximab and bevacizumab biosimilars, yet insulin molecules lag with just 12% penetration because clinicians hesitate to switch stable patients. Educational campaigns funded under the 2025 Budget Law aim to close this gap. Stronger biosimilar economics continue to support the Italy pharmaceutical market, though manufacturers face net-price compression averaging 35%.
Digital Health & E-Prescriptions Accelerating Access
Electronic Health Record coverage reached 89% of residents in 2025, enabling prescription portability across Italy and cutting median fulfillment time from 48 hours to six. Teleconsultations for diabetes and hypertension surged 67%, generating 1.8 million e-prescriptions that AIFA recognizes as equal to in-person scripts for reimbursement. Smart inhalers, compulsory for biologic asthma drugs since 2025, uploaded 4.2 million adherence events to the national database within 18 months, allowing payers to connect payment with real-world usage. Yet 21 distinct regional platforms hamper nationwide analytics, delaying the deployment of AI clinical-decision tools that could further streamline care.
Restraints Impact Analysis*
| Restraint | (~) % Impact on CAGR Forecast | Geographic Relevance | Impact Timeline |
|---|---|---|---|
| High cost of innovative therapies | -0.8% | National, acute in Lazio and Campania | Medium term (2-4 years) |
| Stringent AIFA price & reimbursement | -1.1% | National, centralized through AIFA | Short term (≤ 2 years) |
| Margin pressure from generic penetration | -0.4% | National, strongest in primary care | Long term (≥ 4 years) |
| Carbon-footprint compliance costs | -0.3% | National, EU-wide alignment | Medium term (2-4 years) |
| Source: Mordor Intelligence | |||
Stringent AIFA Price & Reimbursement Negotiations
AIFA’s payback clawed back EUR 1.24 billion from suppliers in 2024, 18% more than the prior year. Negotiations now average 18 months, delaying access to 14 EMA-cleared therapies, including new GLP-1 and PCSK9 agents. Managed-entry contracts cover 42% of innovative launches, yet just one-third possess robust data systems to confirm real-world outcomes, skewing financial exposure toward manufacturers. Additional 12% price cuts applied by Lombardy and Veneto hospital tenders multiply complexity. Because the 2025 Budget Law caps annual drug spending growth below projected market expansion, net realized prices could erode by 0.7 percentage points annually through 2031, dampening returns across the Italy pharmaceutical market.
High Cost of Innovative Therapies
CAR-T interventions priced between EUR 320,000 and EUR 400,000 generated waiting lists exceeding four months in 2025, pushing 23% of eligible Italians abroad for treatment. Orphan drugs consumed 11% of national drug outlays yet served only 2% of patients, reviving debate over AIFA’s EUR 50,000 cost-effectiveness ceiling. Specialty expenditure is projected to hit 58% of total pharmaceutical spending by 2030, up from 47% in 2025. Budget-strapped regions such as Lazio postponed non-urgent biologic purchases by up to 90 days, widening north–south care gaps and shaving incremental demand off the Italy pharmaceutical market size.
*Our forecasts treat driver/restraint impacts as directional, not additive. The impact forecasts reflect baseline growth, mix effects, and variable interactions.
Segment Analysis
By ATC/Therapeutic Class: Oncology Biologics Reshape Blood Segment
Blood and hematopoietic agents are projected to generate the fastest 8.25% CAGR, positioning the subgroup as a central driver of the Italy pharmaceutical market size through 2031. CAR-T rollouts and biosimilar erythropoietins underpin this expansion, though limited infusion-center capacity currently constrains patient throughput. Cardiovascular drugs commanded 20.54% of 2025 revenue, but growth stagnates as statins and ACE inhibitors face 12% annual price erosion in regional tenders. Gastrointestinal agents anchored by GLP-1 agonists outperformed average prescription growth, reflecting rising obesity management.
Oncology biologics within the blood category increasingly dominate hospital budgets even as reimbursement hurdles persist. Biosimilar filgrastim and pegfilgrastim already captured near-total share, illustrating clinician comfort with hematology substitutes. Respiratory biologics for severe asthma gained traction after inhaler-based adherence tracking became compulsory, aiding formulary inclusion. Dermatology’s IL-17 and IL-23 inhibitors continued robust adoption among biologic-naïve psoriasis patients, reinforcing specialty-driven momentum for the Italy pharmaceutical market.


By Drug Type: Biosimilar Momentum Challenges Generic Plateau
Generics controlled 55.54% of 2025 sales but posted just 1.2% volume growth due to entrenched prescriber preferences for branded SKUs. Biosimilars, by contrast, are set to expand at a 6.65% CAGR, unlocking EUR 2.1 billion in fresh revenue as adalimumab, ranibizumab and denosumab copies push substitution rates toward 70%. The Italy pharmaceutical market share tied to branded specialty drugs remains resilient, with Novartis’s Entresto alone delivering EUR 340 million in national sales.
Teva and Viatris each launched seven additional biosimilars during 2024-2025, pricing 35-40% below originators and capturing quick hospital uptake. Regional decrees mandating biosimilar first-line use for naïve patients accelerated the shift, especially in Lombardy and Veneto. Intensifying biologics competition is pushing generic manufacturers out of low-margin commodities, consolidating supply and subtly reshaping the Italy pharmaceutical industry’s competitive contours.
By Prescription Type: OTC Self-Care Gains Regulatory Tailwinds
Prescription drugs retained an 82.15% revenue share in 2025, centered on chronic-disease therapies reimbursed by the National Health Service. Yet the OTC segment is projected to climb 6.82% annually thanks to Law 69/2024, which lets pharmacists perform point-of-care diagnostics and recommend suitable non-prescription treatments. Cost-sharing reforms shifted EUR 280 million in expenditures toward OTC analgesics, antihistamines and digestive aids last year.
Vitamin D, omega-3 and probiotics enjoyed rapid uptake among aging consumers, buoyed by nationwide preventive-care campaigns. The Italy pharmaceutical market size associated with self-medication is therefore poised to expand faster than physician-directed categories, although stringent antimicrobial stewardship has already trimmed discretionary antibiotic issuance.
By Route of Administration: Inhalation Devices Embed Digital Tracking
Oral drugs still account for 58.23% of 2025 turnover across cardiovascular, metabolic and OTC categories. However, inhalation products will post a 6.42% CAGR as January 2025 legislation obliges smart-inhaler coupling for all reimbursed asthma biologics[2]European Respiratory Society, “Smart Inhaler Adherence Data,” ersnet.org . Chiesi’s digital-biologic program advances this trend, feeding 4.2 million adherence datapoints into national records during the first half of 2026.
Parenteral formats dominate oncology and autoimmune care, with subcutaneous alternatives such as Roche’s rituximab shaving hospital chair time by 18%. Topical and transdermal platforms segment remains stable but benefits from IL-17 inhibitor popularity. Momentum in connected inhalation technology exemplifies how digital convergence reinforces specialty growth throughout the Italy pharmaceutical market.
By Distribution Channel: E-Commerce Disrupts Traditional Retail
Hospital pharmacies dispensed 38.23% of volume in 2025 as biologics and advanced injectables remain centrally procured. Decree 17/2024 opened Schedule C drugs to online sale, propelling web-based channels toward a 6.52% CAGR. Nearly 890,000 new consumers made a first digital purchase in 2025, lured by 24-hour delivery in Rome, Milan and Turin.
Independent brick-and-mortar outlets face squeezed margins from generic price wars and online cannibalization, leading to 340 closures in 2024. Pharmacy chains now embrace click-and-collect to integrate digital convenience with in-store counseling. Altogether, omnichannel evolution is redefining patient access models and bolstering competition within the Italy pharmaceutical market.
Geography Analysis
Italy’s northern triangle—Lombardy, Emilia-Romagna and Lazio—generated a conspicuous share of 2025 drug consumption and houses 71% of R&D and manufacturing infrastructure. The Italy pharmaceutical market size linked to these three regions outweighs that of the south, yet Campania, Sicily and Calabria spend 34% more per capita on branded cardiovascular products because biosimilar adoption trails national norms by up to 25 percentage points. The PNRR directs EUR 4.6 billion toward southern health infrastructure, including EUR 680 million for cold-chain upgrades expected to cut biologic spoilage to Lombardy-like levels by 2027.
Manufacturing capital continues to cluster in the center-north. Novo Nordisk’s semaglutide megasite in Lazio, Chiesi’s biotech hub in Emilia-Romagna and Novartis’s radiopharmaceutical plant in Lombardy collectively add 2,800 skilled jobs, reinforcing northern dominance. Tuscany meanwhile rose to a 14% share of national phase III oncology trials after offering 22% R&D tax credits. Conversely, Lazio’s EUR 1.1 billion deficit forced 90-day biologic purchase delays, highlighting how fiscal strain stifles access even where capacity exists.
Cross-border pharmaceutical tourism fell 18% in 2025 due to enhanced e-prescription portability across the EU, though 12,400 Italians still traveled for CAR-T therapy, indicating domestic infusion constraints. The national trade surplus in pharmaceuticals reached EUR 8.2 billion, buoyed by biologic exports and API shipments. New incentives for southern clinical trials intend to spread this upside geographically, but for now, the Italy pharmaceutical market remains regionally bifurcated between innovation-rich north and demand-heavy south.
Regulatory Landscape
Italy's pharmaceutical market access framework is anchored by the Italian Medicines Agency (AIFA), which governs pricing and reimbursement for National Health Service (NHS) medicines and issues national rules implemented through regional procurement and prescribing pathways. A key 2026 update is AIFA's revised guideline for the compilation of the dossier supporting HTA for price and reimbursement submissions, effective for dossiers submitted from 1 April 2026, which increases the evidentiary bar for clinical and economic data at launch.
Alongside this, the 2026 Budget Law maintained cost-containment pressure through a mandatory 5% reduction on the public price of NHS-reimbursed medicines, described as non-suspendable, tightening net price realization for suppliers. On 7 August 2025, AIFA repealed Notes 2, 4, and 41 to reduce prescribing bureaucracy, while innovative therapies continue to enter via the EU centralized authorization pathway (EMA assessment and European Commission decision). After authorization, AIFA determines reimbursement conditions and any managed-entry arrangements in Italy.
Value Chain Analysis
Italy's pharmaceutical value chain covers API and intermediate sourcing, finished-dose manufacturing (including sterile fill-finish and biologics), quality release, and distribution across public procurement and retail channels. The country also operates as an export-oriented manufacturing base, supported by industry clusters and a broad supplier ecosystem, with Farmindustria reporting production value of EUR 74 billion in 2025 and exports of EUR 69 billion, reinforcing Italy's role beyond domestic consumption.
Market access and monetization sit at the center of the chain, with AIFA coordinating pricing and reimbursement processes, while regional authorities influence tender outcomes, formulary access, and biosimilar uptake. Hospital pharmacies remain pivotal for specialty and biologics distribution, supported by wholesalers and specialized cold-chain logistics providers (including DHL Supply Chain, Kuehne + Nagel, DB Schenker, UPS Healthcare, PHSE Srl, and Bomi Group) to maintain national coverage and temperature-controlled delivery. The main friction points are payback and tender-driven net price erosion, along with rising compliance requirements that shape portfolio prioritization and manufacturing investment decisions.
Competitive Landscape
The top-10 suppliers controlled roughly two-thirds of 2025 sales, placing the Italy pharmaceutical market in a moderately concentrated posture[3]Farmindustria, “Industry Report 2024-2025,” farmindustria.it. Domestic champions Chiesi, Recordati and Alfasigma pumped EUR 2.1 billion into new biomanufacturing to counter multinationals’ reshoring waves. Novo Nordisk’s EUR 2.34 billion Lazio site and Johnson & Johnson’s EUR 580 million Latina upgrade exploit wage advantages and PNRR subsidies, intensifying competition along the biologics value chain.
White-space in orphan diseases remains underexploited despite 94 EMA designations secured by Italian sponsors in 2024. Recordati has already lifted peak-sales guidance for rare-disease assets by 18%, signaling strategic pivot toward neurometabolic niches. Teva and Viatris captured biosimilar volume with seven launches priced 40% below originators but exited several low-margin generic lines to protect profitability. Novartis’s spate of 14 radiopharmaceutical patent filings underscores competition shifting to precision modalities that circumvent generic substitution.
Sustainability rules now shape tender scores. Sanofi and Roche integrated end-to-end carbon metrics into 2025 bids to fulfill EU Directive 2024/825, absorbing higher overhead yet gaining evaluative credit. Smaller players lag in audit-ready emission tracking, risking disqualification and reinforcing scale advantages that could elevate future concentration in the Italy pharmaceutical industry.
Italy Pharmaceutical Industry Leaders
AbbVie Inc.
AstraZeneca plc
Bayer AG
GlaxoSmithKline plc
F. Hoffmann-La Roche AG
- *Disclaimer: Major Players sorted in no particular order

Market Opportunities and Future Outlook
Regulatory modernization creates near-term whitespace for companies that can shorten access timelines through stronger launch dossiers and outcome-ready evidence generation. A concrete opportunity is the government's pharmaceutical-legislation reform agenda, which mandates one or more legislative decrees for rationalization of sector rules by 31 December 2026, alongside AIFA's HTA-oriented dossier guideline effective 1 April 2026. Together, these moves reward manufacturers that standardize submissions, support managed-entry contracts, and operationalize real-world data collection across regions.
Industrial policy and reshoring investments are also expanding local capability across higher-value modalities, creating partnering and supply opportunities in biologics, plasma-derived products, injectables, and high-potency APIs. Recent in-scope proof points include Axplora's March 2026 announcement of a USD 60 million expansion at its Farmabios site in Gropello Cairoli, including a new 4,500 sqm R&D hub, Kedrion Biopharma's May 2026 plan to invest EUR 150 million to triple capacity at Bolognana (supported by a EUR 14 million MIMIT development contract), and Fisiopharma's April 2026 hiring start tied to a EUR 27 million injectable and pre-filled syringe project in Palomonte, Salerno. These investments align with the report's emphasis on high-value biologics and sterile manufacturing upgrades under national programs, and they create openings for CDMOs, packaging and device suppliers (including connected inhalation), and cold-chain distribution networks serving both domestic demand and exports.
Recent Industry Developments
- May 2026: Kedrion Biopharma announced a EUR 150 million investment to triple production capacity at its Bolognana facility, supported by a EUR 14 million development contract from the Ministry of Enterprises and Made in Italy (MIMIT). The expansion strengthens Italy-based supply of plasma-derived therapies used in rare and chronic conditions. It also adds domestic capacity in a segment where continuity of supply and qualified manufacturing scale directly shape hospital availability.
- July 2025: SOMAÍ launched EU-GMP cannabinoid medicines in Italy through a partnership with Materia Medica Processing. The launch expanded the portfolio of regulated cannabinoid-based products supplied into the Italian market. It reinforced the role of specialized manufacturing and compliant distribution pathways for controlled or highly regulated therapeutic categories.
- August 2024: AIFA reported a national average biosimilar substitution rate of 67% during 2024, supported by regional health-authority measures that promote biosimilars as first-line options for eligible patients. The milestone increased competitive intensity for originator biologics and raised the importance of tender strategy and continuity-of-supply credentials. It also accelerated hospital-pharmacy channel volume shifts toward biosimilar manufacturers in key regions such as Lombardy and Veneto.


Research Methodology Framework and Report Scope
Market Definition and Coverage
For this methodology, the Italy pharmaceutical market is defined as the value of medicines sold for human use in Italy, covering prescription and non-prescription drugs across major therapy areas and channels.
Scope exclusions: Medical devices, diagnostics, vaccines for veterinary use, and non-drug wellness supplements are excluded from this market sizing.
Segmentation Overview
- By ATC / Therapeutic Class
- Blood & Hematopoietic Organs
- Cardiovascular System
- Dermatological
- Gastrointestinal & Metabolism
- Nervous System
- Respiratory System
- Others
- By Drug Type
- Branded
- Generic
- Biosimilars
- By Prescription Type
- Prescription Drugs (Rx)
- OTC Drugs
- By Route of Administration
- Oral
- Parenteral
- Inhalation
- Topical
- Others
- By Distribution Channel
- Hospital Pharmacies
- Retail Pharmacies
- Online Pharmacies
- Wholesalers / Distributors
Data Sources, Market Sizing, and Validation
Desk Research
Desk work starts with building a clean fact base on Italy drug demand and supply, and then mapping it to a value model. We mostly rely on public and official sources such as AIFA publications and pricing notes, Italian Ministry of Health releases, ISTAT demographic and health indicators, OECD Health Statistics, and Eurostat trade and production series. To make sure context is correct, we also review European-level material from bodies such as the European Medicines Agency.
After the official datasets, we use supporting sources like annual reports, investor decks, audited filings, press releases, and association websites that discuss manufacturing and distribution trends. In a few places, paid subscriptions are used to cross-check company financials, patent activity, and shipment or tender signals when public data is not granular enough for Italy-only splits. These desk sources are illustrative and not exhaustive, and many other documents were also consulted to collect data, validate assumptions, and clarify open questions.
Primary Interviews and Surveys
Primary work is used to test the desk assumptions and fill gaps around channel mix, pricing evolution, and how therapy demand is shifting across regions in Italy. We speak with people from manufacturers, distributors, pharmacies, hospital procurement, and healthcare professionals so that volumes and value drivers can be checked from more than one angle. Input is also taken on reimbursement and switching behavior (generic and biosimilar uptake) because these can move the final value even when patient volumes look steady.
Distribution of primary research fieldwork respondents
| Company type | Respondent position |
|---|---|
| Top tier: 32% | CXOs: 16% |
| Mid tier: 48% | Functional/Unit leaders: 26% |
| Smaller Players: 20% | Managers: 58% |
Market-Sizing & Forecasting
Sizing is built using a top-down and bottom-up approach where national medicine consumption and supply indicators are reconstructed into market value for Italy, and then checked against smaller roll-ups to keep totals realistic. In practice, we use a demand pool that is anchored to therapy usage and channel movement, and then value is formed by applying price and mix assumptions.
Key inputs include Italy population and age mix (since chronic therapy demand is age linked), AIFA and public pricing and reimbursement signals, Rx versus OTC split by channel, branded versus generic versus biosimilar mix, and import and export flows that can change local availability and reported value. Because one dataset rarely covers everything, missing pieces are handled through conservative proxies that are then verified in interviews, especially for fast-growing specialty areas and online pharmacy sales.
For forecasting, scenario analysis is applied around a central case and then tuned with expert feedback on near-term events and policy changes. The forward view is mainly driven by expected therapy mix shifts, biosimilar substitution timing, and inflation and currency effects on ex-factory and retail prices, followed by channel margin movement.
Data Validation & Update Cycle
Model outputs are checked against independent signals before sign-off, which includes reviewing trend breaks, sudden share jumps, and any mismatch between value growth and expected volume movement. If an anomaly is found, assumptions are revisited and, when needed, follow-up calls are triggered to confirm whether a real market shift happened.
A multi-step review is done across the dataset and the written logic so that definitions, math, and units stay consistent. Reports are refreshed annually, with interim updates added when material events occur, such as reimbursement changes, major supply constraints, or policy shifts affecting dispensing. Before delivery, a final pass is completed so the client receives the most current view available.
Mordor Intelligence's Italy Pharmaceutical Market Sizing Compared With Other Published Estimates
Published market sizes for Italy pharmaceuticals often do not match because the scope is not identical and the pricing point in the supply chain is not always the same. Differences also come from how OTC is treated, how biosimilars are priced over time, and how quickly assumptions are refreshed after policy and reimbursement updates.
Some published figures roll broader health-related spending into pharmaceuticals, or they treat parallel trade and export-heavy manufacturing as local market value. Those expansions raise totals, and in Mordor Intelligence the count is limited to human prescription and non-prescription drug sales within Italy, then cross-checked with channel mix signals from hospital, retail, and online dispensing.
Benchmark comparison
| Source | Market Size | Gaps in Research Methodology |
|---|---|---|
| Mordor Intelligence | USD 39.02 B (2025) | |
| Industry Association A | USD 35.60 B (2024) | Uses a prior-year base and may lean toward ex-manufacturer pricing, which can understate retail value when wholesaler and pharmacy margins are not fully captured, especially for OTC-heavy categories. |
| Trade Journal B | USD 43.80 B (2025) | Often includes adjacent items like consumer health supplements or broader healthcare retail spend, and may apply uniform price growth assumptions across therapy areas that do not reflect biosimilar price erosion. |
The spread in the table is mainly explained by price-point choice, year alignment, and whether adjacent consumer health spend is included. When scope stays tied to medicines sold in-country and the mix assumptions are checked with channel feedback, totals remain traceable to clear variables and repeatable steps.


Key Questions Answered in the Report
How fast is prescription-drug spending growing in Italy?
Prescription medicines are advancing more slowly than other categories, rising below the 3.55% market CAGR as cost caps and rebate mechanisms compress net prices.
Which segment is expanding the quickest?
Blood and hematopoietic agents are forecast to post an 8.25% CAGR through 2031 on the back of CAR-T and biosimilar erythropoietin uptake.
What drives Italy's strong biosimilar penetration?
Regional mandates requiring biosimilar first-line prescribing plus aggressive tender pricing boosted national substitution rates to 67% in 2024.
How will e-commerce change drug distribution?
Following Schedule C liberalization, online pharmacies are expected to grow at 6.52% annually, siphoning share from traditional retail outlets, especially in urban areas.
Why is regional disparity a concern?
Northern regions house most R&D and manufacturing capacity, while southern regions spend more per capita on branded drugs due to slower biosimilar adoption, widening access and budget gaps.
What is the impact of EU carbon rules on suppliers?
Directive 2024/825 adds roughly EUR 50 million in annual compliance costs but can improve tender scores for companies that document full supply-chain emissions.
Page last updated on:


 Your data is secure and never sold or shared.


