
Market Overview
| Study Period | 2020 - 2031 |
|---|---|
| Forecast Data Period | 2026 - 2031 |
| Base Year Market Size (2025) | USD 14.04 Billion |
| Market Size (2026) | USD 14.86 Billion |
| Market Size (2031) | USD 19.78 Billion |
| Growth Rate (2026 - 2031) | 5.88 % |
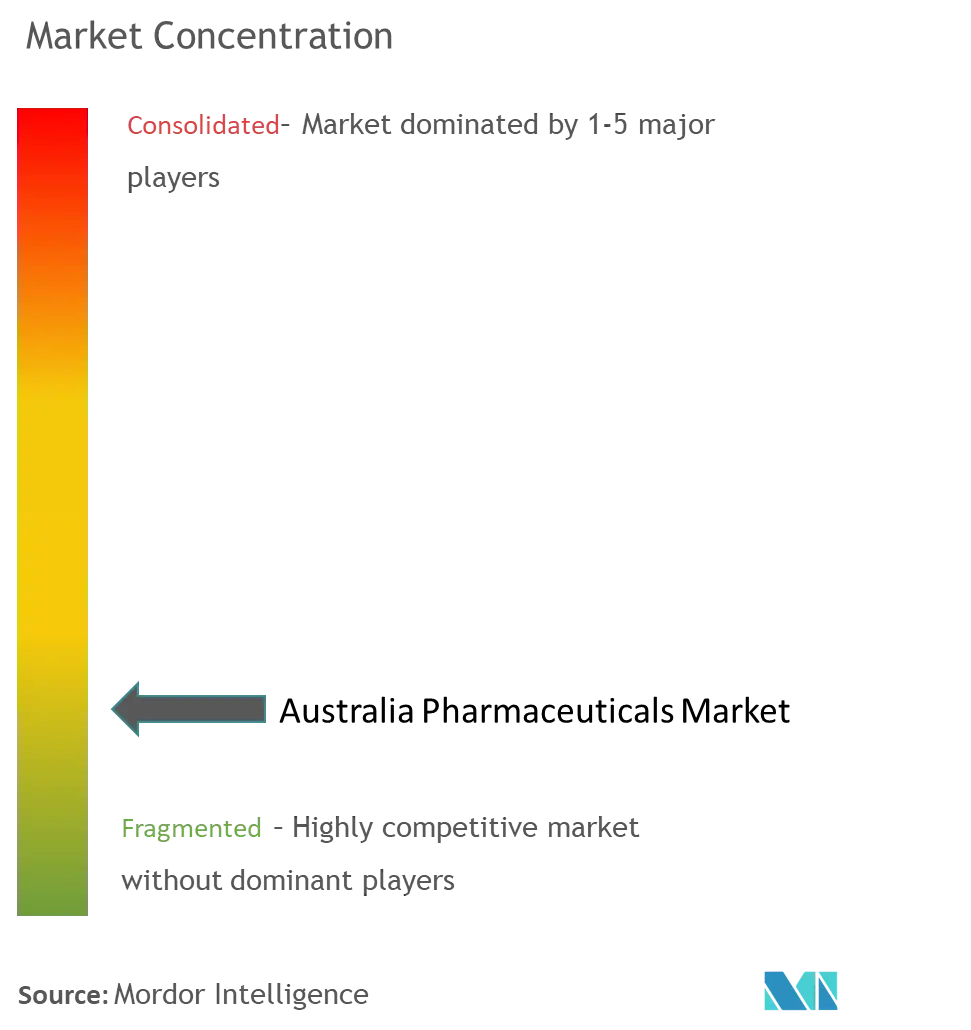
| Market Concentration | Medium |
Major Players *Disclaimer: Major Players sorted in no particular order Image © Mordor Intelligence. Reuse requires attribution under CC BY 4.0. | |
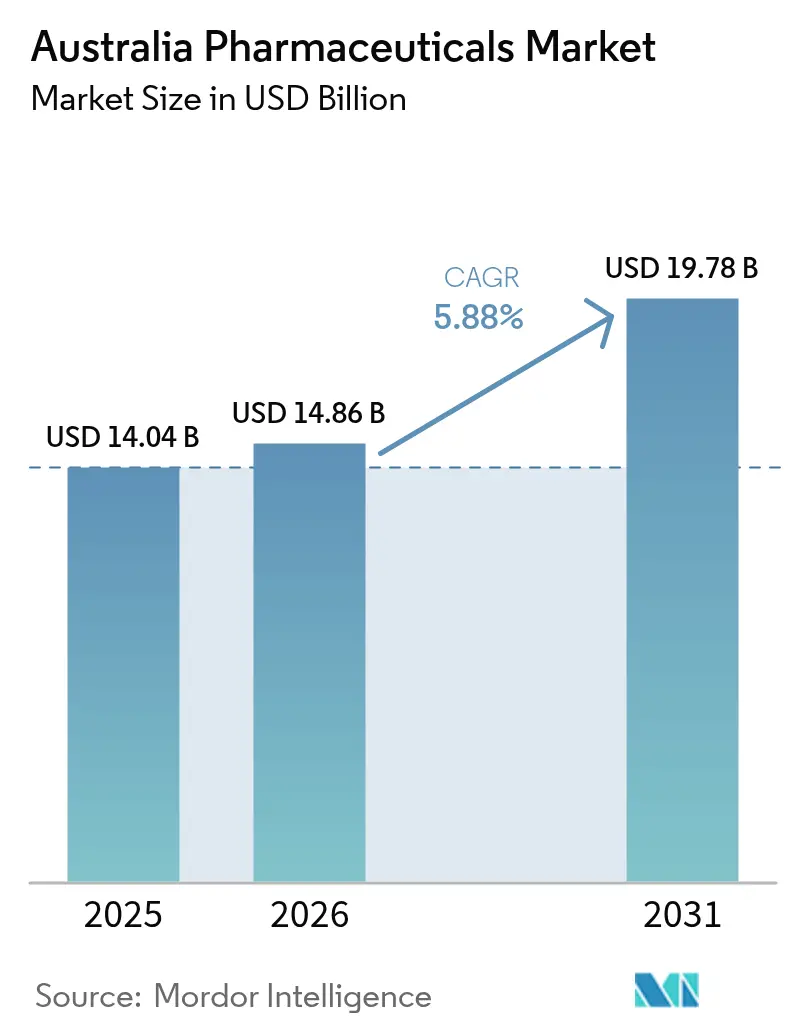
Australia Pharmaceuticals Market Analysis by Mordor Intelligence
Australia pharmaceutical market size in 2026 is estimated at USD 14.86 billion, growing from 2025 value of USD 14.04 billion with 2031 projections showing USD 19.78 billion, growing at 5.88% CAGR over 2026-2031. Robust demand stems from a surging geriatric cohort, rising chronic disease prevalence and stepped-up public investment under the Pharmaceutical Benefits Scheme (PBS). At the same time, priority-review pathways at the Therapeutic Goods Administration (TGA) and rolling submissions for rare-disease therapies shorten regulatory lead time, enabling faster commercialisation of high-value biologics. Supply-chain resilience also improves as government grants spur on-shore manufacturing of antimicrobials, injectables and mRNA vaccines, trimming Australia’s 90% import dependence for active pharmaceutical ingredients (APIs). Digital health adoption rounds out the growth narrative: more than 219 million electronic prescriptions have been issued since 2020, accelerating the shift toward online and hybrid dispensing models that boost medication adherence and cut dispensing costs.
Key Report Takeaways
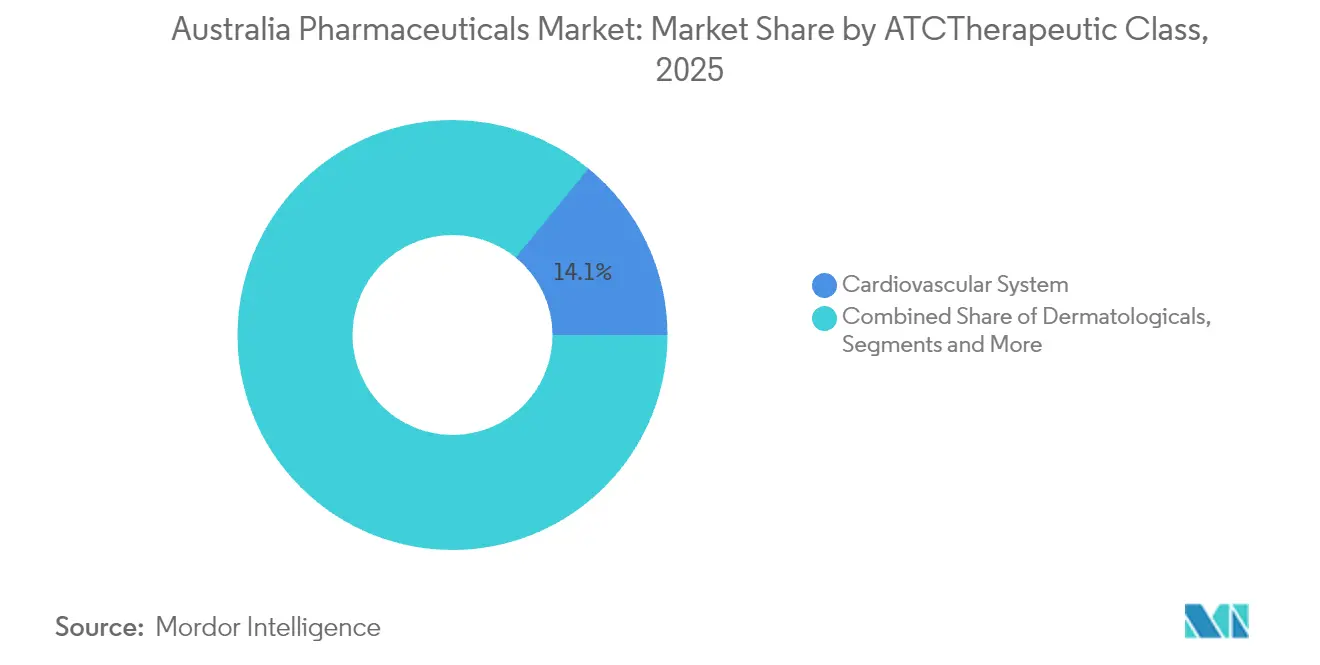
- By ATC/Therapeutic class, cardiovascular treatments captured 14.10% of Australia pharmaceutical market share in 2025, while oncology therapies are advancing at a 7.02% CAGR through 2031.
- By drug type, prescription medicines held 86.10% Australia pharmaceutical market share in 2025; over-the-counter products are on track for 6.62% CAGR to 2031.
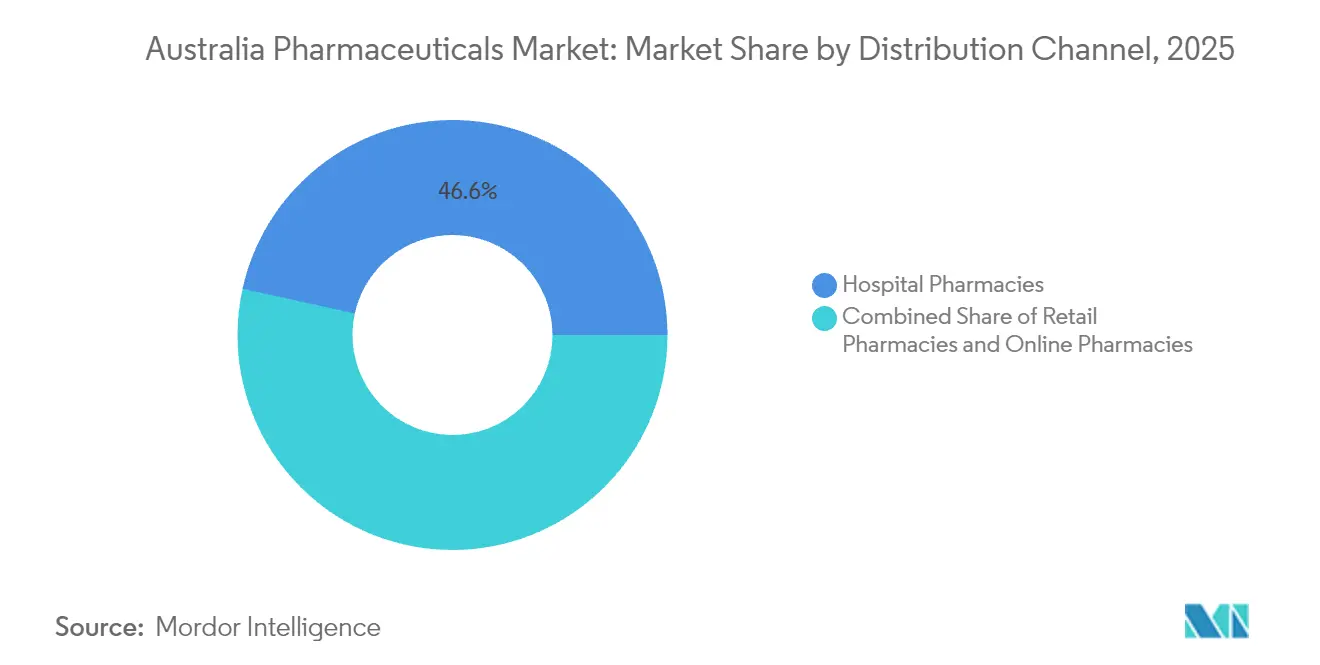
- By distribution channel, hospital pharmacies accounted for 46.55% of the Australia pharmaceutical market size in 2025, while online pharmacies represent the fastest-growing route at 6.92% CAGR.
- By formulation, tablets commanded 51.40% share of the Australia pharmaceutical market size in 2025; injectables are projected to expand at 6.74% CAGR between 2026-2031.
Note: Market size and forecast figures in this report are generated using Mordor Intelligence’s proprietary estimation framework, updated with the latest available data and insights as of 2026.
Australia Pharmaceuticals Market Trends and Insights
Drivers Impact Analysis*
| Driver | (~ ) % Impact on CAGR Forecast | Geographic Relevance | Impact Timeline |
|---|---|---|---|
| Rising geriatric population & chronic disease burden | +1.8% | National – metro clusters | Long term (≥ 4 years) |
| Strong government funding via PBS expansions | +1.2% | National – rural access gains | Medium term (2-4 years) |
| Growing adoption of biologics & biosimilars | +0.9% | National – metro early uptake | Medium term (2-4 years) |
| Digital health & e-prescriptions improving adherence | +0.7% | National – urban acceleration | Short term (≤ 2 years) |
| Manufacturing reshoring incentives | +0.5% | National – industrial hubs | Long term (≥ 4 years) |
| Expanding clinical-trial ecosystem enabling early access | +0.4% | National – research centers | Medium term (2-4 years) |
| Source: Mordor Intelligence | |||
Rising Geriatric Population & Chronic Disease Burden
Australia’s over-65 cohort already exceeds 4.2 million and is projected to lift healthcare outlays six-fold by 2063; cardiovascular disease alone affects 1.2 million people, while diabetes management costs hit AUD 1.2 billion in 2024. Complex polypharmacy linked to multimorbidity drives recurring prescriptions, evidenced by immunoglobulin revenue rising 20% in 2024. Newly introduced 60-day dispensing aims to cut patient visits, yet adoption remains at 30% of eligible scripts as clinician inertia persists. The interplay of aging, chronic illness and streamlined refills generates durable demand that buffers the Australia pharmaceutical market against macro-economic slowdowns.
Strong Government Funding Via PBS Expansions
Federal pharmaceutical outlays are set to climb from USD 13 billion to USD 21 billion by 2031, aided by 264 new or amended PBS listings approved since July 2022. Annual patient co-payments are capped at AUD 25 through 2029, underpinning equitable access to high-value oncology drugs such as trastuzumab deruxtecan, whose PBS price fell from more than USD 160,000 to AUD 31.60 per script. [1]Australian Government Department of Health, “Life-prolonging breast cancer drug receives expanded access on the PBS,” health.gov.au Planned Health Technology Assessment reforms promise PBS listings within six months for superior products, accelerating revenue conversion for 90% of qualifying submissions.
Growing Adoption Of Biologics & Biosimilars
Streamlined TGA pathways have widened biosimilar uptake: trastuzumab and bevacizumab biosimilars worth AUD 80 million entered the market under a Biocon-Sandoz alliance. Provisional-registration processes now target 220 working days, easing entry for novel immunotherapies such as tislelizumab for lung and oesophageal cancer. As cost-saving biosimilars gain formulary preference, biologic innovation remains strong with GLP-1 receptor agonists and gene therapies advancing through review pipelines.
Digital Health & E-Prescriptions Improving Adherence
More than 219 million electronic prescriptions have been dispensed since 2020, supported by AUD 111.8 million in infrastructure investment that links prescribers, pharmacies and patients nationwide. Active Script List functions allow multi-script management across channels, reinforcing adherence while reducing transcription errors. Regulatory agencies, however, caution against AI-assisted asynchronous prescribing following a rise in telehealth complaints, prompting new guidance that mandates real-time clinician oversight.
Restraints Impact Analysis*
| Restraint | (~ ) % Impact on CAGR Forecast | Geographic Relevance | Impact Timeline |
|---|---|---|---|
| Stringent TGA regulatory timelines & compliance costs | -0.8% | National | Medium term (2-4 years) |
| PBS price controls squeezing margins | -0.6% | National | Long term (≥ 4 years) |
| Supply-chain vulnerability to imported APIs | -0.5% | National | Medium term (2-4 years) |
| Affordability gaps among younger demographics | -0.3% | National | Long term (≥ 4 years) |
| Source: Mordor Intelligence | |||
Stringent TGA Regulatory Timelines & Compliance Costs
Standard prescription approvals require 255 working days and even priority reviews take 150 days, extending cash-burn for innovative therapies [2]Therapeutic Goods Administration, “Apply for a prescription medicine via the priority review pathway,” tga.gov.au. Mandatory eCTD submissions and high-risk audits further inflate compliance outlays, particularly for small and mid-cap sponsors lacking in-house regulatory capacity.
PBS Price Controls Squeezing Margins
Price-disclosure rules link PBS reimbursements to actual market prices, cutting originator revenues as soon as generic competition enters. Statin expenditure, for example, dropped from AUD 1.1 billion in 2011 to AUD 167.7 million in 2022 despite stable volumes. The one-time mark-up under the Medicines Supply Security Guarantee partly offsets thin margins but requires four-to-six-month stockholding that ties up working capital.
*Our forecasts treat driver/restraint impacts as directional, not additive. The impact forecasts reflect baseline growth, mix effects, and variable interactions.
Segment Analysis
By ATC/Therapeutic Class: Oncology Outpaces, Cardiovascular Anchors Volume
The cardiovascular system segment generated 14.10% of the Australia pharmaceutical market size in 2025, buoyed by 1.2 million diagnosed patients and the PBS launch of NEXLETOL, an oral LDL-lowering therapy secured under an exclusive CSL Seqirus licensing pact . Oncology revenues, meanwhile, are growing at 7.02% CAGR through 2031, propelled by PBS reimbursements for antibody–drug conjugates such as trastuzumab deruxtecan and checkpoint inhibitors like tislelizumab.
Competitive intensity is highest in oncology, where local clinical-trial density and expedited TGA pathways shorten the bench-to-bedside cycle. Cardiovascular therapies rely on incremental innovation and lifestyle-disease prevalence, offering steady cash flows but facing broader price-erosion risk. Both segments benefit from wholesale adoption of biologics, but oncology commands premium pricing that underpins overall Australia pharmaceutical market growth.



By Drug Type: Prescription Dominance, OTC Momentum
Prescription medicines captured 86.10% Australia pharmaceutical market share in 2025, reflecting the PBS subsidy model that channels demand through physician scripts. Over-the-counter (OTC) drugs are gaining traction at 6.62% CAGR as down-scheduling of migraine and allergy therapies and pharmacist prescribing pilots widen access.
The prescription segment grows in tandem with biosimilar rollouts—each new biosimilar reduces average PBS spend by roughly 25% in the affected class—while the OTC segment profits from self-care trends among digitally enabled consumers. Taken together, the dual channels diversify revenue and mitigate PBS pricing drag, strengthening the long-run resilience of the Australia pharmaceutical market.
By Distribution Channel: Hospitals Lead, Online Surges
Hospital pharmacies held 46.55% of the Australia pharmaceutical market size in 2025 on the back of complex cancer infusions, biologics and critical-care medicines. Online pharmacies post the fastest 6.92% CAGR, powered by e-prescription legislation that allows prescriptions to be emailed or texted to any licensed pharmacy nationwide.
While hospitals retain a stronghold in oncology and acute-care medicines, e-commerce players capture chronic-disease refills and wellness categories, reshaping last-mile logistics. Hybrid dispensing models that mesh hospital, retail and online channels will redefine supply-chain complexity and intensify competition for patient loyalty within the Australia pharmaceutical market.
By Formulation: Injectables Accelerate
Tablets remained the workhorse with 51.40% share in 2025, yet injectables are scaling at 6.74% CAGR as biologics and gene therapies proliferate. Pfizer’s USD 150 million Melbourne upgrade adds automated fill-finish lines for antimicrobials, while Baxter’s IV-fluid expansion lifts national output to 80 million units by 2027.
Injectable growth underscores the pivot toward precision medicine, with on-shore capacity mitigating cold-chain risk and import bottlenecks. Tablets will maintain volume leadership, but margin upside increasingly migrates to high-complexity injectables that raise therapeutic value per dose across the Australia pharmaceutical market.
Geography Analysis
Metropolitan hubs—Sydney, Melbourne and Brisbane—drive innovation adoption, account for most clinical-trial activity and host flagship manufacturing projects such as Moderna’s mRNA facility that can output 100 million doses annually. Regional diversification is taking shape as Noumed’s USD 100 million plant in South Australia and Baxter’s Western Sydney IV-fluid site de-risk single-state concentration.
Telehealth and e-prescriptions close rural-urban access gaps, but lingering deficits in specialist availability keep PBS uptake lower in remote areas. Federal supply-chain security programs mandate six-month stocks of critical PBS items, ensuring nationwide coverage during import shocks.
Looking ahead, state-led pharmacist-prescribing pilots in Queensland and Victoria will further decentralize primary care and tilt channel mix toward community pharmacies—particularly for chronic-disease maintenance drugs—supporting balanced geographic expansion across the Australia pharmaceutical market.
Regulatory Landscape
Australia regulates medicines primarily through the Therapeutic Goods Administration (TGA) under the Therapeutic Goods Act 1989. Market entry requires inclusion on the Australian Register of Therapeutic Goods (ARTG) and conformity to Australian Regulatory Guidelines for Prescription Medicines (ARGPM), including CTD-based dossiers and GMP expectations for licensed local sites or certified overseas manufacturers. Reimbursement and broad patient access are governed through the Pharmaceutical Benefits Scheme (PBS) and PBAC health technology assessment, which anchor commercial uptake for most prescription medicines under the subsidy model.
Recent policy updates tightened both affordability and listing mechanics. From January 2026, the maximum general PBS patient co-payment was reduced to AUD 25 (from AUD 31.60). In April 2026, the Department of Health and Aged Care issued an April Update instrument to amend PBS listings (including changes affecting products such as aflibercept), alongside a public consultation on the draft 2026-27 Cost Recovery Implementation Statement (CRIS) for PBS and National Immunisation Program listing cost recovery. These changes reinforce the dual-track requirement for sponsors to align TGA registration timelines with PBAC submission strategy and PBS listing administration, while accommodating evolving fee and listing-update processes.
Value Chain Analysis
Australia pharmaceuticals value creation typically runs from API and excipient sourcing (still heavily import-dependent) through formulation and fill-finish manufacturing. Quality release follows under TGA-regulated GMP, and distribution then moves through wholesalers and pharmacy channels. Downstream, the wholesaling and logistics layer is shaped by national access requirements, with temperature-controlled storage and cold-chain providers supporting high-complexity biologics and vaccines. Community and hospital pharmacies serve as the primary dispensing points, while online dispensing is gaining relevance as e-prescription adoption expands since 2020.
Supply resilience requirements are also increasingly shaping operating models. The PBS Medicines Supply Security Guarantee and associated minimum stockholding guidelines (effective 1 July 2023 for specified medicines) require Responsible Persons to maintain roughly 4 to 6 months of usual demand in Australia. That pushes manufacturers and sponsors to invest in local warehousing capacity, demand planning, and secondary sourcing. Recent signals include expanded local contract manufacturing and biomanufacturing capability, including IDT Australia contracts and development work, QIMR Berghofer/Q-Gen activity in cell and gene capabilities, and Sanofi being confirmed as the first tenant of the ENTRI biomanufacturing facility in Brisbane. Together, these developments strengthen the local link between clinical development, cGMP production, and commercial supply continuity.
Competitive Landscape
The market shows moderate concentration: multinationals such as Pfizer, Novartis and AstraZeneca dominate high-value segments, yet domestic champion CSL sustains leadership in plasma derivatives and influenza vaccines. CSL’s 2024 revenue rose 20% on immunoglobulin demand, though potential trade tariffs could compress R&D budgets.
Partnerships are multiplying: CSL Seqirus licensed NEXLETOL cholesterol therapies (target population 1.2 million) from Esperion, while Biocon and Sandoz joined forces on oncology biosimilars worth AUD 80 million. Manufacturing innovation is an emerging differentiator; Pfizer’s robotic lines and Ego Pharmaceutical’s AUD 156 million Zorzi Innovation Centre highlight the pivot toward advanced, cost-efficient production footprints.
Niche biotechs such as Telix Pharmaceuticals and Starpharma exploit regulatory fast tracks for radiotheranostics and dendrimer-based delivery platforms, respectively, creating acquisition targets for global majors keen on diversifying pipelines. Overall, competitive success hinges on PBS reimbursement expertise, pharmacoeconomic evidence generation and resilient supply-chain architecture that can meet stringent Medicines Supply Security Guarantee thresholds.
Australia Pharmaceuticals Industry Leaders
Abbvie Inc.
Amgen Inc.
AstraZeneca plc
Eli Lilly & Co.
Pfizer Inc.
- *Disclaimer: Major Players sorted in no particular order

Market Opportunities and Future Outlook
Opportunities concentrate in sovereign and advanced manufacturing, where recent government-backed capacity additions and named projects create room for contract development and manufacturing services (CDMO), sterile supply, and emerging modalities. In April 2026, New South Wales opened the AUD 96 million RNA Research and Manufacturing Facility at the Macquarie University Innovation Precinct operated by Aurora Biosynthetics, adding a dedicated platform for RNA-related development and production. In July 2026, the Queensland Government backed QIMR Berghofer via the Sovereign Industry Development Fund to establish a viral vector manufacturing suite and expand cell and gene therapy capacity at the Q-Gen facility, supporting local clinical translation and supply for advanced therapies.
Market access and affordability settings also create near-term commercial pathways for high-value therapies while tightening pricing discipline. The PBS general co-payment reduction to AUD 25 from January 2026 supports broader uptake across chronic and specialty categories. Ongoing strategic agreements between the Commonwealth, Medicines Australia, and GBMA (1 July 2022 to 30 June 2027) and the New Medicines Funding Guarantee framework reinforce the centrality of PBAC-recommended listings to volume conversion. Digitization adds an operational angle as sustained e-prescription volumes and tools such as Active Script List support more integrated dispensing workflows across retail and online channels, benefiting players that align packaging, adherence services, and distribution partnerships for omnichannel fulfillment.
Recent Industry Developments
- March 2026: Eli Lilly entered a licensing agreement with CSL for global rights to develop and commercialize the anti-IL-6 monoclonal antibody clazakizumab, including a USD 100 million upfront payment. The deal elevates an Australian-headquartered partner into a pivotal role in late-stage biologics development and can strengthen Australia’s profile in specialty biologics collaboration models.
- October 2025: Sandoz secured PBS listing for the etanercept biosimilar Erelzi. PBS reimbursement supports competitive switching dynamics in a mature TNF inhibitor class, increasing price pressure and expanding biosimilar penetration across hospital and community channels.
- September 2024: Pfizer’s adalimumab biosimilar Abrilada was listed on the PBS for multiple inflammatory indications. The listing broadened subsidized access in a high-volume immunology segment and reinforced PBS listing as the key lever for scale in biosimilar commercialization.


Research Methodology Framework and Report Scope
Market Definition and Coverage
For this study, the Australia pharmaceutical market is measured as the value of medicines sold and dispensed in Australia across prescription and over-the-counter products, counted across hospital, retail, and online pharmacy channels.
Scope exclusions: Medical devices, diagnostics, and dietary supplements (including most vitamins and nutraceuticals) are not counted as pharmaceuticals in this sizing.
Segmentation Overview
- By ATC / Therapeutic Class
- Alimentary Tract & Metabolism
- Blood & Blood Forming Organs
- Cardiovascular System
- Dermatologicals
- Genito-urinary & Sex Hormones
- Systemic Hormonal Preparations
- Anti-infectives for Systemic Use
- Antineoplastic & Immunomodulating Agents
- Other Therapeutic Classes
- By Drug Type
- Branded
- Generic
- By Formulation
- Tablets
- Capsules
- Injectables
- Others (Topicals, Patches, etc.)
- By Distribution Channel
- Hospital Pharmacies
- Retail Pharmacies
- Online Pharmacies
Data Sources, Market Sizing, and Validation
Desk Research
Desk research was used to set the base demand and policy context before any sizing was finalized. We relied on public sources such as Australia PBS expenditure and prescription statistics, Therapeutic Goods Administration (TGA) registers and approvals updates, Australian Institute of Health and Welfare (AIHW) health spending series, Australian Bureau of Statistics population and age profile tables, and OECD health data for cross-checks.
After that, we reviewed company annual reports, investor presentations, and pharmacy and wholesaler disclosures where available, to track product mix shifts, genericization cycles, and channel movement. In a few places, paid subscriptions for company financials, patent databases, and shipment-level import-export data were used to sanity check directional trends and fill gaps where public series were not granular enough. The sources listed here are illustrative, and many other public and paid references were also used for validation and clarification during the work.
Primary Interviews and Surveys
Primary work focused on validating what the secondary numbers could not explain cleanly, especially pricing pressure, tender behavior, and how quickly volume shifts between branded and generic products. We spoke with a mix of manufacturers, distributors, pharmacy channel participants, and healthcare stakeholders across Australia so assumptions on demand drivers and channel shares could be reconciled.
Responses were used to confirm therapy-level growth pockets, typical price erosion patterns after exclusivity loss, and the timing impact of reimbursement and formulary changes. We adjusted the model only when multiple interviews pointed to the same direction.
Distribution of primary research fieldwork respondents
| Company type | Respondent position |
|---|---|
| Top tier: 31% | CXOs: 15% |
| Mid tier: 47% | Functional/Unit leaders: 29% |
| Smaller Players: 22% | Managers: 56% |
Market-Sizing & Forecasting
Sizing started with a top-down build that reconstructs the addressable medicines pool using Australia-specific reimbursement and consumption signals, then aligns to category splits for Rx versus OTC and the main dispensing channels. To keep the totals realistic, selective bottom-up checks were used, such as sampled price per pack multiplied by estimated volumes for high-share therapy groups, and then compared against aggregated supplier and distributor revenue indicators.
Key inputs that shaped the model included PBS expenditure direction and prescription volumes, the pace of patent expiry and generic substitution, therapy class mix changes based on ATC patterns, channel shifts to online pharmacies, and population aging indicators that affect chronic disease medicine demand. Where direct volume or price points were missing, ranges were built from interview feedback and publicly observable price benchmarks, and then tightened through repeated cross-checks.
Forecasts were produced using scenario analysis supported by a simple multivariate regression layer for demand sensitivity, where variables like reimbursement tightening, generic penetration, and therapy mix were stress tested. The final outlook reflects the consensus range from primary discussions on price erosion and uptake speed, rather than a single aggressive or conservative path.
Data Validation & Update Cycle
Outputs were validated through triangulation across multiple independent signals, including policy-led spend series, channel-level indicators, and supplier commentary that could be tied back to real market events. When the model produced unexpected jumps, the inputs were rechecked for timing issues, currency conversions, and double counting across channels, and then follow-up calls were triggered to confirm the anomaly.
Before sign-off, the work goes through multi-step analyst review so assumptions, math logic, and scope alignment are consistent across the dataset and narrative. Reports are refreshed annually, and interim updates are added when material events occur, such as large reimbursement rule changes or major product launches that shift therapy demand. Right before delivery, a final pass is completed so clients receive the latest updated view.
Mordor Intelligence's Australia Pharmaceutical Market Size Compared Against Other Published Estimates
Published values for this market can vary by a wide margin, even when the same country is being discussed, because the counted medicine basket and pricing basis are not always consistent. Differences also show up when one estimate leans heavily on reimbursement spend, while another uses a wider sales view that includes non-subsidized purchases.
OTC medicines sit inside Mordor Intelligence's scope for Australia, while some published figures lean closer to prescription-only spending and can understate retail pharmacy demand where non-prescription categories are meaningful. Gaps can also come from how prices are treated over time, since some models apply flat average prices, but others build in post-patent price erosion and PBS-driven reductions with different timing assumptions, which then changes the headline value.
Benchmark comparison
| Source | Market Size | Gaps in Research Methodology |
|---|---|---|
| Mordor Intelligence | USD 14.04 B (2025) | |
| Trade Journal A | USD 15.90 B (2025) | Often aligned to prescription spend and policy-led reporting, which can miss parts of OTC demand and may apply a different AUD to USD conversion timing. |
| Industry Newsletter B | USD 24.50 B (2030) | Forward estimate uses a different horizon and can embed more optimistic growth and FX assumptions, with limited visibility on channel splits and price erosion handling. |
Taken together, the spread is explained mainly by what gets counted as pharmaceuticals, how prices are stepped down over time, and whether the estimate is anchored to reimbursement spend or broader sales. By keeping the variables tied to observable demand signals and then pressure-testing them with interview feedback, the final number stays traceable and repeatable for planning use.


Key Questions Answered in the Report
How big is the Australia Pharmaceuticals Market?
The Australia Pharmaceuticals Market size is expected to reach USD 14.86 billion in 2026 and grow at a CAGR of 5.88% to reach USD 19.78 billion by 2031.
Which therapeutic class is expanding fastest in Australia?
Oncology medicines are growing at a 7.02% CAGR through 2031, outpacing all other segments.
Who are the key players in Australia Pharmaceuticals Market?
Abbvie Inc., Amgen Inc., AstraZeneca plc, Eli Lilly & Co. and Pfizer Inc. are the major companies operating in the Australia Pharmaceuticals Market.
Why are injectables gaining share?
Surging biologic and gene-therapy approvals require injectable delivery, prompting domestic investments in fill-finish capacity.
Page last updated on:




