Cancer Stem Cells Market Size and Share
Market Overview
| Study Period | 2025 - 2031 |
|---|---|
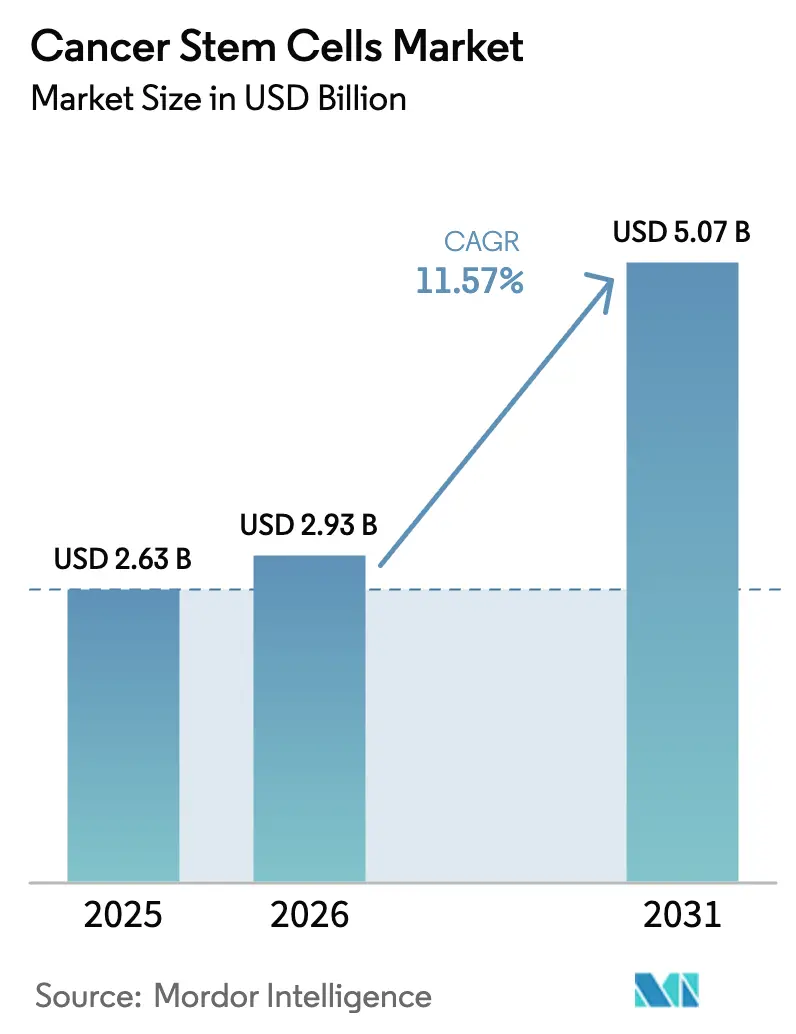
| Market Size (2026) | USD 2.93 Billion |
| Market Size (2031) | USD 5.07 Billion |
| Growth Rate (2026 - 2031) | 11.57% CAGR |
| Fastest Growing Market | Asia Pacific |
| Largest Market | North America |
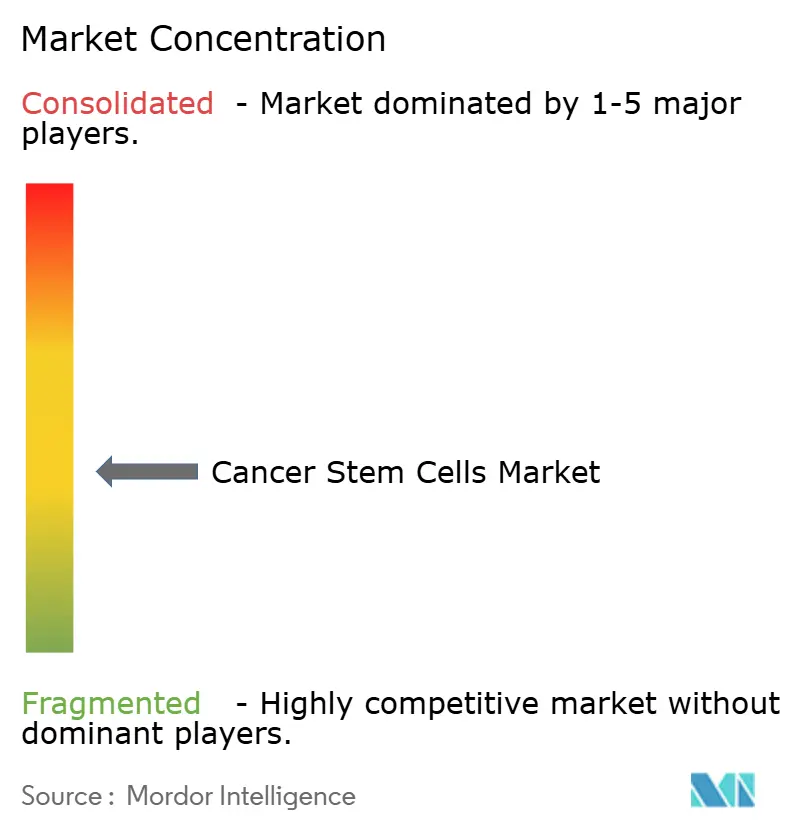
| Market Concentration | Medium |
Major Players*Disclaimer: Major Players sorted in no particular order Image © Mordor Intelligence. Reuse requires attribution under CC BY 4.0. | |
Cancer Stem Cells Market Analysis by Mordor Intelligence
The Cancer Stem Cells Market size was valued at USD 2.63 billion in 2025 and estimated to grow from USD 2.93 billion in 2026 to reach USD 5.07 billion by 2031, at a CAGR of 11.57% during the forecast period (2026-2031). Momentum stems from the first wave of regulatory approvals, and from rapid convergence between AI-enabled single-cell multi-omics, advanced 3-D culture systems, and decentralised manufacturing. Autologous transplants dominate applications today, yet allogeneic, off-the-shelf approaches are scaling faster and reshaping competitive priorities. Intensifying patent activity around niche markers, coupled with reimbursement uncertainty, preserves a fragmented yet increasingly technology-centric landscape.
Key Report Takeaways
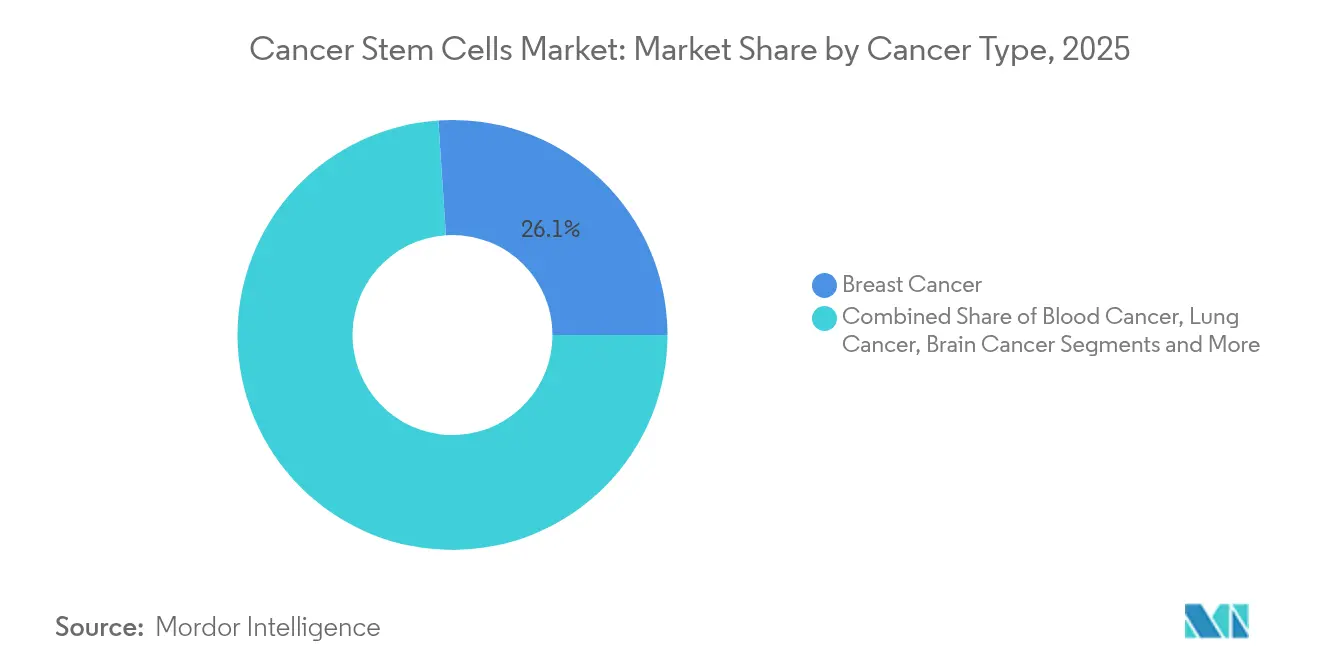
- By cancer type, breast cancer led with 26.05% revenue share in 2025; lung cancer is projected to expand at a 12.41% CAGR to 2031.
- By application, autologous transplants held 52.42% of the cancer stem cells market share in 2025; allogeneic approaches are forecast to grow at 12.18% through 2031.
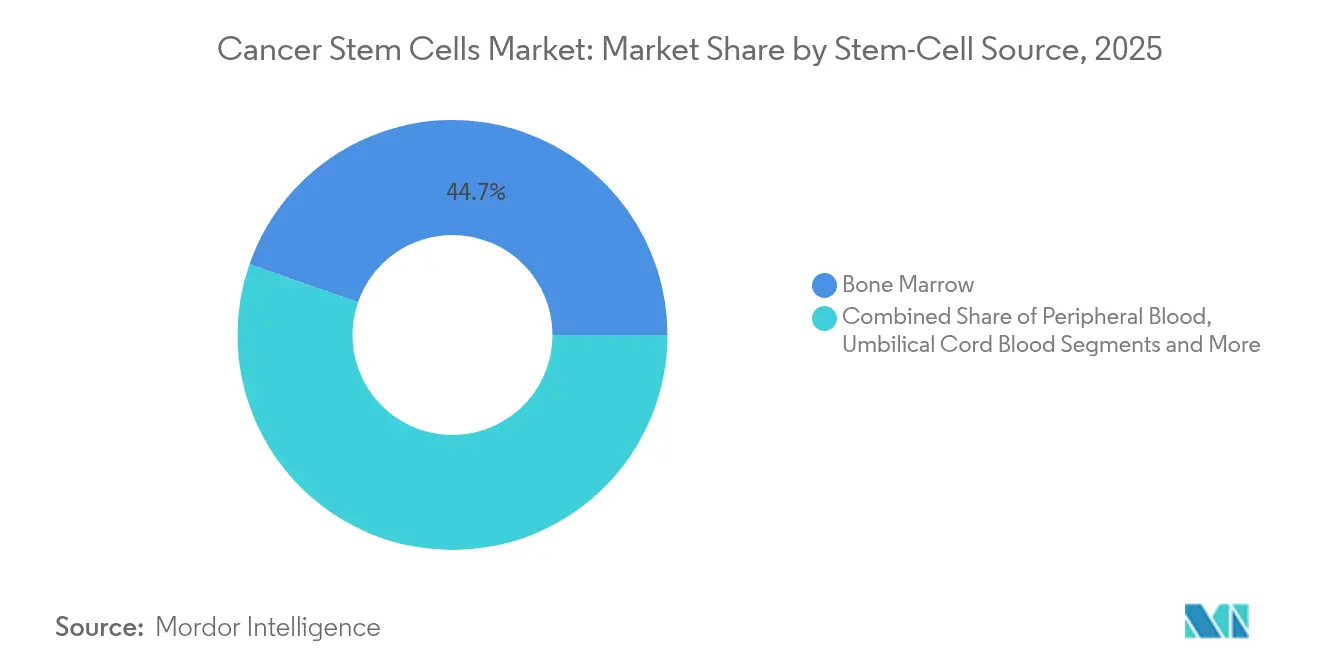
- By stem-cell source, bone marrow accounted for 44.67% share of the cancer stem cells market size in 2025; induced pluripotent stem cells (iPSCs) are advancing at a 12.79% CAGR to 2031.
- By geography, North America commanded 37.12% of revenue in 2025, whereas Asia Pacific is set to post a 13.05% CAGR to 2031.
Note: Market size and forecast figures in this report are generated using Mordor Intelligence’s proprietary estimation framework, updated with the latest available data and insights as of 2026.
Global Cancer Stem Cells Market Trends and Insights
Drivers Impact Analysis*
| Driver | (~) % Impact on CAGR Forecast | Geographic Relevance | Impact Timeline |
|---|---|---|---|
| Rising cancer incidence and supportive legislation | +2.8% | Global | Medium term (2-4 years) |
| Escalating R&D spending & public-private funding | +2.1% | North America & EU, APAC core | Long term (≥ 4 years) |
| Rapid adoption of advanced cell-isolation/3-D culture platforms | +1.9% | Global, with early gains in North America, Japan | Short term (≤ 2 years) |
| AI-driven single-cell multi-omics accelerating CSC target discovery | +1.7% | North America & EU, spill-over to APAC | Medium term (2-4 years) |
| Magnetogenetics enabling non-invasive CSC modulation | +1.4% | North America & EU, Japan | Long term (≥ 4 years) |
| Emergence of decentralised, hospital-based autologous manufacture labs | +1.3% | Global, with early gains in North America, Europe | Short term (≤ 2 years) |
| Source: Mordor Intelligence | |||
Rising Cancer Incidence and Supportive Legislation
Global oncology caseloads are climbing, intensifying demand for therapies that eradicate the small, relapse-driving cancer stem-cell pool. Policymakers now streamline regulatory pathways: the FDA Modernization Act has removed certain animal-testing requirements, accelerating iPSC adoption in oncology. In Europe, the EMA’s advanced-therapy pilot cuts review fees for academic developers and provides continuous scientific guidance.[1]Source: European Medicines Agency, “Progress Update on Pilot for Academic and Non-profit Developers of Advanced Therapy Medicines,” ema.europa.eu Japan’s fast-track scheme for regenerative medicine is expected to green-light the first iPSC-based cancer therapy within the next year, underscoring global regulatory convergence. These shifts collectively boost adoption prospects and elevate the cancer stem cells market trajectory.
Escalating R&D Spending & Public-Private Funding
Governments and investors increasingly funnel capital into translational programmes. Japan’s ¥110 billion allocation to regenerative medicine finances more than 60 iPSC oncology trials worldwide. In the United States, the Reagan-Udall Foundation highlights gene-therapy overlaps with stem-cell biology, galvanising funding for multimodal regimens. Venture capital now targets AI-enhanced discovery engines that profile cancer stem-cell heterogeneity at single-cell depth, signalling strong confidence in technology-enabled platforms.
Rapid Adoption of Advanced Cell-Isolation/3-D Culture Platforms
Next-generation isolation tools and 3-D culture systems recapitulate tumour microenvironments more faithfully than 2-D monolayers. The STEMdiff kit enables reproducible differentiation of hematopoietic progenitors from pluripotent sources, mitigating historic supply constraints. Machine-learning algorithms now identify cancer stem-cell sub-populations with unique vulnerabilities, as shown in bladder cancer studies. Integrated bioreactors equipped with automated sensors drive manufacturing consistency, an essential prerequisite for clinical-grade output.
AI-Driven Single-Cell Multi-Omics Accelerating CSC Target Discovery
Combining AI with single-cell sequencing unveils previously hidden cellular states that guide drug design. Anet dissects tumour ecosystems, pinpointing discrete stem-like clusters amenable to targeted therapy. Complementary pipelines such as PERception predict individual drug responses by mapping clonal trajectories. This data-rich workflow trims discovery timelines and heightens clinical-trial precision.
Restraints Impact Analysis*
| Restraint | (~) % Impact on CAGR Forecast | Geographic Relevance | Impact Timeline |
|---|---|---|---|
| High therapy cost and reimbursement uncertainty | -2.4% | Global, particularly acute in emerging markets | Short term (≤ 2 years) |
| Ethical / regulatory complexity around manipulating human stem cells | -1.8% | Global, with regional variations in stringency | Medium term (2-4 years) |
| In-vitro expansion challenges owing to CSC micro-environment mimicry | -1.2% | Global, with higher impact in North America & EU | Medium term (2-4 years) |
| Patent clustering around niche CSC markers limiting new entrants | -0.9% | North America & EU primarily, spill-over to APAC | Long term (≥ 4 years) |
| Source: Mordor Intelligence | |||
High Therapy Cost and Reimbursement Uncertainty
CAR-T procedures can top USD 1 million per patient, a benchmark that frames payer hesitancy for emerging cancer stem-cell interventions.[2]Source: Shelby Holland et al., “Quest for Stakeholder Synchronisation in CAR-T Supply Chain,” Frontiers in Bioengineering and Biotechnology, frontiersin.org Access remains limited: fewer than 20% of eligible U.S. patients receive approved cell and gene therapies, often due to reimbursement delays. Medicare’s national coverage determination for stem-cell transplantation clarifies criteria but remains disease-specific, leaving newer indications unfunded.[3]Source: Centers for Medicare & Medicaid Services, “Stem Cell Transplantation (110.23),” cms.gov Emerging markets confront even sharper affordability gaps, stalling broad uptake across the cancer stem cells market.
Ethical / Regulatory Complexity Around Manipulating Human Stem Cells
Jurisdictions diverge on genome editing and embryonic-stem-cell oversight, adding layers of compliance risk. The EU’s multi-country approval sequence slows CAR-T market entry; the T2EVOLVE consortium has petitioned for unified dossier templates to cut delays. Gene-editing therapies must also monitor off-target effects for years, extending trial durations and budget cycles. Smaller developers face disproportionate burdens, reinforcing consolidation trends within the cancer stem cells market.
*Our forecasts treat driver/restraint impacts as directional, not additive. The impact forecasts reflect baseline growth, mix effects, and variable interactions.
Segment Analysis
By Cancer Type: Breast Cancer Dominance Drives Innovation
Breast cancer contributed 26.05% of revenue in 2025, the single-largest slice of the cancer stem cells market share. The segment benefits from high global prevalence and robust biomarker pipelines. AI-guided redox-signature assays now stratify patients by likely immunotherapy or chemotherapy benefit, tightening the fit between treatment and tumour biology. Triple-negative breast cancer trials evaluating CAR-modified cells and checkpoint inhibitors seek to curb aggressive, stem-cell-driven relapse.
Lung cancer represents the fastest-growing slice with a 12.41% CAGR, propelled by advances in micro-environment targeting that improve stem-cell homing and persistence. Blood cancers sustain material volumes thanks to entrenched transplantation protocols, while glioblastoma programmes test magnetic hyperthermia to eradicate resistant stem-cell niches. Pancreatic investigations, including claudin18.2-CAR-T case reports showing complete remission, highlight the breadth of innovation. Together, these trends reinforce diversified demand across the cancer stem cells market.


By Application: Autologous Transplants Lead Market Share
Autologous transplants captured 52.42% of the cancer stem cells market size in 2025, supported by lower graft-versus-host risk and well-established conditioning regimens. Uptake remains highest in hematologic malignancies where decades of data underpin payer confidence. Hyperbaric oxygen paired with allogeneic peripheral-blood transplants is under investigation to enhance engraftment kinetics, potentially narrowing the performance gap between approaches.
Allogeneic therapies, however, are projected to outpace with a 12.18% CAGR, buoyed by scalable manufacturing and off-the-shelf inventory. Sequential CD7 CAR-T followed by haploidentical transplants has achieved 68% overall survival without routine GVHD prophylaxis, illustrating clinical momentum. Umbilical-cord-blood protocols are closing historical survival gaps across racial groups, expanding donor pools and broadening market reach. Collectively, these performance gains challenge autologous primacy and reshape strategic positioning within the cancer stem cells market.
By Stem-Cell Source: Bone Marrow Maintains Leadership Position
Bone marrow supplied 44.67% of total revenue in 2025, reflecting decades of procedural familiarity and robust outcome data. Innovations now target harvesting-site optimisation to boost mesenchymal-stem-cell yields while minimising morbidity. High-multiplex imaging platforms such as Phenocycler 2.0 profile marrow architecture with 25 markers, informing fine-tuned protocols that preserve stemness.
Induced pluripotent stem cells stand out as the fastest-growing source, expanding at a 12.79% CAGR to 2031, thanks to limitless expansion and modular genome engineering. Japan’s national programme underwrites large-scale iPSC manufacturing, signalling industrial-scale adoption ahead of clinical inflection points. Ex-vivo expansion breakthroughs also widen the utility of peripheral-blood and cord-blood sources, particularly in paediatrics and relapse-resistant adults. These developments collectively diversify sourcing strategies across the cancer stem cells market.
Geography Analysis
North America retained 37.12% share in 2025, anchored by the FDA’s increasingly supportive stance exemplified by Ryoncil’s approval and by Medicare reimbursement frameworks that codify coverage for several transplant modalities. Academic-industry ecosystems leverage AI for single-cell analytics, enhancing trial design and accelerating bench-to-bedside translation. Decentralised manufacturing partnerships, such as the Galapagos–Blood Centers of America network, shrink delivery timelines, reinforcing regional dominance.
Asia Pacific is on track for a 13.05% CAGR, catalysed by Japan’s regulatory fast-track and capital spending exceeding ¥110 billion, which underpin more than 60 iPSC-based oncology trials. Local giants are erecting dedicated cGMP sites to meet future demand, while China’s regulatory reforms widen trial pipelines despite ongoing IP-protection challenges. Regional collaborations between academic centres and biotechs align well with the precision-oncology paradigm dominating the cancer stem cells market.
Europe benefits from the EMA’s advanced-therapy framework, though multi-country compliance still lengthens time to market. The approval of Casgevy, a CRISPR-edited stem-cell therapy, validates complex gene-editing modalities and sets safety benchmarks. The T2EVOLVE consortium pushes for streamlined CAR-T regulation to sustain competitiveness. Emerging Middle-East programmes, such as Saudi Arabia’s Cancer BioShield, and Mexico’s evolving cell-therapy rules, signal a widening global footprint.


Competitive Landscape
The cancer stem cells market is moderately fragmented, yet consolidation is gathering pace as capital requirements rise. Established suppliers like Thermo Fisher Scientific and Merck KGaA leverage global logistics and broad reagent portfolios to maintain pricing power. Meanwhile, platform-focused innovators such as Century Therapeutics employ iPSC-derived Allo-Evasion technology to generate multiplex pipelines that can be rapidly retargeted to new tumour antigens.
Technology differentiation is sharpening. AI-driven discovery suites, magnetogenetics toolkits, and integrated bioreactors form core competitive levers. Patent analytics show a 70% surge in oncology filings, with public-sector laboratories contributing one-third of families, underscoring a richly collaborative innovation scene. Entry barriers consequently rise for start-ups unable to navigate dense IP thickets around niche surface markers.
Strategic plays increasingly feature combination approaches. Recent licensing deals—such as those pursued by Mosaic Therapeutics to build proprietary drug-cell-therapy cocktails—highlight a shift away from single-asset bets toward modular portfolios. Investment is equally flowing into decentralised production footprints, which promise cost efficiencies and expanded patient reach. Collectively, these manoeuvres signal an evolving battlefield where scale, IP density, and technological breadth will dictate positioning within the cancer stem cells market.
Cancer Stem Cells Industry Leaders
Thermo Fisher Scientific Inc.
Merck KGaA
Lonza
PromoCell GmbH
Bio-Techne (R&D Systems, Inc.)
- *Disclaimer: Major Players sorted in no particular order

Recent Industry Developments
- June 2025: ExCellThera secured EMA accelerated assessment for its UM171 cell therapy targeting haematological malignancies lacking matched donors.
- January 2025: Baptist Health plans to launch a Stem Cell Transplantation and Cellular Therapy Program at Baptist MD Anderson Cancer Center to expand access across Florida and Georgia.
- May 2024: Stanford Medicine treated a patient with the US FDA-approved cell-based stem cell therapy for the management of blood cancer and melanoma.
- April 2023: Gamida Cell Ltd, a cell therapy leader, announced the US FDA approval of Omisirge, an allogeneic cell therapy for treating pediatric patients and adults with hematologic malignancies. This approval is expected to increase stem cell transplant access and improve patient outcomes.


Research Methodology Framework and Report Scope
Market Definitions and Key Coverage
According to Mordor Intelligence, the cancer stem cells market includes every clinically oriented product, service, or technology that isolates, characterizes, or eliminates tumor-initiating stem cells for autologous or allogeneic transplantation and for targeted pathway inhibition, with revenues captured at the manufacturer level. The study spans therapeutic consumables such as culture, separation, and analysis kits, CSC-specific biologics and small molecules, and dedicated processing devices that reach oncology care providers worldwide.
Scope exclusions include research-only cell lines, generic stem-cell reagents not validated for oncology, and stand-alone logistics services that lie outside this market boundary.
Segmentation Overview
- By Cancer Type
- Breast Cancer
- Blood Cancer
- Lung Cancer
- Brain Cancer
- Colorectal Cancer
- Pancreatic Cancer
- Bladder Cancer
- Liver Cancer
- Other Cancer Types
- By Application
- Autologous Stem-Cell Transplant
- Allogeneic Stem-Cell Transplant
- By Stem-Cell Source
- Bone Marrow
- Peripheral Blood
- Umbilical Cord Blood
- Induced Pluripotent Stem Cells (iPSCs)
- Others
- By Geography
- North America
- United States
- Canada
- Mexico
- Europe
- Germany
- United Kingdom
- France
- Italy
- Spain
- Rest of Europe
- Asia Pacific
- China
- Japan
- India
- Australia
- South Korea
- Rest of Asia Pacific
- Middle East and Africa
- GCC
- South Africa
- Rest of Middle East and Africa
- South America
- Brazil
- Argentina
- Rest of South America
- North America
Detailed Research Methodology and Data Validation
Primary Research
Mordor analysts interviewed oncology clinicians, transplant coordinators, cell-therapy CDMOs, and regulatory specialists across North America, Europe, and Asia-Pacific. These discussions clarified real-world utilization rates, emerging price points, and the lead indicators that desk research alone cannot surface, allowing us to triangulate assumptions and refine regional splits.
Desk Research
We build the baseline with globally trusted statistics; incidence and prevalence series from WHO GLOBOCAN, the American Cancer Society, and Eurostat anchor demand, while ClinicalTrials.gov and regional trial registers trace therapy pipeline velocity and attrition. Regulatory portals (US FDA, EMA, PMDA) reveal approval cadence, and industry bodies such as the International Society for Stem Cell Research or the Alliance for Regenerative Medicine release granular adoption metrics. Company 10-Ks, investor decks, and news retrieved through Dow Jones Factiva, supported by D&B Hoovers financials, inform supplier share estimates and average selling prices. This listing is illustrative; numerous additional public and subscription sources were reviewed to complete and validate the dataset.
Market-Sizing & Forecasting
Our model starts with a top-down reconstruction of the treatable patient pool (new cancer cases × CSC prevalence × transplantation or targeted-therapy eligibility), which is then cross-checked against bottom-up approximations from sampled ASP-by-volume supplier roll-ups. Key variables include annual solid and hematologic cancer incidence, transplant penetration, clinical-trial success ratios, regulatory approval rate, and therapy ASP progression. A multivariate regression with lagged oncology funding and approval variables drives the 2025-2030 forecast, while scenario analysis adjusts for breakthrough approvals or major safety setbacks.
Data Validation & Update Cycle
Outputs pass a three-stage analyst review in which anomalies are flagged against external market signals and patent publication surges. The model refreshes each year, and interim updates are triggered when major approvals, reimbursement shifts, or safety alerts materially affect assumptions.
Why Mordor's Cancer Stem Cells Baseline commands reliability
Published estimates often diverge because firms pick different scopes, price ladders, and refresh cadences before rolling numbers forward.
Key gap drivers include whether research-only reagents are counted, how aggressively future approvals are baked in, and the rigor of clinician validation interviews that temper early-stage optimism.
Benchmark comparison
| Market Size | Anonymized source | Primary gap driver |
|---|---|---|
| USD 2.63 B (2025) | Mordor Intelligence | - |
| USD 2.89 B (2023) | Global Consultancy A | Counts research reagents and relies on historical CAGR rollover without live clinician checks |
| USD 3.20 B (2024) | Industry Association B | Bundles broader stem-cell categories and assumes flat therapy pricing across regions |
| USD 4.30 B (2024) | Regional Consultancy C | Purely top-down from funding announcements, lacking supplier-level cross-verification |
The comparison shows that figures inflate when research kits or wider regenerative segments creep in, or when pricing and uptake are left unchallenged. Mordor's disciplined scope, dual-track modelling, and annually refreshed primary research give decision-makers a balanced, transparent baseline they can replicate and trust.


Key Questions Answered in the Report
What is the projected size of the cancer stem cells market by 2031?
The cancer stem cells market is forecast to reach USD 5.07 billion by 2031 at an 11.57% CAGR.
Which cancer indication currently contributes the highest revenue?
Breast cancer leads the market with a 26.05% share in 2025.
Why are allogeneic stem-cell therapies growing faster than autologous ones?
Allogeneic products offer off-the-shelf scalability and have shown encouraging survival rates, supporting a 12.18% CAGR through 2031.
Which region is expanding most rapidly?
Asia Pacific is advancing at a 13.05% CAGR, propelled by Japan’s large-scale investment and fast-track regulatory pathways.
How does AI benefit cancer stem-cell drug discovery?
AI-enabled single-cell multi-omics accelerates target identification by mapping tumour heterogeneity at unprecedented resolution, cutting discovery time and cost.
What is the main barrier to widespread patient access?
High therapy costs and uncertain reimbursement frameworks limit uptake, especially in emerging markets.
Page last updated on:


