Stem Cell Market Size and Share
Market Overview
| Study Period | 2019 - 2030 |
|---|---|
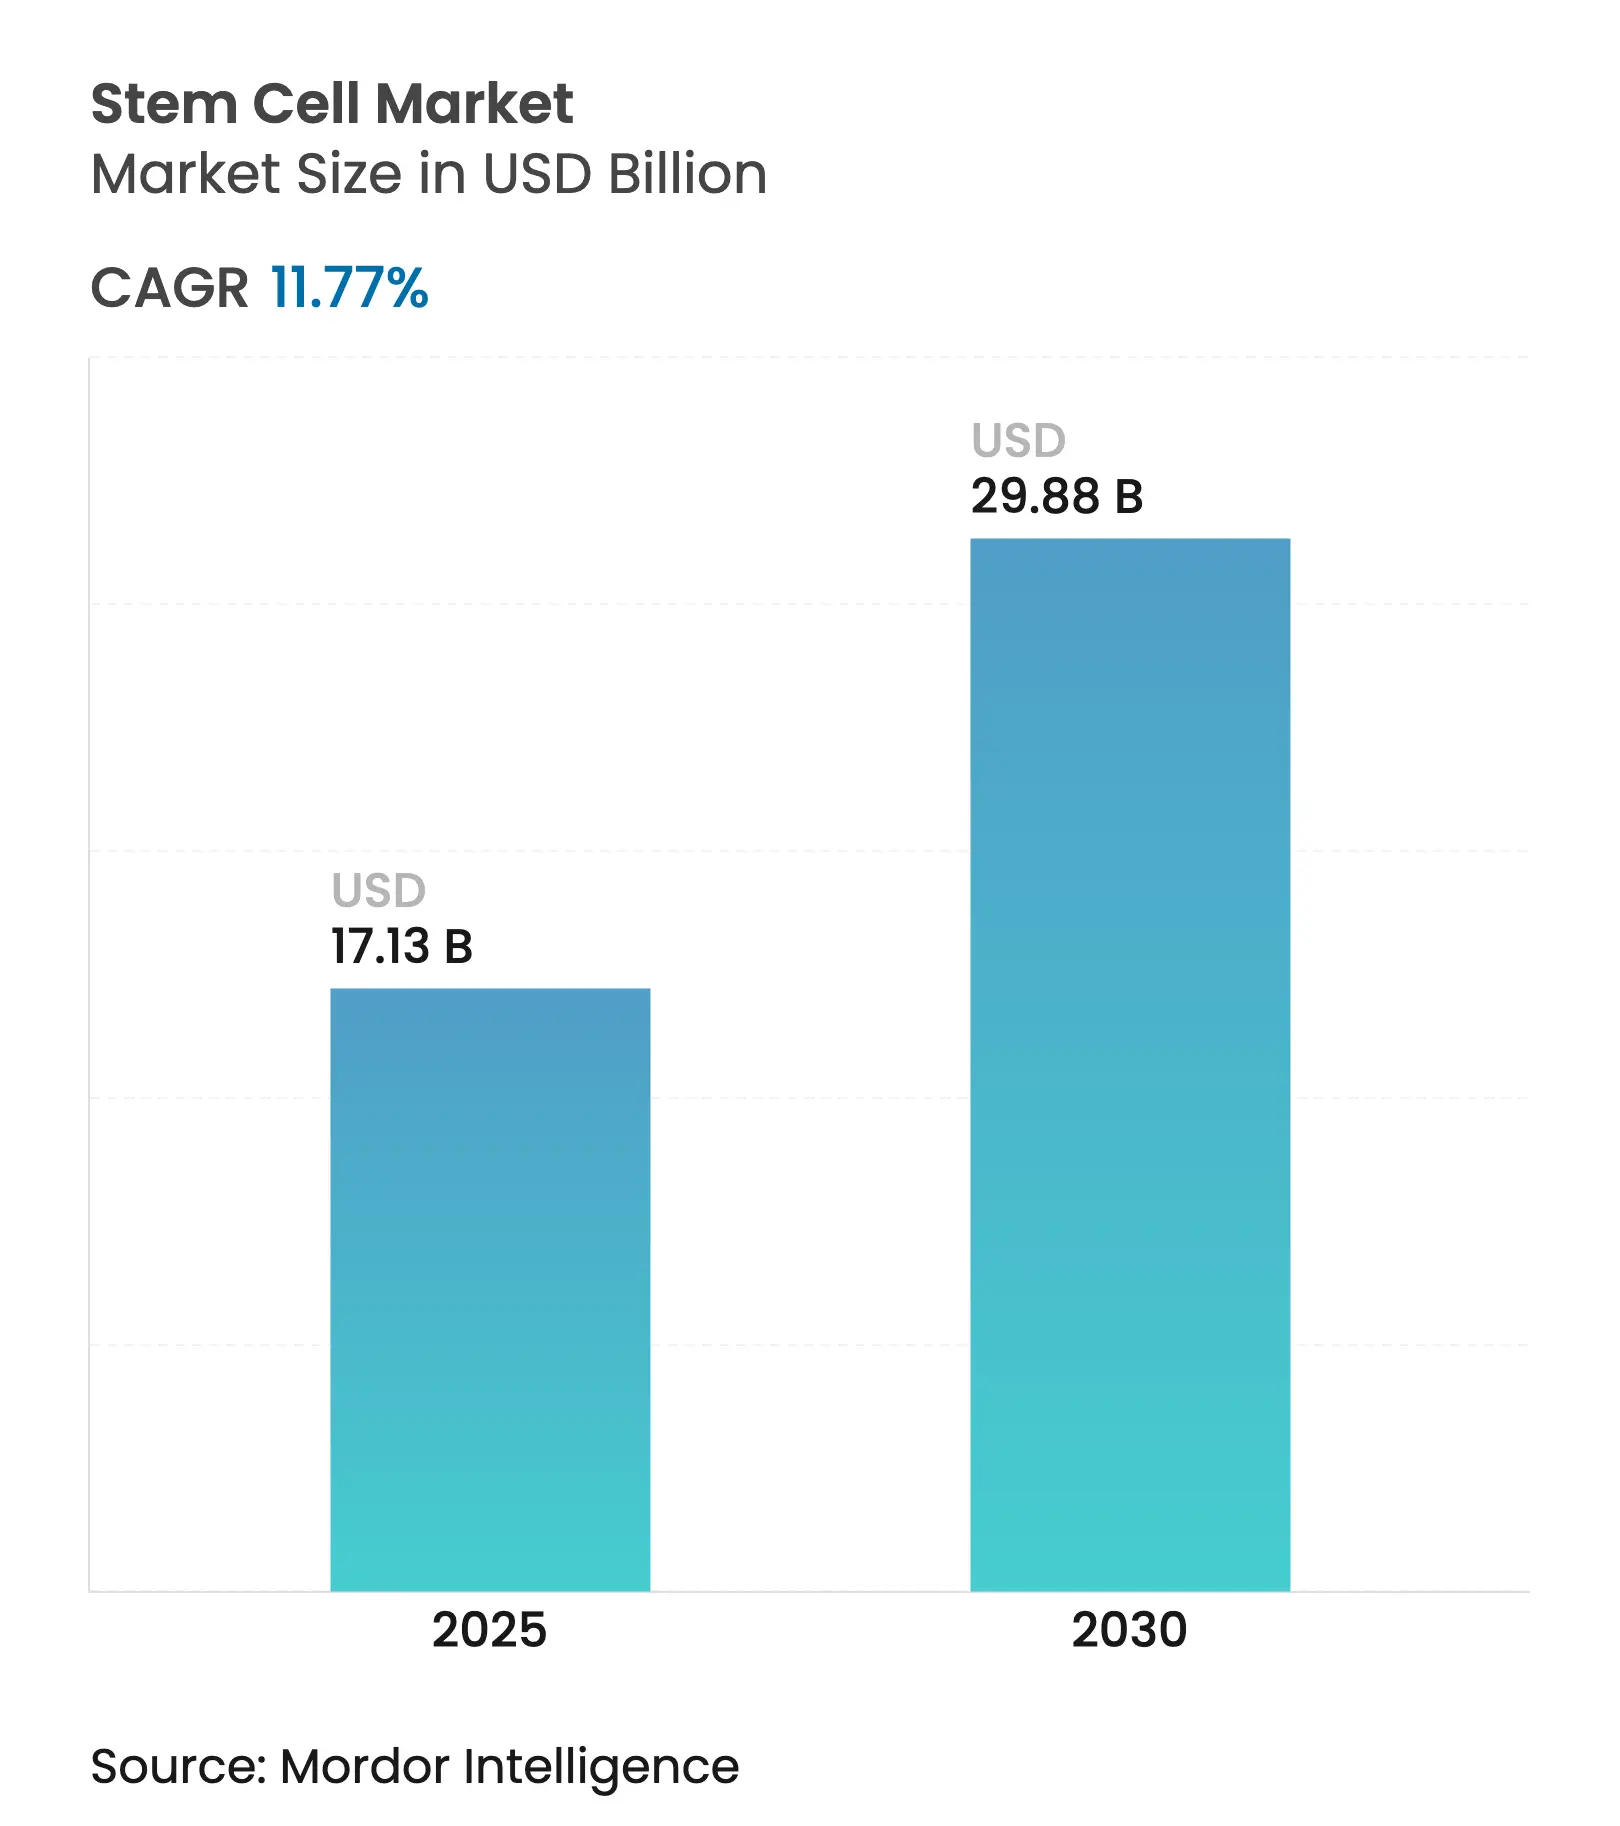
| Market Size (2025) | USD 17.13 Billion |
| Market Size (2030) | USD 29.88 Billion |
| Growth Rate (2025 - 2030) | 11.77 % CAGR |
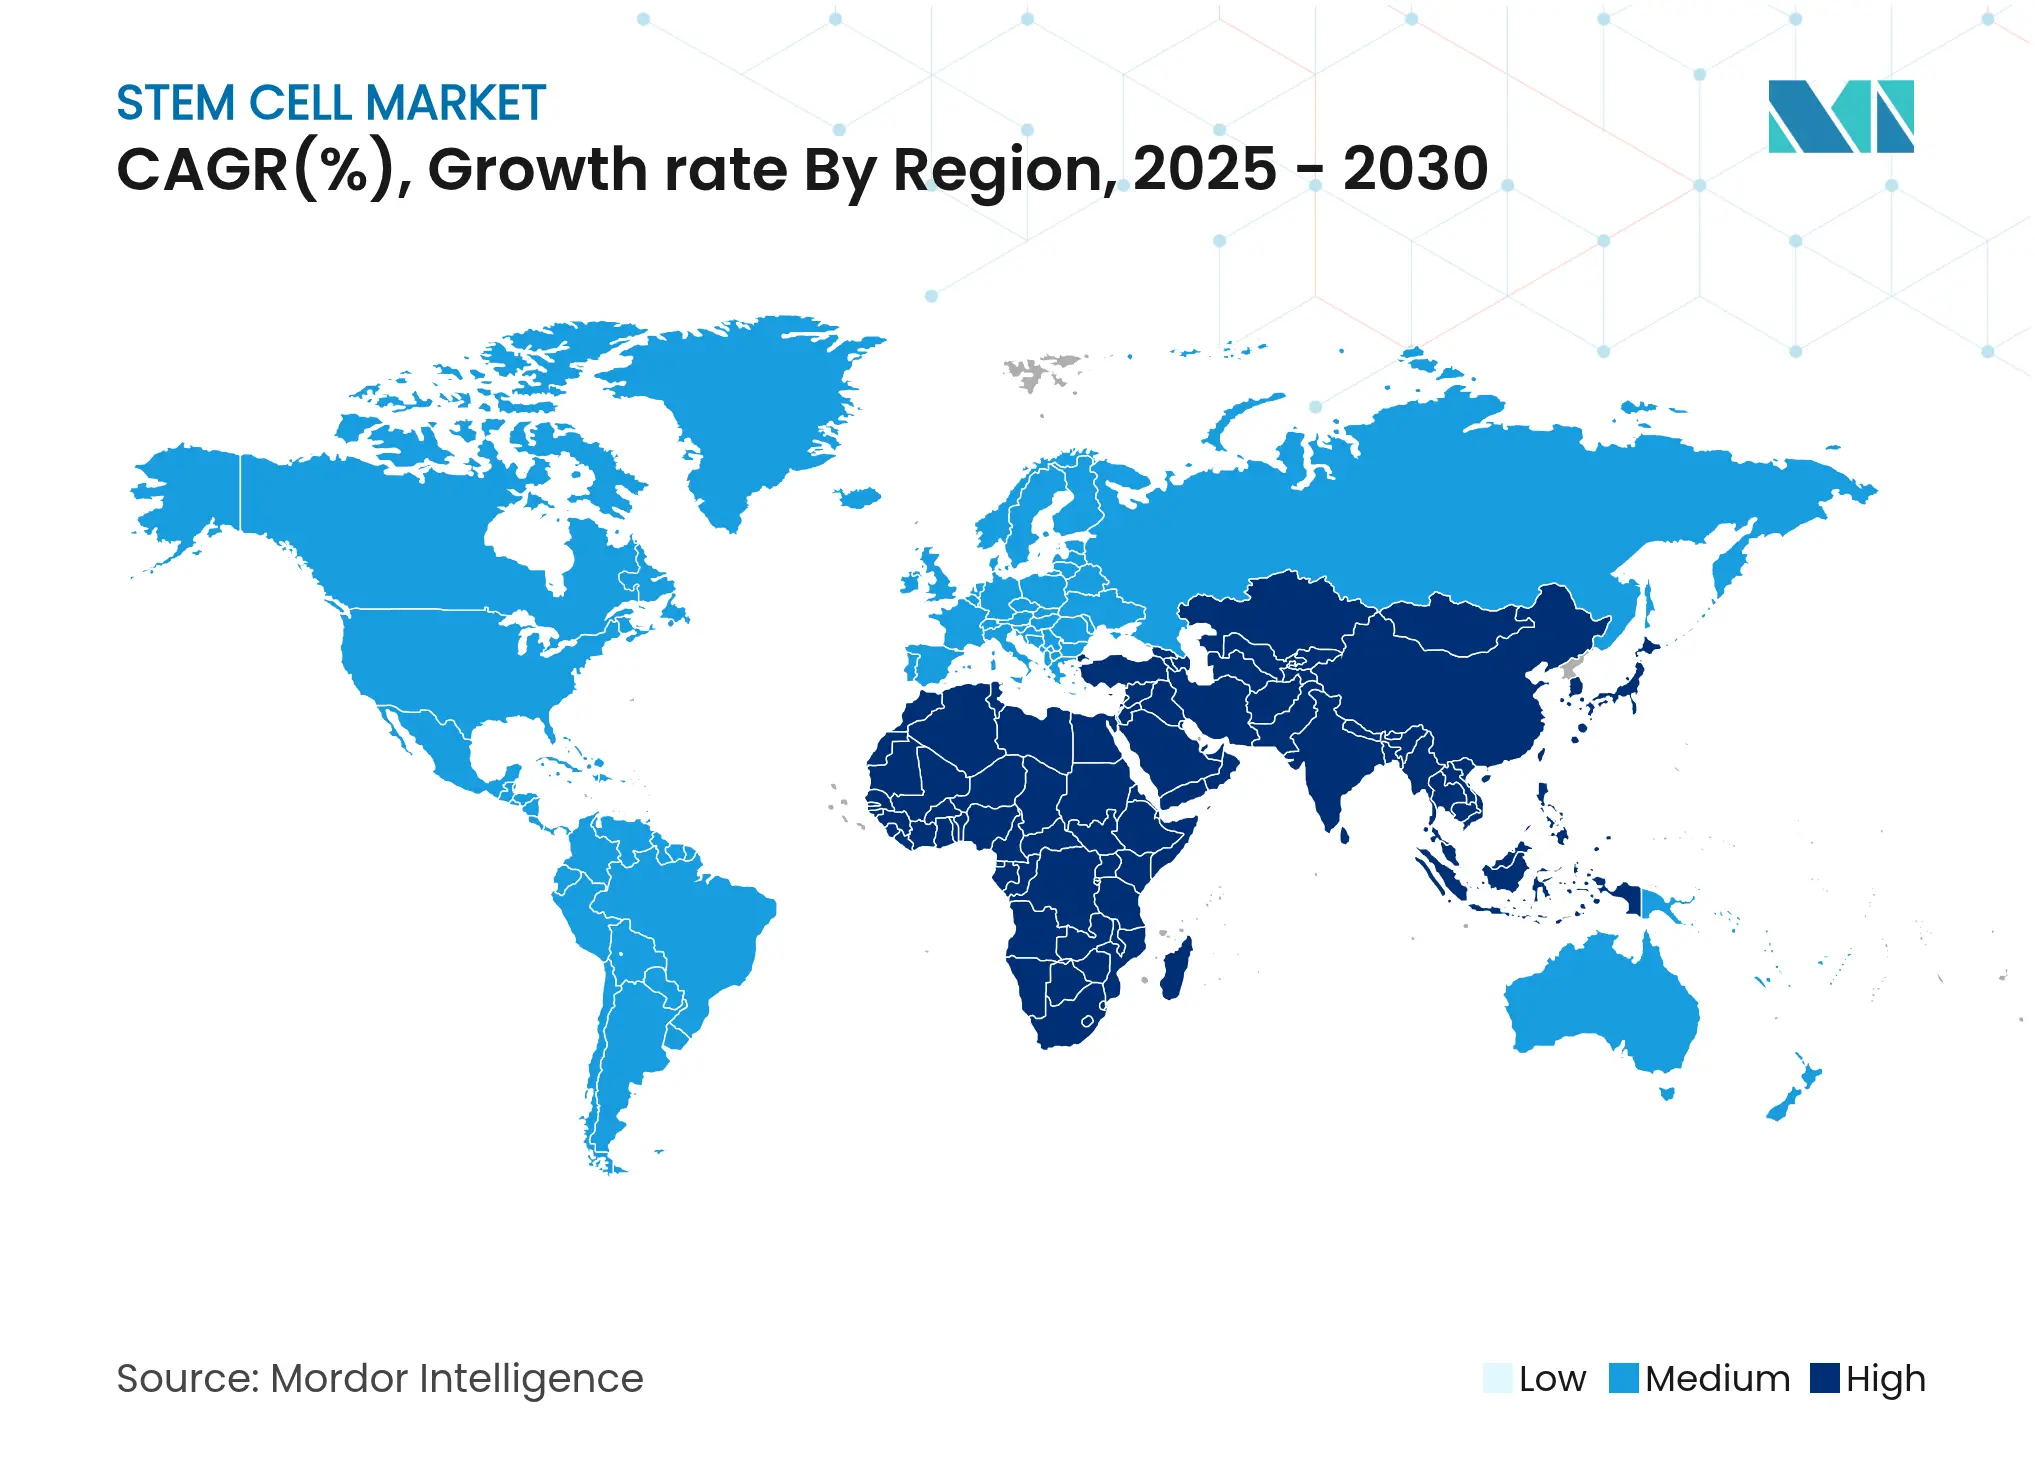
| Fastest Growing Market | Asia Pacific |
| Largest Market | North America |
| Market Concentration | Low |
Major Players *Disclaimer: Major Players sorted in no particular order. Image © Mordor Intelligence. Reuse requires attribution under CC BY 4.0. |
Stem Cell Market Analysis by Mordor Intelligence
The stem cell market stands at USD 17.13 billion in 2025 and is projected to reach USD 29.88 billion by 2030, advancing at an 11.77% CAGR. Growth is unfolding on several fronts: newly approved mesenchymal stromal cell therapies have shortened commercial lead times, investment is pouring into induced pluripotent stem cell (iPSC) platforms, and specialized CDMOs are scaling manufacturing capacity. Accelerated regulatory pathways, especially in the United States and Japan, are bringing therapies to patients sooner, while CRISPR-enabled editing and AI-guided production workflows are lifting product quality and broadening therapeutic scope. Regional momentum is shifting toward Asia-Pacific, where national policies are positioning stem cells as strategic technologies. Competitive intensity is increasing as large biopharma acquires innovators to secure delivery tools that ease in-vivo administration.
Key Take Aways
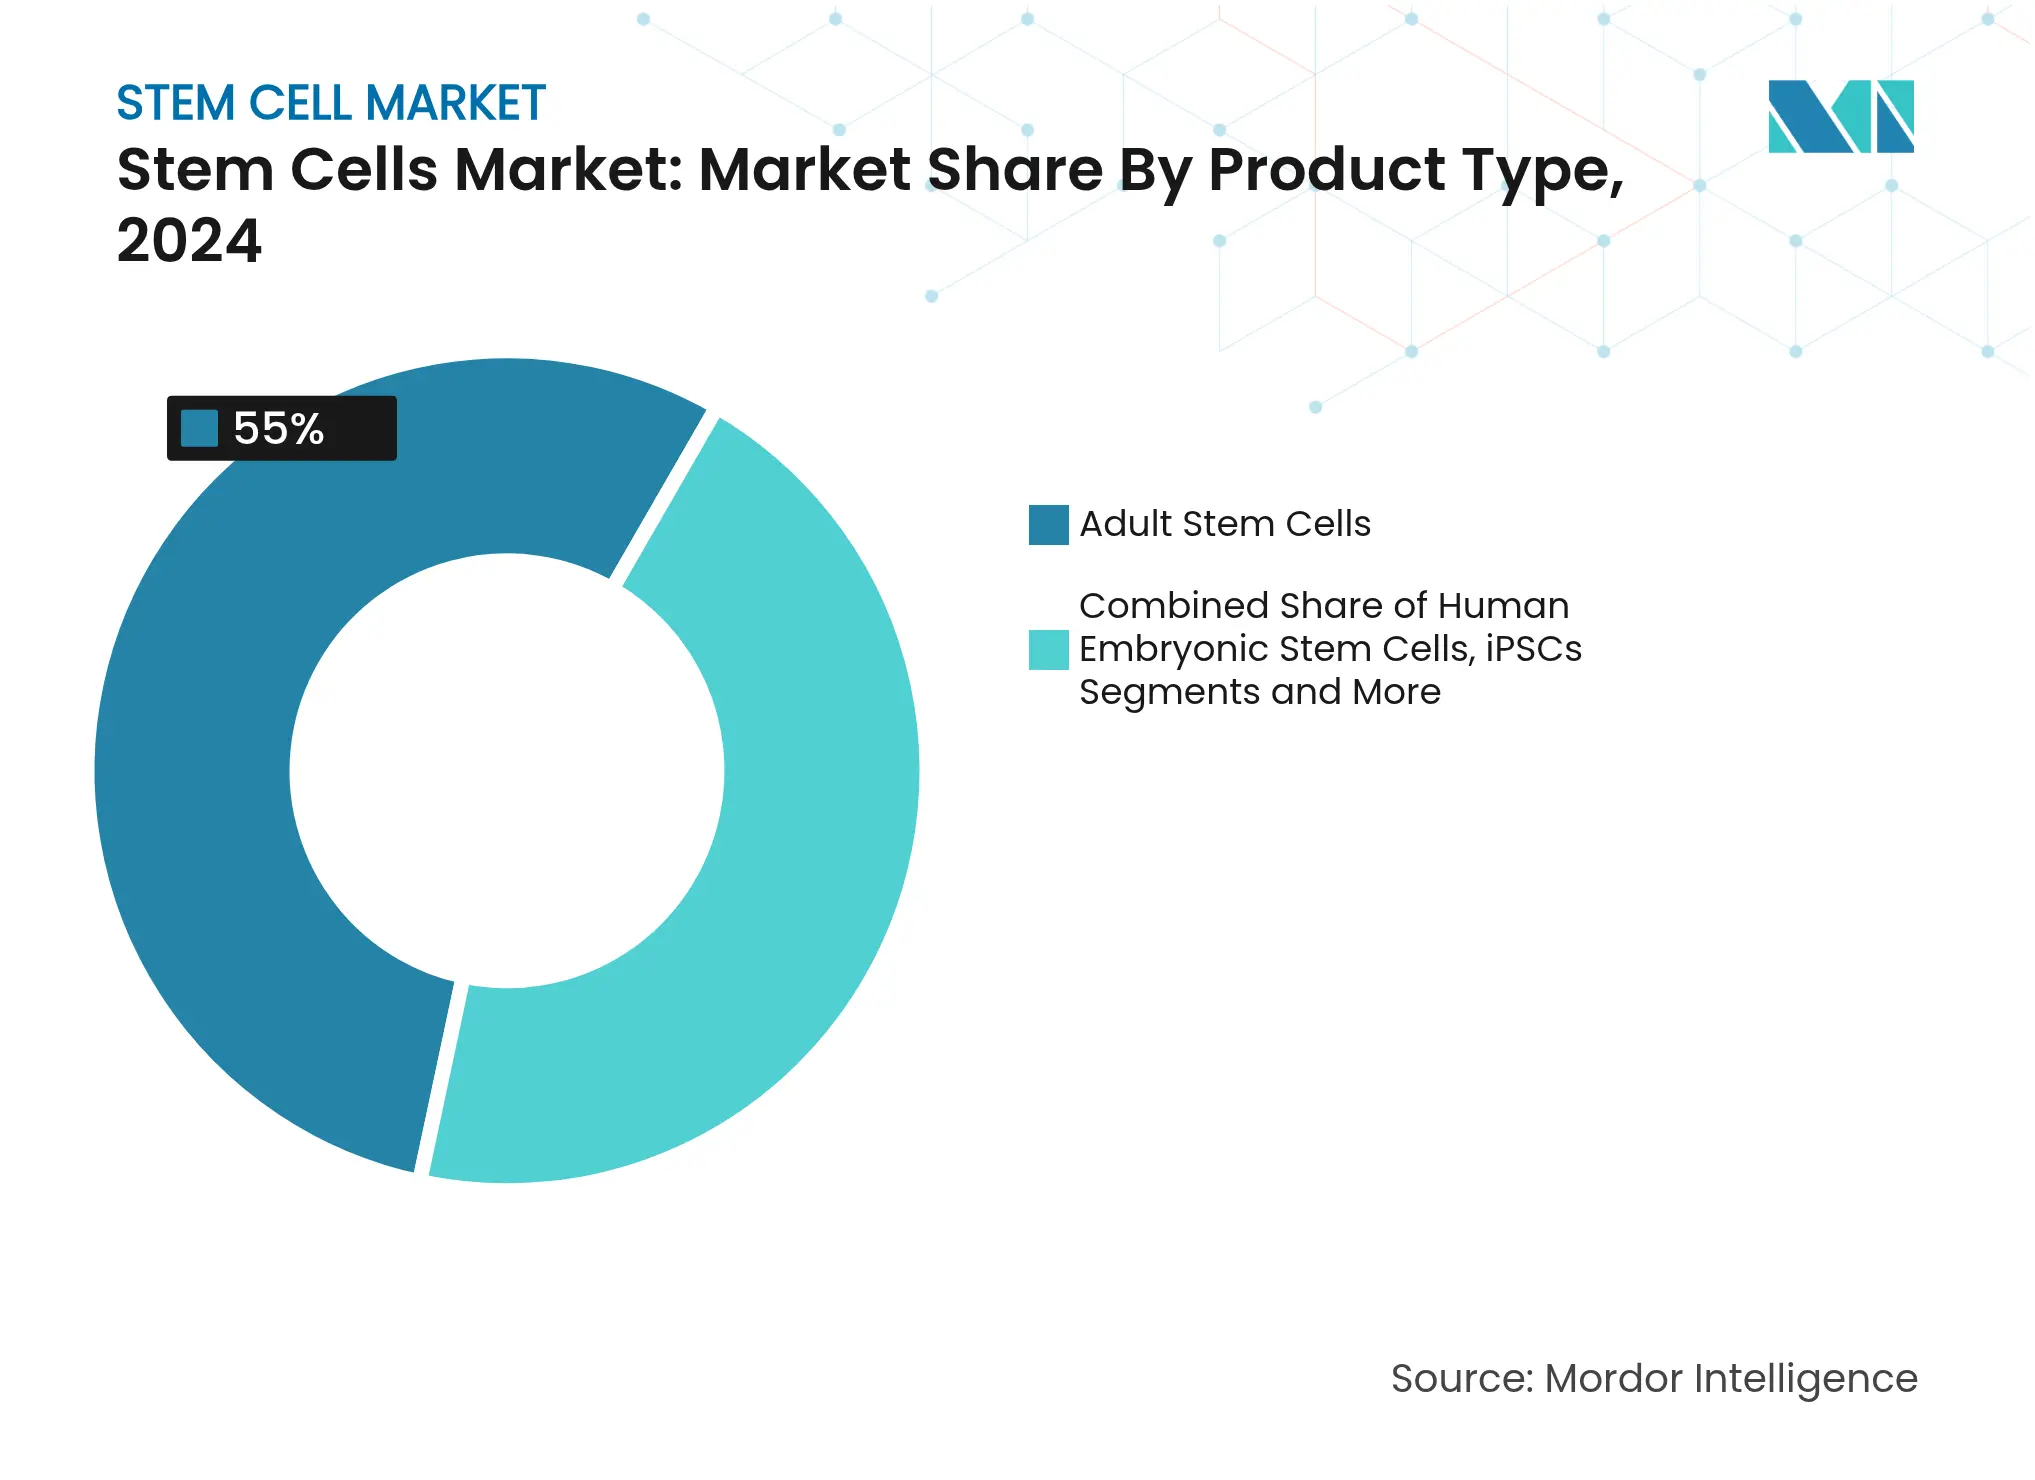
- By product type, adult stem cells led with 55.0% of stem cell market share in 2024, whereas iPSCs are projected to expand at a 10.43% CAGR through 2030.
- By application, orthopedic therapies accounted for 23.0% of the stem cell market size in 2024; neurological disorders are advancing at an 11.23% CAGR to 2030.
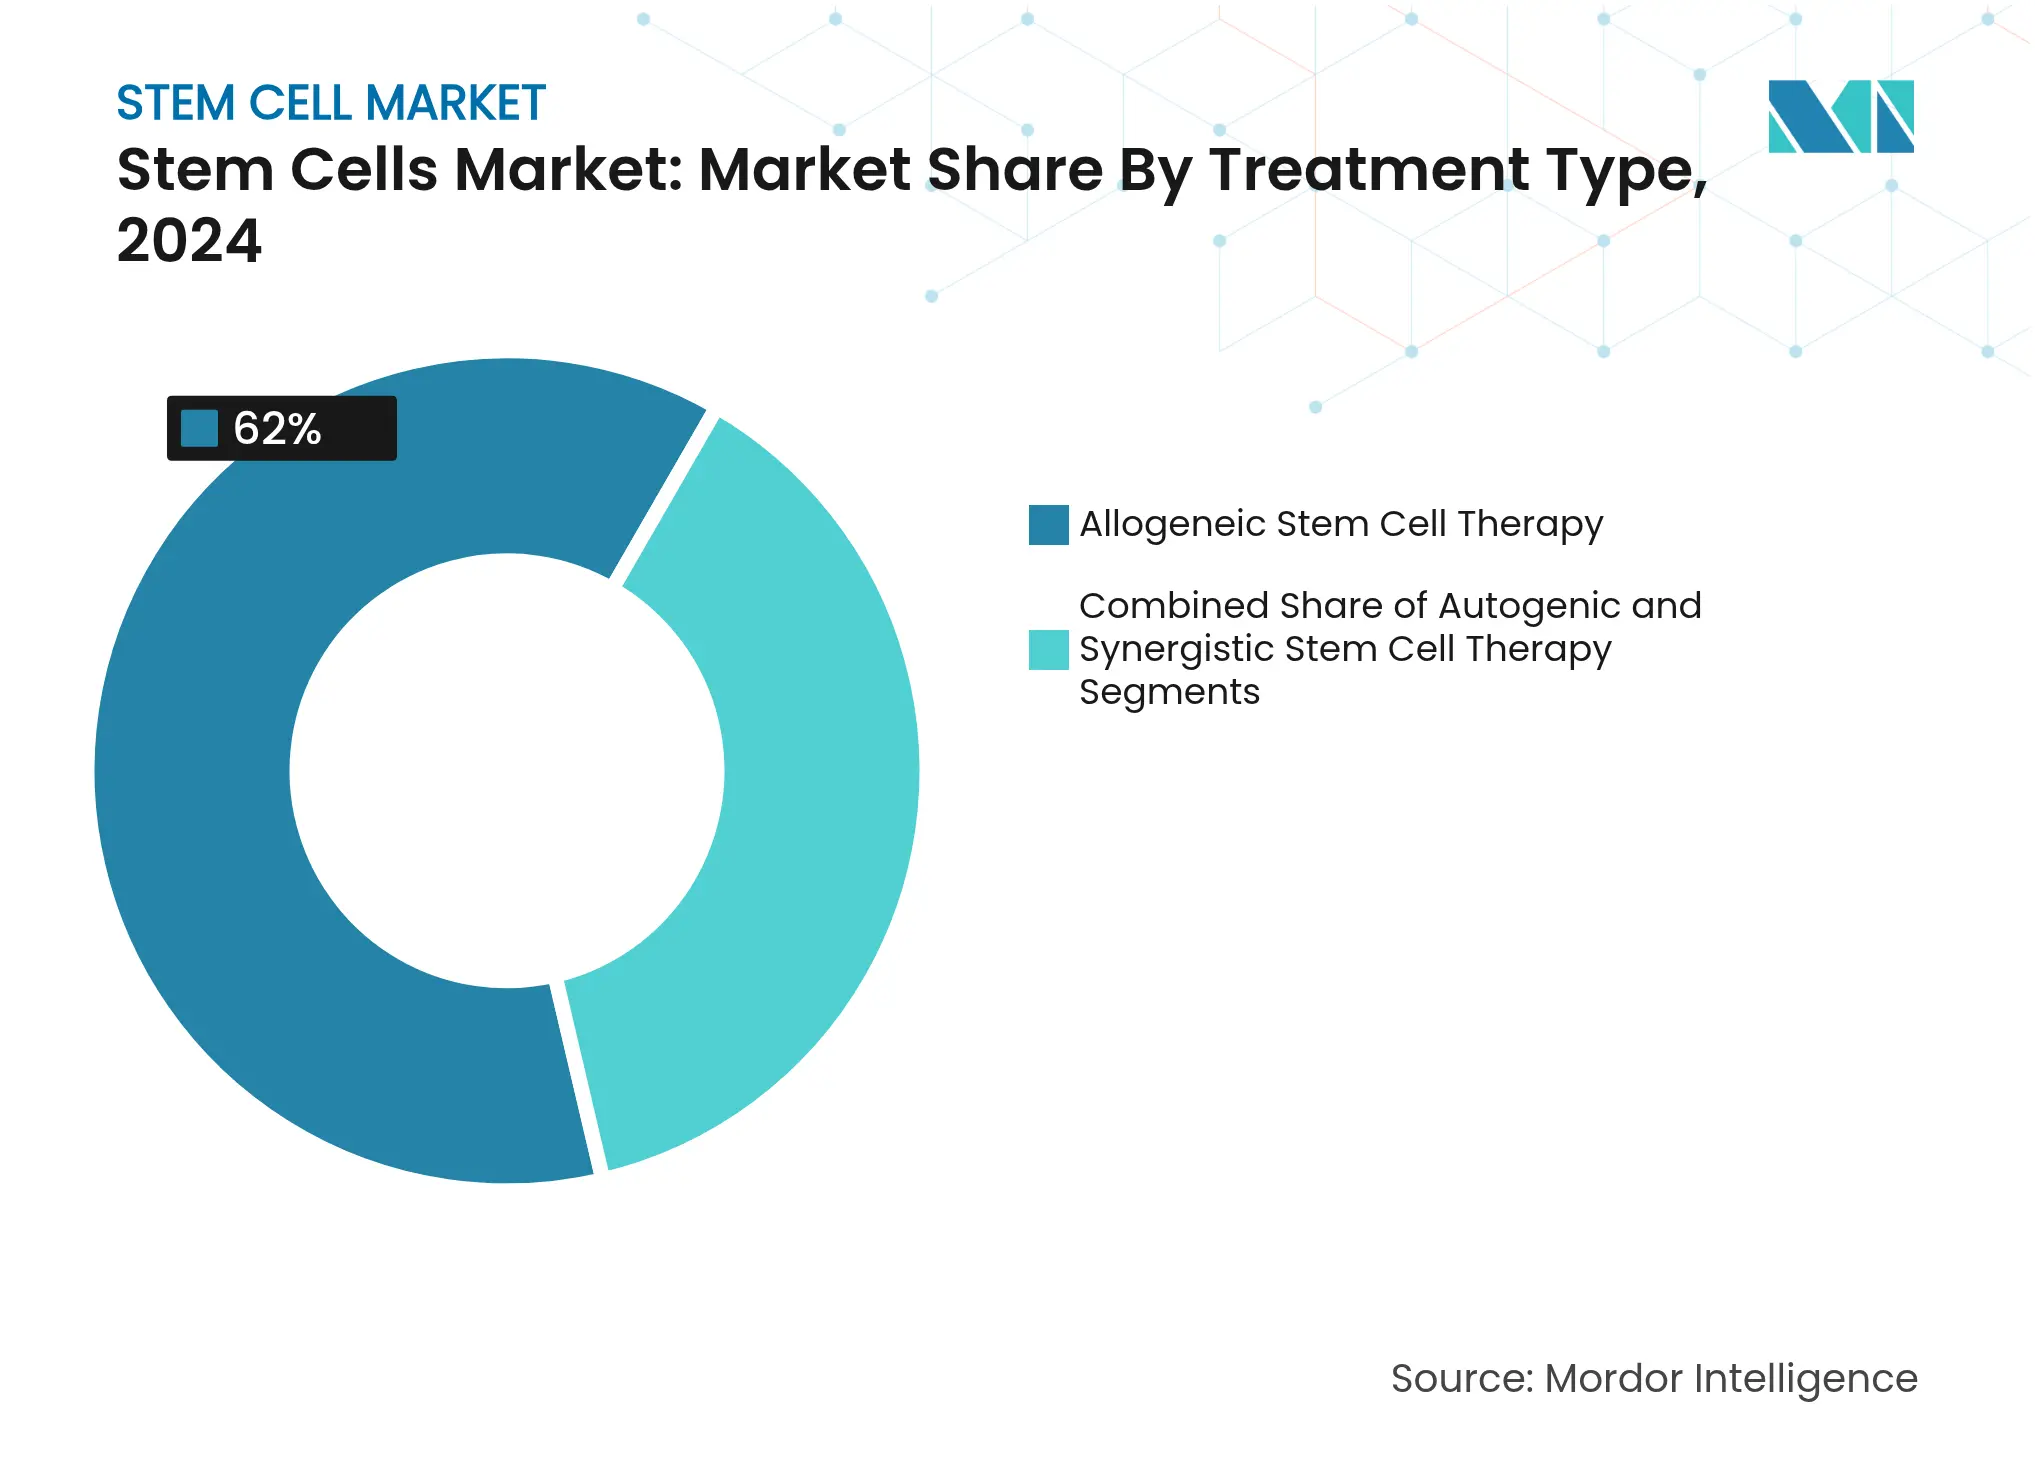
- By treatment type, allogeneic products captured 62.0% of stem cell market share in 2024, while autologous approaches record the highest projected CAGR at 13.45% between 2025-2030.
- By end user, academic and research institutes held 34.0% revenue share in 2024; CDMOs are set to grow at a 15.06% CAGR through 2030.
- By geography, North America commanded 45.0% of the stem cell market size in 2024, whereas Asia-Pacific is forecast to rise at a 14.31% CAGR to 2030.
Global Stem Cell Market Trends and Insights
Driver Impact Analysis
| Driver | (~) % Impact on CAGR Forecast | Geographic Relevance | Impact Timeline | |||
|---|---|---|---|---|---|---|
High
Burden of Chronic and Degenerative Diseases
High
Burden of Chronic and Degenerative Diseases
| 2.8% | Global, with higher impact in North America and Europe | Long term (≥ 4 years) | (~) % Impact on CAGR Forecast:
2.8%
|
Geographic Relevance
:
Global,
with higher impact in North America and Europe
|
Impact Timeline
:
Long
term (≥ 4 years)
|
Rapidly
Expanding Regenerative-Medicine Pipeline
Rapidly
Expanding Regenerative-Medicine Pipeline
| 2.3% | Global, with concentration in North America, Europe, and developed APAC | Medium term (2-4 years) | |||
Favorable
Regulatory Acceleration Pathways
Favorable
Regulatory Acceleration Pathways
| 1.9% | North America, Europe, and Japan | Medium term (2-4 years) | |||
Rising
Penetration of Public and Private Cord-blood/Tissue Banking and
Personalized-Medicine Programs
Rising
Penetration of Public and Private Cord-blood/Tissue Banking and
Personalized-Medicine Programs
| 1.6% | Global, with early adoption in developed markets | Medium term (2-4 years) | |||
Technology
Breakthroughs Enabling Off-the-Shelf Therapies
Technology
Breakthroughs Enabling Off-the-Shelf Therapies
| 2.1% | North America, Europe, and developed APAC | Long term (≥ 4 years) | |||
Intensifying
Collaboration Among Market Players for Innovation and Development in The
Field
Intensifying
Collaboration Among Market Players for Innovation and Development in The
Field
| 1.0% | Global | Short term (≤ 2 years) | |||
| Source: Mordor Intelligence | ||||||
High Burden of Chronic and Degenerative Diseases
Aging demographics are magnifying demand for regenerative options. Parkinson’s disease is forecast to affect 25.2 million people by 2050, with population aging driving 89% of the increase.[1]Dongning Su, Yusha Cui, et al., “Projections for Prevalence of Parkinson’s Disease to 2050,” bmj.comMesenchymal stem cells (MSCs) reduce inflammation, inhibit tissue breakdown, and spur repair, positioning them as cost-effective tools for chronic disease management. Health systems are reallocating budgets toward therapies that can defer expensive long-term care, reinforcing procurement of MSC-based products and fortifying the stem cell market.
Rapidly Expanding Regenerative-Medicine Pipeline
More than 4,000 gene, cell, and RNA therapies are in development, and Phase I programs climbed 11% in early 2024.[2]American Society of Gene & Cell Therapy, “Q1 2024 Data Report,” asgct.org CRISPR editing is boosting CAR-T performance and opening autoimmune indications. AI-enabled analytics now automate cell phenotyping, trimming release testing from days to hours. Clinical evidence is broadening: retinal cell transplants restored meaningful visual acuity, and iPSC-derived constructs demonstrated promising glycemic control in type 1 diabetes. These advances expand addressable populations, lifting the stem cell market outlook.
Favorable Regulatory Acceleration Pathways
The FDA’s RMAT designation and EMA’s PRIME scheme shorten review cycles. The January 2025 approval of Grafapex for allogeneic stem-cell conditioning underscores the speed gains.[3]U.S. Food and Drug Administration, “Oncology/Hematologic Malignancies Approval Notifications,” fda.gov Smaller biotechs secured a growing share of 2024 authorizations, tilting competitive dynamics away from legacy pharma. Japan’s conditional approval framework is now a regional template that accelerates trial initiation and attracts foreign sponsors, further energizing the stem cell market.
Rising Penetration of Cord-Blood/Tissue Banking
Asia-Pacific continues to add facilities; Cordlife resumed operations in Singapore with upgraded quality controls in September 2024. Hybrid public–private banking models address ethical concerns while generating revenue streams. European guidelines mandate informed consent to standardize practices. Novel cryoprotectants such as sulforaphane improve mitochondrial integrity, extending the clinical utility of stored grafts.
Restraint Impact Analysis
| Restraint | (~)% Impact on CAGR Forecast | Geographic Relevance | Impact Timeline | |||
|---|---|---|---|---|---|---|
Safety and Efficacy Uncertainties
Associated with Therapies
Safety and Efficacy Uncertainties
Associated with Therapies
| -1.2% | Global | Medium term (2-4 years) | (~)% Impact on CAGR Forecast:
-1.2%
|
Geographic Relevance
:
Global
|
Impact Timeline
:
Medium term (2-4 years)
|
Restrictive Reimbursement Policies
Restrictive Reimbursement Policies
| -1.8% | Global, with higher impact in emerging markets | Medium term (2-4 years) | |||
Manufacturing Scale Challenges and High
Cost of Products and Procedures
Manufacturing Scale Challenges and High
Cost of Products and Procedures
| -2.1% | Global, with higher impact in emerging markets | Long term (≥ 4 years) | |||
Ethical and Policy Divergence Due to
Persistent Moral Concerns
Ethical and Policy Divergence Due to
Persistent Moral Concerns
| -0.9% | Global, with varying impact based on cultural and religious factors | Long term (≥ 4 years) | |||
| Source: Mordor Intelligence | ||||||
Safety and Efficacy Uncertainties
Tumorigenicity and immunogenicity remain central concerns for pluripotent cell types.[4]Yin Kiong Hoh, “An Instant Update on Stem Cell Therapy,” BioOne Complete, bioone.org Batch variability complicates potency assays, prompting regulators to reinforce oversight. Research groups have engineered immune-cloaked grafts that evade NK-cell detection while integrating into host tissue. A Ninth Circuit ruling affirming FDA authority over cell therapies clarifies compliance obligations but may lengthen timelines.
Restrictive Reimbursement Policies
Treatment costs ranging from USD 5,000-50,000 limit uptake. Payers require robust cost-effectiveness data before coverage, delaying market penetration. CSL Behring’s outcomes-based model for Hemgenix illustrates a viable path to reimbursement. The inclusion of Ryoncil in the U.S. Medicaid rebate framework signals broader acceptance of value-linked payment schemes, encouraging manufacturers to adopt scalable automation that lowers cost of goods.
Segment Analysis
By Product Type: iPSCs Accelerate While Adult Stem Cells Dominate
Adult stem cells held 55.0% of stem cell market share in 2024 owing to a well-documented safety record and broad therapeutic latitude. MSC-specific quality control guidelines now standardize potency assays, supporting widespread clinical use. The stem cell market size for adult stem-cell products is projected to grow steadily as orthopedic, cardiac, and immunological programs mature. Conversely, iPSCs are advancing at a 10.43% CAGR, propelled by improved reprogramming efficiency and expanding GMP capacity. Aspen Neuroscience automated production of ANPD001 for Parkinson’s disease in January 2025, demonstrating how closed-system workflows can compress autologous lead times. VSELs are gaining attention for multi-lineage potential without teratoma risk frontiersin.org. Investor focus is shifting toward off-the-shelf iPSC lines engineered for immune evasion, indicating sustained capital inflows through 2030.
Advances in cryoprotectant cocktails are reducing post-thaw apoptosis, enhancing viability across both adult and iPSC derivatives. Regulatory bodies encourage harmonized release specifications, which will gradually narrow the cost gap between the two product classes. As these innovations integrate into routine practice, the stem cell market will likely see convergence in use cases, particularly where personalized therapies must scale quickly.
By Application: Neurological Disorders Outpace Established Orthopedic Use
Orthopedic indications represented 23.0% of the stem cell market size in 2024, anchored by evidence that MSC injections improve pain scores in osteoarthritis and promote spinal fusion. MSC therapy recorded the highest pain-reduction coefficient among regenerative orthopedic options.[5]Andrew J. Goulian, et al., “Advancements in Regenerative Therapies for Orthopedics,” MDPI, mdpi.comThe segment remains resilient as an aging population drives demand for joint repair. Neurological disorders, however, are on track to grow at an 11.23% CAGR. Progress in dopaminergic neuron replacement has yielded measurable motor gains in Parkinson’s cohorts. Enhanced blood-brain barrier crossing techniques and immune-cloaked cell lines are widening the clinical pipeline for Alzheimer’s disease and stroke. Cardiovascular programs are similarly expanding; Cellipont’s cGMP partnership targets cardiac progenitor cell supply.
Clinical trial diversity is rising. Hematologic cancers continue to anchor transplant volumes, while beta-cell replacement for diabetes is entering Phase II evaluation. Together, these trends reinforce a balanced application mix, supporting continuous revenue growth across the stem cell market.
By Treatment Type: Allogeneic Approaches Lead, Autologous Gains Speed
Allogeneic products captured 62.0% of stem cell market share in 2024 because batch manufacturing delivers cost advantages and immediate availability. More than 500 allogeneic trials are active, targeting oncology, autoimmune, and infectious diseases. Platform improvements, such as cloaked iPSC lines, aim to mitigate rejection, which would further cement allogeneic dominance. Autologous therapies, however, are accelerating at 13.45% CAGR as microfluidic isolation and AI-guided expansion shorten vein-to-vein timelines. The November 2024 approval of AUCATZYL for B-cell ALL illustrates how bespoke approaches achieve regulatory success.
Syngeneic programs remain niche but important for preclinical modeling. Going forward, a hybrid model may emerge in which standardized allogeneic backbones are licensed for patient-specific edits, blending speed with personalization and sustaining momentum in the stem cell market.
By End User: CDMOs Expand Capacity
Academic and research institutes commanded 34.0% revenue in 2024, reflecting grant-funded discovery and early clinical translation. The Maryland Stem Cell Research Fund alone has invested over USD 200 million across 650 projects. CDMOs, growing at 15.06% CAGR, are the fastest-rising stakeholders; complex autologous and gene-edited products require high-grade clean-room suites and digital release systems. Companies are layering AI on batch records to predict deviations and cut downtime, a practice moving from pilot to standard. Hospitals retain a central role as administration hubs, while pharmaceutical firms increase licensing of phase-ready assets to diversify pipelines. Cryopreservation centers benefit from automated inventory and novel cryoprotectants that reduce cell loss. Together, these dynamics reinforce vertically integrated ecosystems that underpin the stem cell market.
Geographic Analysis
North America, with a 45.0% share of the stem cell market size in 2024, benefits from USD 2.21 billion in NIH stem cell funding and an accommodating FDA that cleared the first MSC therapy in December 2024. Robust venture capital and well-established transplant centers accelerate trial enrollment. Canada’s public–private networks are expanding, highlighted by new regenerative-medicine partnerships announced in March 2025.
Asia-Pacific is the fastest-growing region at 14.31% CAGR. China finances embryonic stem cell platforms as a national priority, while Japan’s conditional approval model draws multinational sponsors. India, through its National Biotechnology Development Strategy, incentivizes domestic innovation and infrastructure. South Korea’s cell-therapy tax incentives spur manufacturing, and Australia’s Therapeutic Goods Administration offers expedited pathways for unmet needs. These policies create a fertile environment that steadily enlarges the stem cell market.
Europe sustains solid growth through Horizon research grants and a clear, albeit stringent, advanced-therapy framework. Germany and the United Kingdom lead GMP capacity expansion. The Middle East adopts regenerative products as part of health-care modernization, particularly in the GCC where transplant units are upgrading cryopreservation standards. South America, led by Brazil, improves clinical capability but remains constrained by reimbursement variability. Collectively, these regional developments enhance global diversity and resilience in the stem cell market.
Competitive Landscape
Market Concentration
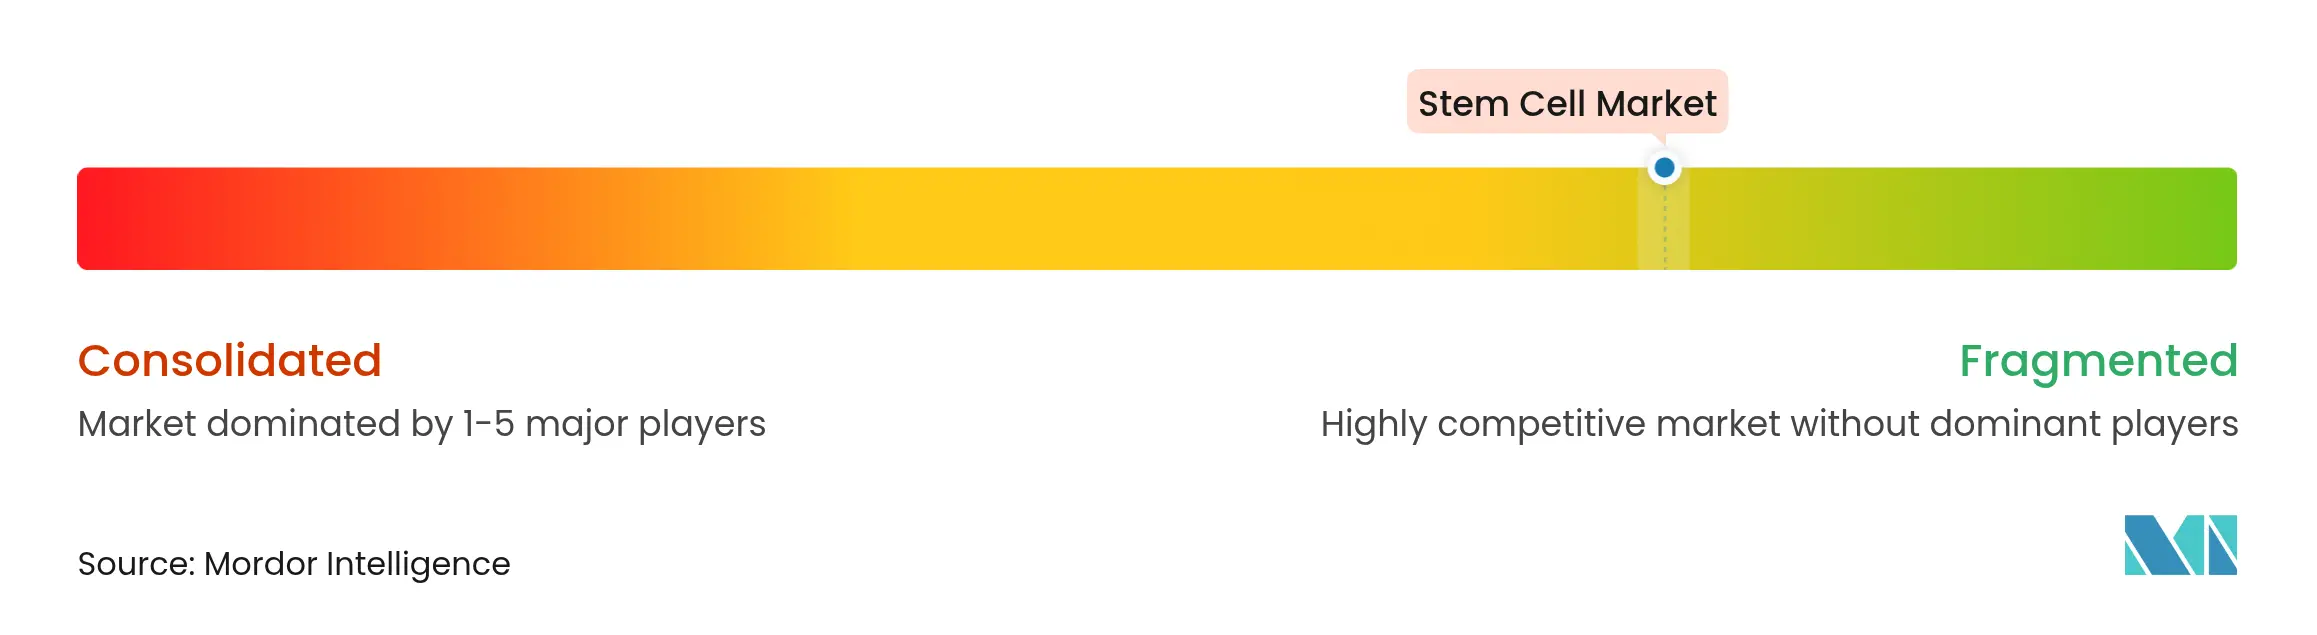
Competition is moderately fragmented. Large pharma is leveraging acquisitions to access next-generation delivery systems; AstraZeneca’s USD 1 billion purchase of EsoBiotec secured the ENaBL in-vivo lentiviral platform. Specialized firms such as Cellino apply AI-driven Nebula technology to automate iPSC production, enabling decentralized hospital-based foundries. Immune-cloaked iPSC developers are positioning off-the-shelf grafts that combine persistence with broad patient compatibility, potentially redefining the allogeneic landscape.
Strategic collaborations dominate: CDMOs pair with biotech to accelerate late-stage manufacturing, and hospitals partner with tech integrators to streamline point-of-care releases. Intellectual-property estates around gene-editing, cell-expansion media, and non-viral delivery vectors are the primary competitive moats. Market entry barriers include costly GMP suites, regulatory compliance, and long development cycles. Nonetheless, white-space remains in scalable, automation-ready platforms that can reduce cost per dose and widen access, ensuring sustained opportunity across the stem cell market
Stem Cell Industry Leaders

*Disclaimer: Major Players sorted in no particular order
Recent Industry Developments
- May 2025: AstraZeneca completed the acquisition of EsoBiotec for up to USD 1 billion to advance its cell-therapy portfolio through the Engineered NanoBody Lentiviral platform.
- April 2025: The Maryland Stem Cell Research Fund awarded USD 18 million to early-stage regenerative projects.
- April 2025: Cellino partnered with Karis Bio to commercialize an autologous iPSC therapy for PAD and CAD.
- March 2025: Cellino and Matricelf began co-developing personalized spinal-injury treatments leveraging automated iPSC production.
Table of Contents for Stem Cell Industry Report
1. Introduction
- 1.1Study Assumptions and Market Definition
- 1.2Scope of the Study
2. Research Methodology
3. Executive Summary
4. Market Landscape
- 4.1Market Overview
- 4.2Market Drivers
- 4.2.1High Burden of Chronic and Degenerative Diseases
- 4.2.2Rapidly Expanding Regenerative-Medicine Pipeline
- 4.2.3Favorable Regulatory Acceleration Pathways
- 4.2.4Rising Penetration of Public and Private Cord-blood/Tissue Banking and Personalized-Medicine Programs
- 4.2.5Technology Breakthroughs Enabling Off-the-Shelf Therapies
- 4.2.6Intesifying Colloboration Among Market Players for Innovation and Development in The Field
- 4.3Market Restraints
- 4.3.1Safety and Efficacy Uncertainties Associated with Therapies
- 4.3.2Restrictive Reimbursement Policies
- 4.3.3Manufacturing Scale Challenges and High Cost of Products and Procedures
- 4.3.4Ethical and Policy Divergence Due to Persistent Moral Concerns
- 4.4Value / Supply-Chain Analysis
- 4.5Regulatory Outlook
- 4.6Technological Outlook
- 4.7Porter’s Five Forces Analysis
- 4.7.1Threat of New Entrants
- 4.7.2Bargaining Power of Buyers
- 4.7.3Bargaining Power of Suppliers
- 4.7.4Threat of Substitutes
- 4.7.5Intensity of Competitive Rivalry
5. Market Size and Growth Forecasts (Value-USD)
- 5.1By Product Type
- 5.1.1Adult Stem Cells
- 5.1.1.1Mesenchymal Stem Cells
- 5.1.1.2Hematopoietic Stem Cells
- 5.1.1.3Neural Stem Cells
- 5.1.2Human Embryonic Stem Cells
- 5.1.3Induced Pluripotent Stem Cells (iPSCs)
- 5.1.4Very Small Embryonic-like Stem Cells
- 5.1.5Other Product Types (e.g., Cancer Stem Cells)
- 5.2By Application
- 5.2.1Neurological Disorders
- 5.2.2Orthopedic Treatments
- 5.2.3Oncology Disorders
- 5.2.4Cardiovascular and Myocardial Infarction
- 5.2.5Diabetes and Metabolic Disorders
- 5.2.6Wounds and Burns
- 5.2.7Other Applications
- 5.3By Treatment Type
- 5.3.1Allogeneic Stem Cell Therapy
- 5.3.2Autologous Stem Cell Therapy
- 5.3.3Syngeneic Stem Cell Therapy
- 5.4By End User
- 5.4.1Academic & Research Institutes
- 5.4.2Hospitals and Surgical Centers
- 5.4.3Pharmaceutical and Biotechnology Companies
- 5.4.4Stem Cell Banks and Cryopreservation Facilities
- 5.4.5Contract Development and Manufacturing Organizations (CDMOs)
- 5.5Geography
- 5.5.1North America
- 5.5.1.1United States
- 5.5.1.2Canada
- 5.5.1.3Mexico
- 5.5.2Europe
- 5.5.2.1Germany
- 5.5.2.2United Kingdom
- 5.5.2.3France
- 5.5.2.4Italy
- 5.5.2.5Spain
- 5.5.2.6Rest of Europe
- 5.5.3Asia-Pacific
- 5.5.3.1China
- 5.5.3.2Japan
- 5.5.3.3India
- 5.5.3.4South Korea
- 5.5.3.5Australia
- 5.5.3.6Rest of Asia-Pacific
- 5.5.4Middle East & Africa
- 5.5.4.1GCC
- 5.5.4.2South Africa
- 5.5.4.3Rest of Middle East & Africa
- 5.5.5South America
- 5.5.5.1Brazil
- 5.5.5.2Argentina
- 5.5.5.3Rest of South America
6. Competitive Landscape
- 6.1Market Concentration
- 6.2Strategic Moves
- 6.3Market Share Analysis
- 6.4Company profiles (includes Global level Overview, Market level overview, Core Segments, Financials as available, Strategic Information, Market Rank/Share for key companies, Products and Services, and Recent Developments)
- 6.4.1ATCC
- 6.4.2Thermo Fisher Scientific Inc.
- 6.4.3Merck KGaA
- 6.4.4STEMCELL Technologies
- 6.4.5Takara Bio Inc.
- 6.4.6Miltenyi Biotec
- 6.4.7Pluri Inc.
- 6.4.8AllCells LLC
- 6.4.9International Stem Cell Corp.
- 6.4.10ReNeuron Group plc
- 6.4.11Bio-Techne Corp.
- 6.4.12Gamida Cell Ltd.
- 6.4.13Fate Therapeutics Inc.
- 6.4.14Cynata Therapeutics Ltd
- 6.4.15BioRestorative Therapies Inc.
- 6.4.16BrainStorm Cell Therapeutics
- 6.4.17Lineage Cell Therapeutics
- 6.4.18Regenexx LLC
- 6.4.19Orchard Therapeutics plc
- 6.4.20Mesoblast Ltd
- 6.4.21Athersys Inc.
- 6.4.22Medipost Co. Ltd.
- 6.4.23PromoCell GmbH
7. Market Opportunities and Future Outlook
- 7.1White-space and Unmet-Need Assessment
Research Methodology Framework and Report Scope
Market Definitions and Key Coverage
Segmentation Overview
- By Product Type
- Adult Stem Cells
- Mesenchymal Stem Cells
- Hematopoietic Stem Cells
- Neural Stem Cells
- Mesenchymal Stem Cells
- Human Embryonic Stem Cells
- Induced Pluripotent Stem Cells (iPSCs)
- Very Small Embryonic-like Stem Cells
- Other Product Types (e.g., Cancer Stem Cells)
- Adult Stem Cells
- By Application
- Neurological Disorders
- Orthopedic Treatments
- Oncology Disorders
- Cardiovascular and Myocardial Infarction
- Diabetes and Metabolic Disorders
- Wounds and Burns
- Other Applications
- Neurological Disorders
- By Treatment Type
- Allogeneic Stem Cell Therapy
- Autologous Stem Cell Therapy
- Syngeneic Stem Cell Therapy
- Allogeneic Stem Cell Therapy
- By End User
- Academic & Research Institutes
- Hospitals and Surgical Centers
- Pharmaceutical and Biotechnology Companies
- Stem Cell Banks and Cryopreservation Facilities
- Contract Development and Manufacturing Organizations (CDMOs)
- Academic & Research Institutes
- Geography
- North America
- United States
- Canada
- Mexico
- United States
- Europe
- Germany
- United Kingdom
- France
- Italy
- Spain
- Rest of Europe
- Germany
- Asia-Pacific
- China
- Japan
- India
- South Korea
- Australia
- Rest of Asia-Pacific
- China
- Middle East & Africa
- GCC
- South Africa
- Rest of Middle East & Africa
- GCC
- South America
- Brazil
- Argentina
- Rest of South America
- Brazil
- North America
Detailed Research Methodology and Data Validation
Primary Research
Desk Research
Market-Sizing & Forecasting
Data Validation & Update Cycle
Why Our Stem Cells Baseline Earns Trust
Benchmark comparison
| Market Size | Anonymized source | Primary gap driver | ||
|---|---|---|---|---|
USD 17.13 B | Mordor Intelligence | - | Anonymized source:Mordor Intelligence | Primary gap driver:- |
USD 16.84 B | Global Consultancy A | Omits IP-licensing income and uses 2023 price deck | ||
USD 19.34 B | Industry Association B | Bundles early commercial therapy revenues and applies aggressive 16% CAGR without primary validation |