
Fluorescent In Situ Hybridization Market Size and Share
Market Overview
| Study Period | 2020 - 2031 |
|---|---|
| Market Size (2026) | USD 1.3 Billion |
| Market Size (2031) | USD 1.84 Billion |
| Growth Rate (2026 - 2031) | 7.24 % |
| Fastest Growing Market | Asia Pacific |
| Largest Market | North America |
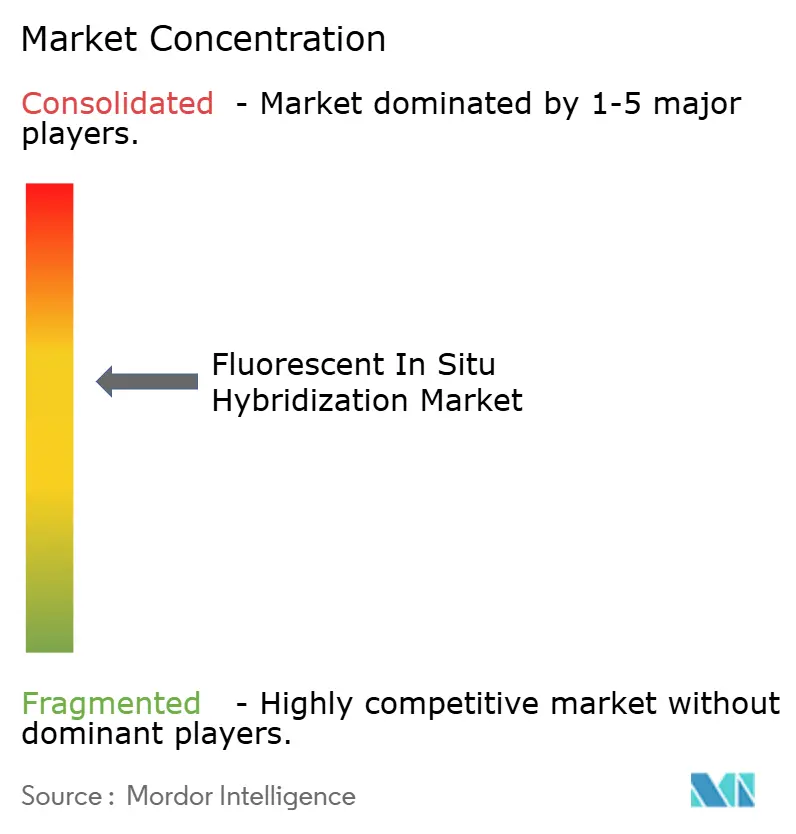
| Market Concentration | Medium |
Major Players *Disclaimer: Major Players sorted in no particular order Image © Mordor Intelligence. Reuse requires attribution under CC BY 4.0. | |
Fluorescent In Situ Hybridization Market Analysis by Mordor Intelligence
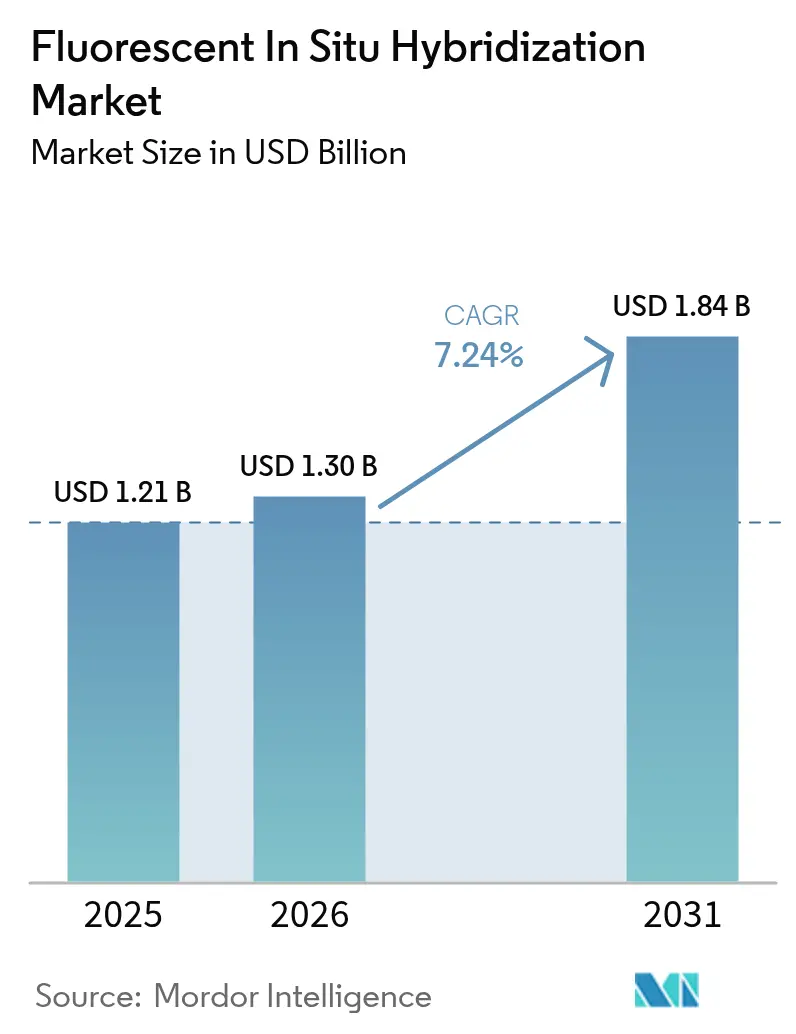
The Fluorescent In Situ Hybridization Market size was valued at USD 1.21 billion in 2025 and estimated to grow from USD 1.30 billion in 2026 to reach USD 1.84 billion by 2031, at a CAGR of 7.24% during the forecast period (2026-2031).
This advance reflects rising cancer incidence, broader reimbursement for genomic tests, and the transition from manual cytogenetics to AI-enabled digital pathology. Demand is reinforced by pharmaceutical reliance on FISH assays for companion diagnostics, lower probe manufacturing costs, and expanding single-cell applications that validate cell and gene-therapy products. Suppliers leverage integrated imaging systems that shorten turnaround times while mitigating laboratory staffing gaps, and payers view FISH as cost-effective when it prevents ineffective therapy selections. Regional momentum remains strongest in Asia-Pacific where precision-medicine programs, local probe production, and portable readers accelerate access.
Key Report Takeaways
- By product type, kits and reagents held 43.78% of fluorescent in situ hybridization market share in 2025, while digital imaging and analysis systems are projected to grow at 9.32% CAGR through 2031.
- By application, cancer diagnostics accounted for 61.85% share of the fluorescent in situ hybridization market size in 2025; cell and gene-therapy quality control is expected to expand at 10.36% CAGR to 2031.
- By end user, clinical diagnostic laboratories led with 46.95% revenue share in 2025, whereas pharmaceutical and biotech companies are set to grow at 10.91% CAGR through 2031.
- By geography, North America dominated with 42.55% revenue share in 2025; Asia-Pacific is forecast to register the fastest 9.83% CAGR between 2026 and 2031.
Note: Market size and forecast figures in this report are generated using Mordor Intelligence’s proprietary estimation framework, updated with the latest available data and insights as of 2026.
Market Trends and Insights
Drivers Impact Analysis of Fluorescent In Situ Hybridization Market*
| Driver | (~) % Impact on CAGR Forecast | Geographic Relevance | Impact Timeline |
|---|---|---|---|
| Rising Global Cancer Incidence & Wider Genomic Testing Reimbursement | +1.8% | Global, with strongest impact in North America & Europe | Medium term (2-4 years) |
| Escalating Adoption of FISH in Companion Diagnostics for Targeted Oncology Drugs | +1.5% | Global, led by North America, expanding to APAC | Short term (≤ 2 years) |
| Rapid Fall in Probe Manufacturing Costs Due to Ink-Jet Oligo Synthesis | +1.2% | Global manufacturing hubs, particularly Asia-Pacific | Long term (≥ 4 years) |
| Expansion of Digital Pathology Platforms Integrating AI-Augmented FISH Image Analytics | +1.4% | North America & Europe initially, scaling to APAC | Medium term (2-4 years) |
| Growing Demand for Single-Cell Cytogenomics in Cell & Gene-Therapy Process QC | +0.9% | North America & Europe, emerging in Asia-Pacific | Long term (≥ 4 years) |
| Commercialization of Portable, Battery-Powered FISH Readers for Low-Resource Settings | +0.5% | APAC, MEA, Latin America | Long term (≥ 4 years) |
| Source: Mordor Intelligence | |||
Rising Global Cancer Incidence & Wider Genomic Testing Reimbursement
Cancer-related FISH volumes grow as payers approve broader genomic panels for breast, lung, and hematologic malignancies. The FDA endorsement of Roche’s PATHWAY HER2 test for biliary-tract cancer in 2024 showed how regulatory recognition enlarges patient pools beyond traditional settings.[1]Roche Communications, “FDA Approves PATHWAY HER2 Test for Biliary Tract Cancer,” roche.com Insurers view precision diagnostics as a cost saver when matched therapies avoid ineffective regimens. Laboratories pair FISH with next-generation sequencing to heighten diagnostic accuracy and still secure reimbursement. This virtuous cycle supports steady uptake across hospital and reference labs in North America and Europe.
Escalating Adoption of FISH in Companion Diagnostics for Targeted Oncology Drugs
Pharmaceutical pipelines depend on chromosomal translocation and gene-amplification assays to qualify trial cohorts. The FDA approval of zanidatamab for HER2-positive biliary-tract cancer, backed by a FISH-based companion diagnostic, underscored FISH’s role in unlocking niche oncology markets.[2]OncLive Editorial Staff, “FDA Authorizes Zanidatamab Companion Diagnostic,” onclive.com Co-development models align drug and assay timelines, lowering clinical risk for both parties. High assay specificity limits false positives, protecting therapeutic effect claims. As trial sponsors build in-house cytogenetics groups to shorten study cycles, the fluorescent in situ hybridization market gains a durable revenue stream.
Rapid Fall in Probe Manufacturing Costs Due to Ink-Jet Oligo Synthesis
Industrial ink-jet systems now deliver 99.5% coupling efficiencies with costs down to USD 0.002 per base, enabling affordable high-quality probes in emerging laboratory environments. Localized production in China and India trims import tariffs and shipping delays, fueling Asia-Pacific’s 9.96% CAGR. Academic groups have demonstrated 3D-printed synthesizers that further depress unit costs, expanding access to customized probes for rare cytogenetic targets. These structural savings widen the fluorescent in situ hybridization market by lowering entry barriers for mid-size hospitals and research institutes.
Expansion of Digital Pathology Platforms Integrating AI-Augmented FISH Image Analytics
AI-enabled algorithms raise mitosis-detection accuracy in breast carcinoma from 62% to 76% and cut interpretation time by 40%.[3]MDPI Diagnostics Collective, “AI-Assisted Mitotic Count Improves Breast Pathology,” mdpi.com European guidelines now promote fully digital workflows with standardized quality checkpoints. Integration through HL7 interfaces lets FISH image outputs stream directly into electronic medical records, producing faster clinician reports. Vendors that bundle scanners, image analysis, and LIS connectivity, therefore, capture premium positions in the fluorescent in situ hybridization market.
Restraints Impact Analysis of Fluorescent In Situ Hybridization Market*
| Restraint | (~) % Impact on CAGR Forecast | Geographic Relevance | Impact Timeline |
|---|---|---|---|
| Shortage of Cytogenetic Technologists in Developed Economies | -0.8% | North America & Europe primarily | Short term (≤ 2 years) |
| High Capital Outlay for Fully Automated FISH Workstations | -0.6% | Global, most acute in emerging markets | Medium term (2-4 years) |
| Reproducibility Challenges in Multiplex RNA-FISH Probes | -0.4% | Global research and clinical applications | Long term (≥ 4 years) |
| Stringent Validation Hurdles for Laboratory-Developed FISH Tests Under IVDR (EU) | -0.7% | European Union, with spillover effects globally | Medium term (2-4 years) |
| Source: Mordor Intelligence | |||
Shortage of Cytogenetic Technologists in Developed Economies
Vacancy rates in US cytogenetics labs reached 13.2% in 2024 and nearly 27% of current technologists expect to retire within five years. Automation eases slide preparation and scoring, yet final case sign-off still demands certified staff. Laboratories therefore face overtime costs and delayed turnaround, which can blunt the fluorescent in situ hybridization market’s near-term growth in North America and Europe. Vendor training programs and remote-expert networks offer partial relief, but credential pipelines remain stretched.
High Capital Outlay for Fully Automated FISH Workstations
Integrated staining, hybridization, and imaging platforms cost USD 350,000-400,000, a hurdle for mid-tier hospitals in Latin America and Southeast Asia. Leasing models and reagent-rental contracts can soften the blow, yet budget cycles in public health systems slow adoption. Portable readers ease point-of-care testing but cannot yet handle high-volume oncology screens. This pricing tension constrains the fluorescent in situ hybridization industry until scale economies lower system costs.
*Our forecasts treat driver/restraint impacts as directional, not additive. The impact forecasts reflect baseline growth, mix effects, and variable interactions.
Fluorescent In Situ Hybridization Market Segment Analysis
By Product Type:
Digital Systems Drive InnovationThe segment opened 2025 with kits and reagents supplying 43.78% revenue, emphasizing the consumable foundation of the fluorescent in situ hybridization market. DNA probes dominate routine HER2 and ALK testing, while RNA probes gain traction in spatial transcriptomics. Instruments account for roughly one-third of sales, split between manual microscopes for low-volume labs and high-throughput automated stations. Software and services form the balance, expanding as cloud-based analytics gain regulatory acceptance.
Digital imaging systems, buoyed by AI algorithms, are the fastest risers at 9.32% CAGR. Median HER2 signal count rose from 4.0 to 7.5 per nucleus on a super-resolution platform, proving diagnostic uplift. Automation reduces chemical exposure and turnaround times, winning favor with overstretched laboratory staff. Vendors that align consumables with scanners through closed-loop ecosystems deepen customer lock-in and stabilize the fluorescent in situ hybridization market size at the product level. Digital platforms also open remote-read opportunities that lighten the technologist's burden. Cloud architectures transfer image data across sites without quality loss, while AI triages high-risk slides for senior review. This workflow lets regional hospitals access subspecialty expertise without geographic constraints, broadening the fluorescent in situ hybridization market reach in rural settings. As probe and imaging suppliers co-develop turnkey bundles, pricing moves toward outcome-based models tied to report volumes, aligning vendor and laboratory incentives.




By Application:
Cell Therapy QC Accelerates GrowthCancer diagnostics remained the anchor at 61.85% fluorescent in situ hybridization market share in 2025, spanning breast, lung, and hematologic assays. Breast cancer testing benefits from mature reimbursement and clear ASCO-CAP guidelines, while lung-fusion testing competes with next-generation sequencing but retains value in rapid intraoperative settings. Prenatal and constitutional genetic screens deliver steady volumes, though their growth lags oncology. The fluorescent in situ hybridization market size for cell and gene-therapy quality control is growing as regulators tighten genomic-stability demands. Gene-edited CAR-T processes incorporate multi-color FISH panels to detect vector integration hotspots before lot release. Single-cell approaches map clonal diversity, safeguarding efficacy and safety.
As living medicines mature, lot-release testing windows compress, forcing labs to automate hybridization and scoring. Vendors now supply GMP-grade probe kits with certificate of analysis for regulatory filings. Partnerships between therapy developers and diagnostics firms shorten validation timelines, aligning assay deployment with phase 3 study milestones. This synergy draws new capital into the fluorescent in situ hybridization industry and speeds global standardization of best-practice QC protocols.
By End User:
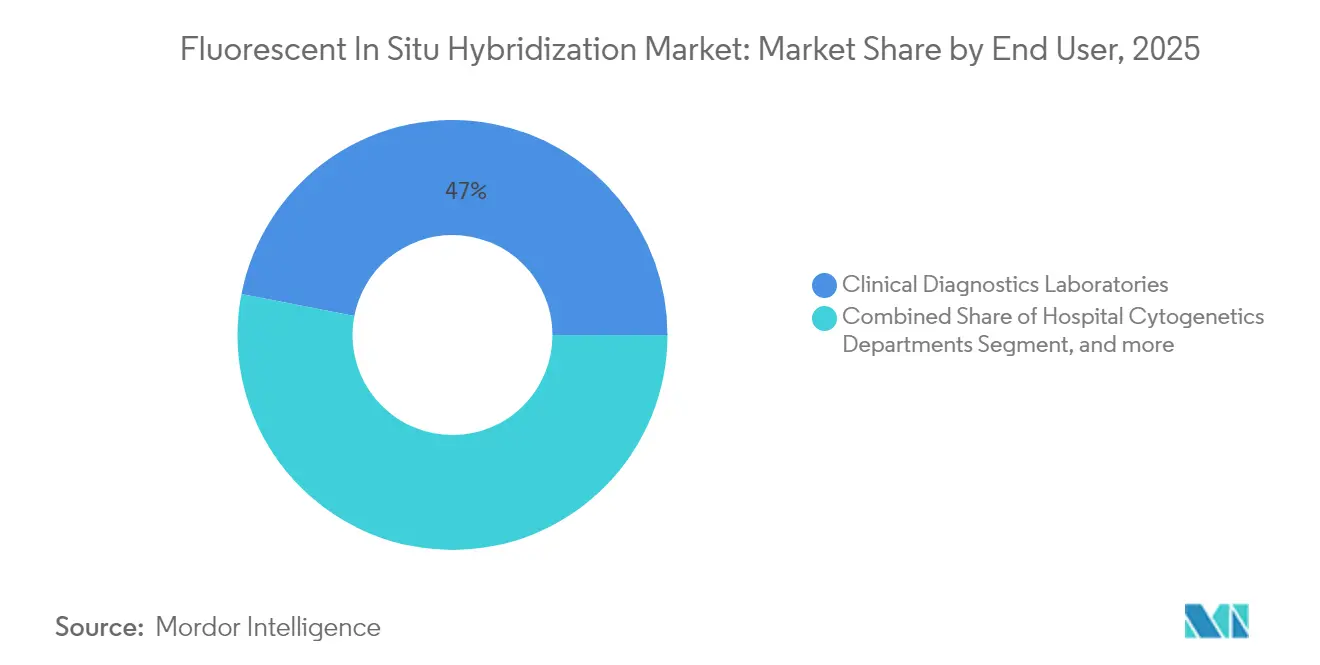
Pharma Companies Lead GrowthClinical diagnostics laboratories furnished 46.95% of 2025 revenue, underpinned by routine oncology testing managed through centralized models. Hospital cytogenetics units commanded about a quarter of volumes, focusing on complex karyotype interpretation. Academic centers and contract research organizations together supplied niche research and overflow capacity. Pharmaceutical and biotech firms, however, are poised for the fastest 10.91% CAGR as they internalize FISH for biomarker-driven trials. Agilent’s USD 925 million acquisition of BioVectra underscored the importance of in-house oligonucleotide control. Drug sponsors seek data sovereignty, faster iteration, and alignment with regulatory submission packs. Consequently, they equip process-development suites with automated imagers and validated probes, expanding the fluorescent in situ hybridization market footprint inside industry campuses.
Vendor service arms now run embedded laboratories within sponsor facilities to blend diagnostics know-how with therapeutic workflows. This model trims specimen logistics and guards intellectual property, while subscription contracts convert capital spending into operational budgets. As portfolio pipelines diversify into solid tumors and rare diseases, FISH assay menus expand, reinforcing vendor relationships and enlarging the fluorescent in situ hybridization market.
Geography Analysis
North America Fluorescent in Situ Hybridization Market
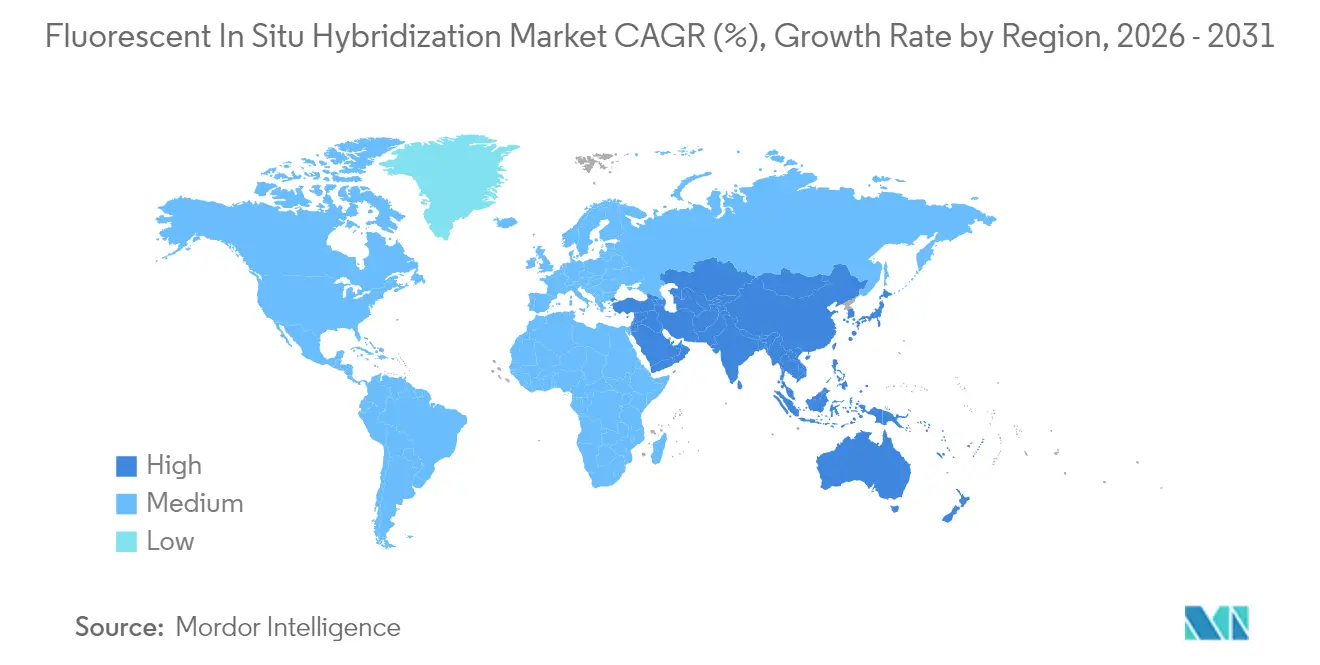
North America held 42.55% revenue in 2025, anchored by comprehensive insurance coverage, large cancer-center networks, and an ecosystem of reference laboratories. The United States benefits from clear FDA pathways and national proficiency-testing programs that ensure assay quality. Canada provides stable growth through universal healthcare, while Mexico’s private-hospital segment adopts portable FISH readers for oncology screening. The region also houses many AI start-ups that license algorithms into existing lab information systems, raising platform value.
Europe Fluorescent in Situ Hybridization Market
Europe, led by Germany, the United Kingdom, and France, contributed to global demand. IVDR compliance raised near-term costs, yet set standard quality benchmarks that favor vendors with robust documentation. Italy’s deployment of deep learning for digital slides advanced reimbursement discussions for telepathology services. Spain and other Southern markets integrate companion diagnostics into national cancer strategies, broadening patient access. Despite currency pressures, public health digitization funds support the procurement of automated FISH systems.
APAC Fluorescent in Situ Hybridization Market
Asia-Pacific is projected to record the highest 9.83% CAGR. China’s public-insurance reforms now list multiple FISH assays, driving rural uptake. India’s premier institutes pilot AI tools that shorten report times and standardize interpretation. Japan’s aging population raises screening volumes, while Australia and South Korea combine developed reimbursement models with vibrant biotech pipelines. Local probe factories lower costs and circumvent logistics delays, which sustains adoption in Southeast Asia. Portable, battery-powered readers serve field oncology programs in Indonesia and Vietnam, expanding the fluorescent in situ hybridization market reach.

Competitive Landscape
The fluorescent in situ hybridization market exhibits moderate consolidation. A small set of global suppliers integrates probe manufacture, instrumentation, and analytic software, enabling bundled solutions that command premium pricing. Abbott maintains one of the largest commercially available probe libraries with more than 300 Vysis assays, covering common and rare oncogenic targets. Roche, Agilent, and Thermo Fisher invest in AI acquisitions to accelerate digital-pathology rollouts. Vertical integration secures component quality and simplifies regulatory filings, particularly important under IVDR.
Strategic collaborations with pharmaceutical firms for companion-diagnostic co-development remain a core theme. Such partnerships align assay validation with drug-registration timelines and guarantee initial testing volumes once therapies reach market. Market entrants focus on differentiated niches. Companies developing multiplex FISH for spatial transcriptomics address research clients requiring thousands of gene targets. Others build portable systems for decentralized cancer programs in low-resource settings. Acquisition activity centers on filling portfolio gaps in automation, cloud analytics, and GMP probe production.
Regulatory scrutiny shapes competitive dynamics. Vendors certified to ISO 13485 and compliant with EU IVDR gain fast-track acceptance in hospital tenders. Smaller firms face steep documentation costs, encouraging licensing deals with larger players. Workforce shortages propel demand for turnkey automated lines that minimize operator steps. This environment sustains R&D spending on robotics, AI, and novel fluorophores, reinforcing competitive barriers around intellectual property and service networks.
Fluorescent In Situ Hybridization Industry Leaders
Agilent Technologies
Genemed Technologies Inc.
Thermo Fisher Scientific Inc.
PerkinElmer
F. Hoffmann-La Roche Ltd.
- *Disclaimer: Major Players sorted in no particular order
Fluorescent In Situ Hybridization Market Companies Covered in this Report
- Agilent Technologies
- Abbott Molecular
- Thermo Fisher Scientific
- Roche
- PerkinElmer
- Bio-Rad Laboratories
- Merck
- QIAGEN
- Oxford Gene Technology
- BioView
- Biocare Medical
- Genemed Biotechnologies
- OPKO Diagnostics
- Advanced Cell Diagnostics
- Abnova
- Biodot
- Cytocell Ltd
- Danaher
- Empire Genomics
- ZytoVision
Read Analysis of Fluorescent In Situ Hybridization Companies

Market Opportunities and Future Outlook
Companion diagnostics expansion around HER2 stratification is creating whitespace for ISH/FISH vendors that can deliver standardized, therapy-linked workflows across pathology laboratories. Regulatory and access signals include Roche/Ventana milestones around VENTANA HER2 Dual ISH and related HER2 testing use cases (including HER2-ultralow and metastatic breast cancer alignment with ENHERTU labeling), and the FDA proposal (June 2025) to reclassify in situ hybridization (ISH) test systems for use with corresponding approved therapeutic products, which raises the value of well-documented, therapy-tied assays. For laboratories, CLSI guideline MM07 anchors opportunities in probe development, validation, and quality assurance, supporting adoption in networks that need consistent inter-site performance and audit-ready documentation.
Digital enablement and automation are the main execution priorities as FISH volumes scale while technologist availability stays constrained. At AACR 2026, presentations highlighted scalable digitally enabled FISH workflows for HER2 and genomic biomarker assessment in FFPE tissue with automated scoring and inter-site concordance using digital pathology tools such as HALO, QuPath, and Visiopharm, reinforcing demand for integrated scanner, software, and LIS/EMR-connected workflows. On the supply side, localized probe manufacturing and ready-to-use assay libraries extend access beyond top-tier centers, while oncology programs in Asia-Pacific and emerging markets create room for portable readers and reagent-rental or pay-per-test models that reduce the USD 350,000-400,000 automation barrier for mid-tier hospitals.
Recent Industry Developments in Fluorescent In Situ Hybridization Market
- March 2026: Agilent Technologies announced a definitive agreement to acquire Biocare Medical for USD 950 million, adding immunohistochemistry and FISH pathology solutions to its portfolio. The acquisition strengthens Agilent's position in end-to-end anatomic pathology workflows that combine staining, probes, and interpretation, supporting bundled offerings for clinical laboratories.
- September 2025: Roche announced CE IVDR approval for the VENTANA HER2 (4B5) assay, supporting identification of HER2-ultralow breast cancer and biliary tract cancer patients in Europe. IVDR-aligned labeling and documentation can simplify tender participation and multi-site standardization for laboratories upgrading to compliant companion diagnostic workflows.
- June 2024: Ikonisys and Ulisse BioMed announced a strategic partnership to support innovation in cancer diagnostics. The collaboration links automated microscopy and analysis with assay development capabilities, reflecting continued vendor push toward more automated and reproducible oncology testing workflows.


Fluorescent In Situ Hybridization Market Report Scope and Research Methodology
Market Definition and Coverage
This market covers revenues generated from fluorescent in situ hybridization (FISH) testing solutions that detect or localize DNA or RNA targets using fluorescent probes in clinical and research workflows, including the supporting tools needed to run and interpret FISH assays.
Scope exclusions: Standalone histopathology staining supplies that are not used for FISH, and broader genomic tests that do not use FISH probe hybridization, are not counted.
Segments Covered in This Report
- By Product Type
- Instruments
- Automated FISH Workstations
- Manual Fluorescence Microscopes
- Digital Imaging & Analysis Systems
- Kits & Reagents
- DNA Probes
- RNA Probes
- PNA / LNA Probes
- Software & Services
- Instruments
- By Application
- Cancer Diagnostics
- Breast Cancer
- Lung Cancer
- Hematologic Malignancies
- Genetic Disease Screening
- Neurological Disorders
- Companion Diagnostics
- Cell & Gene-Therapy Manufacturing QC
- Others
- Cancer Diagnostics
- By End User
- Clinical Diagnostics Laboratories
- Hospital Cytogenetics Departments
- Academic & Research Institutes
- Pharma & Biotech Companies
- Contract Research Organizations
- By Geography
- North America
- United States
- Canada
- Mexico
- Europe
- Germany
- United Kingdom
- France
- Italy
- Spain
- Rest of Europe
- Asia-Pacific
- China
- Japan
- India
- Australia
- South Korea
- Rest of Asia-Pacific
- Middle East & Africa
- GCC
- South Africa
- Rest of Middle East & Africa
- South America
- Brazil
- Argentina
- Rest of South America
- North America
Data Sources, Market Sizing, and Validation
Desk Research
Desk work was used to build the initial demand picture and the operating assumptions that anchor the model. We relied on public health and research signals such as cancer incidence and screening guidance from the World Health Organization, the US National Cancer Institute, and CDC publications, then added lab and diagnostics context from FDA databases and peer-reviewed journals on cytogenetics and molecular diagnostics.
To translate demand into spend, we also reviewed company filings, investor presentations, reputable press coverage, and association or society pages that discuss cytogenetics testing practices and reimbursement direction. Where useful, we pulled standardized company financials, news and financials, and patent database outputs to sanity check product launches, assay adoption, and pricing movement. This list is illustrative only, and other public sources were also used for data collection, validation, and clarification.
Primary Interviews and Surveys
Primary work focused on interviews and structured questionnaires with cytogenetics lab leaders, hospital and reference lab managers, distributors, and technical specialists involved in FISH workflows across APAC, EMEA, and the Americas. Their input helped us confirm typical testing mixes, how often analytical instruments are replaced, what pricing looks like by kit, probe, and service bundle, and which clinical use cases are gaining share. We then tightened the assumptions taken from desk findings to reflect what respondents described.
Distribution of primary research fieldwork respondents
| Company type | Respondent position | Region |
|---|---|---|
| Top tier: 38% | CXOs: 12% | APAC: 43% |
| Mid tier: 46% | Functional/Unit leaders: 38% | EMEA: 32% |
| Smaller Players: 16% | Managers: 50% | Americas: 25% |
Market-Sizing & Forecasting
Sizing starts with a top-down demand pool built using disease burden and testing intensity, where diagnosed and monitored cohorts are translated into likely FISH test volumes by major indication and care setting. Those volumes are then linked to spend using an average selling price ladder across kits and reagents, probes, instruments, and software or services, and the totals are cross checked using selective bottom-up approximations like supplier and channel feedback on installed base, utilization, and replenishment patterns.
Key inputs used in the model include oncology and genetic disease testing volumes, cytogenetics lab throughput and turnaround targets, installed base replacement cycles for analytical instruments, reagent and probe consumption per test, and price movement by product category, including mix shifts toward higher value probe panels. Forecasting is run using scenario analysis, where adoption of new probe designs, lab capacity expansion, and macro funding direction are stress tested with expert consensus, and then reconciled back to the historical growth pattern. Where bottom-up pieces are incomplete for smaller countries, gaps are handled by applying validated per lab and per test benchmarks and then scaling using population and diagnosed case proxies.
Data Validation & Update Cycle
Outputs are validated through stepwise checks, starting with internal consistency across volumes, pricing, and implied utilization, followed by comparisons against independent signals such as diagnostics spending direction, lab capacity expansion, and recent product approval or launch activity. If a country result shows an unusual jump, the assumption chain is reviewed and respondents are re-contacted when the variance cannot be explained by a documented event.
Before sign-off, the model is reviewed by another analyst to confirm that logic, units, and currency handling are consistent across regions. The dataset is refreshed annually, and interim updates are triggered when there are material events such as pricing shocks, major reimbursement changes, or sharp shifts in testing behavior. Right before delivery, a final pass is done so clients receive the most current view available.
Mordor Intelligence's Situ Hybridization Fluorescent Market Size Versus Other Published Estimates
Different sources often show different market sizes for FISH because they do not always count the same product boundary and they also pick different base years, price points, and currency conversion timing. The spread becomes larger when one estimate is closer to probe only revenues, while another includes the broader workflow spend.
The main gap drivers typically come from what is included around the assay workflow, how average selling prices are stepped forward across kits, probes, instruments, and service elements, and how often those prices and FX rates are refreshed to reflect the latest purchasing reality. By keeping FX conversion timing and product level ASP updates on a consistent annual refresh cycle, and then rechecking the outputs against lab utilization and installed base signals, Mordor Intelligence reduces drift that can build up in older price decks and mixed year currency treatment.
Benchmark comparison
| Source | Market Size | Gaps in Research Methodology |
|---|---|---|
| Mordor Intelligence | USD 1.30 B (2026) | |
| Global Consultancy A | USD 1.02 B (2025) | This figure appears closer to a probes focused view, which can undercount instruments and workflow software or services, and it also uses a different base year that changes the implied price level. |
| Industry Publisher B | USD 0.95 B (2024) | The lower value aligns with earlier year pricing and a probe market boundary, where test volume growth may be recognized but broader FISH workflow spend and later ASP progression are not fully captured. |
Looking across the three figures, the difference is mainly explained by scope and timing, especially whether the total FISH workflow is counted and whether prices and currency are aligned to the same year. Our approach keeps the drivers traceable to test demand, installed base, and category level pricing, which makes the final number easier to reproduce and update.


Key Questions Answered in the Report
What is the current size of the fluorescent in situ hybridization market?
The market stands at USD 1.30 billion in 2026 and is set to reach USD 1.84 billion by 2031, posting a 7.24% CAGR.
Which product category commands the largest share of the fluorescent in situ hybridization market?
Kits and reagents lead with 43.78% market share, reflecting constant consumable demand from diagnostic laboratories.
Why is Asia-Pacific the fastest growing region?
Healthcare-infrastructure investments, local probe manufacturing, and national precision-medicine initiatives drive a 9.83% CAGR across China, India, and Japan.
How are AI tools influencing the fluorescent in situ hybridization industry?
AI-augmented image analysis boosts diagnostic accuracy, lowers interpretation time, and supports automated workflows that help labs manage staffing shortages.
What factors are fueling demand for FISH assays in cell and gene-therapy manufacturing?
Regulators require rigorous genomic-stability testing before lot release, and multi-color FISH panels detect chromosomal aberrations in engineered cells, driving a 10.36% CAGR for this application.
Which end-user segment is growing fastest?
Pharmaceutical and biotech companies lead with an 10.91% CAGR as they integrate FISH into companion-diagnostic development and cell-therapy quality control.
Page last updated on:





