Circulating Tumor Cells (CTC) Market Size and Share
Market Overview
| Study Period | 2021 - 2031 |
|---|---|
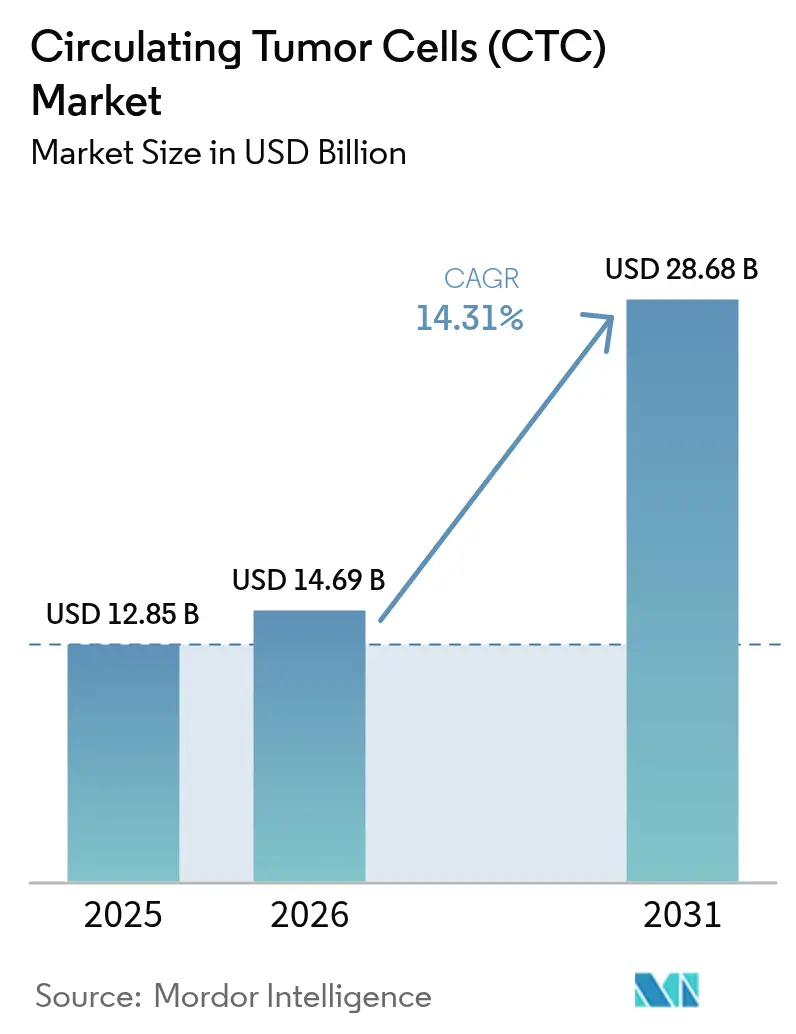
| Market Size (2026) | USD 14.69 Billion |
| Market Size (2031) | USD 28.68 Billion |
| Growth Rate (2026 - 2031) | 14.31% CAGR |
| Fastest Growing Market | Asia-Pacific |
| Largest Market | North America |
| Market Concentration | Medium |
Major Players *Disclaimer: Major Players sorted in no particular order Image © Mordor Intelligence. Reuse requires attribution under CC BY 4.0. | |
Circulating Tumor Cells (CTC) Market Analysis by Mordor Intelligence
The circulating tumor cells market size was valued at USD 12.85 billion in 2025 and estimated to grow from USD 14.69 billion in 2026 to reach USD 28.68 billion by 2031, at a CAGR of 14.31% during the forecast period (2026-2031).
Demand rises as oncologists shift from invasive tissue biopsies to real-time liquid biopsy tools that capture tumor heterogeneity, trace resistance patterns, and guide rapid therapy changes. Momentum builds around microfluidic platforms that secure higher cell-capture yields without compromising viability, while artificial-intelligence image analysis drives faster interpretation and better accuracy. Asia Pacific registers the strongest uptrend because rising cancer incidence, public screening programs, and venture capital funding shorten technology adoption cycles. Strategy leaders favor alliances with pharmaceutical sponsors so that CTC assays become embedded companion diagnostics, creating long-term reagent demand and locking in the circulating tumor cells market across hospital networks.
Key Report Takeaways
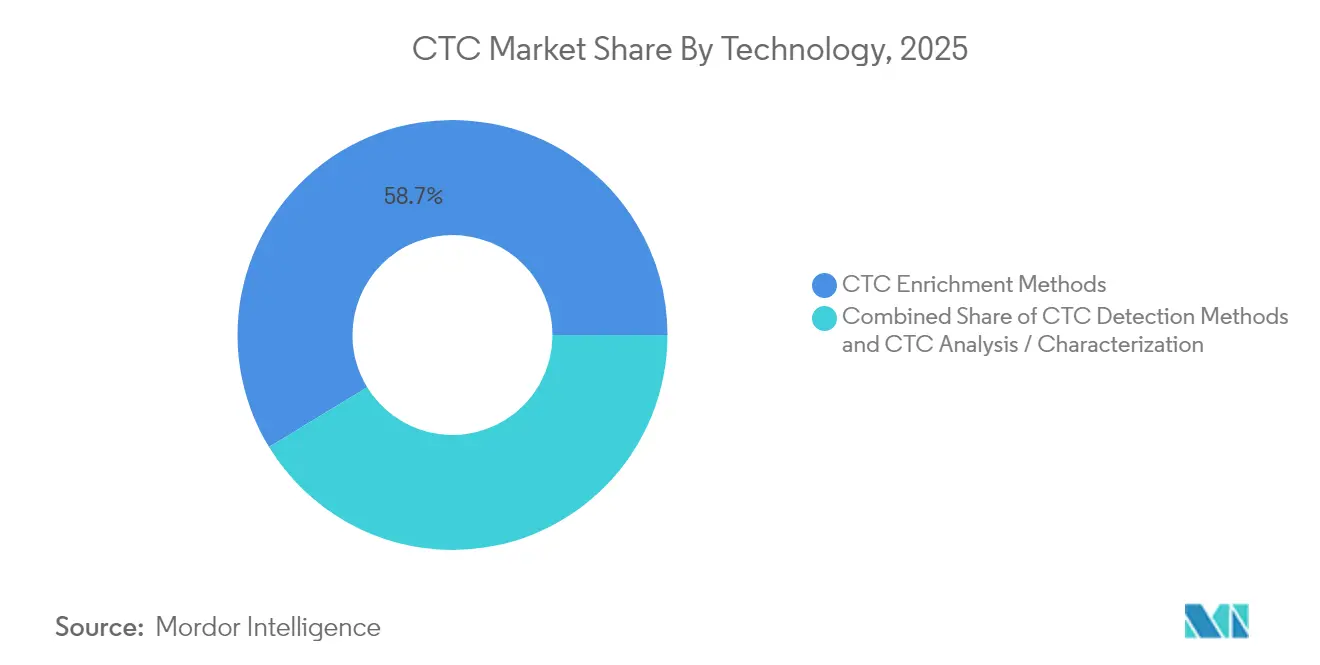
- By technology, detection and enrichment methods led with 58.73% of circulating tumor cells market share in 2025, while the analysis / characterization segment will expand at a 16.68% CAGR through 2031.
- By product category, kits and reagents commanded 62.98% of the circulating tumor cells market size in 2025; software and services post the highest 15.63% CAGR to 2031.
- By specimen, blood supplied 59.88% revenue in the circulating tumor cells market in 2025, and bone-marrow assays are projected to grow at 19.02% CAGR during 2026-2031.
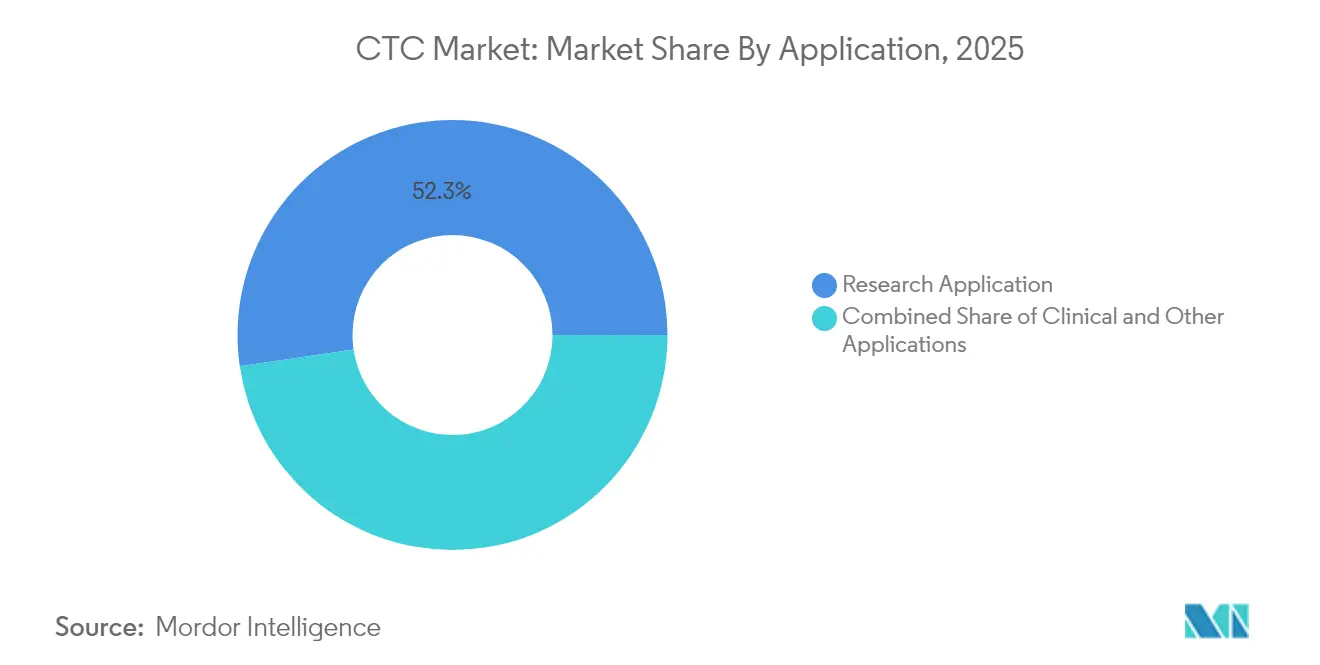
- By application, research use accounted for 52.32% circulating tumor cells market share in 2025, whereas clinical tests for therapy monitoring rise at 17.14% CAGR across the forecast period.
- By end user, hospitals and clinics held 38.64% of the circulating tumor cells market share in 2025, while biopharmaceutical companies are projected to advance at an 18.39% CAGR through 2031.
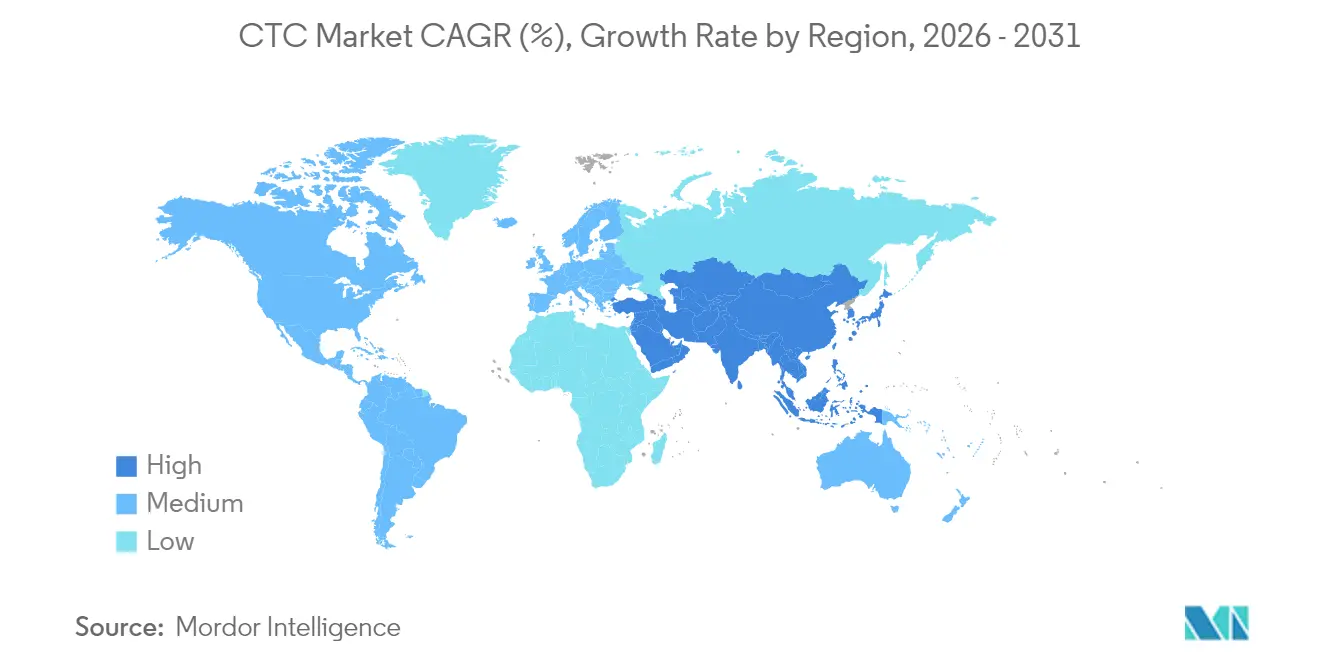
- By geography, North America retained 43.92% revenue share in 2025, while Asia Pacific is set for a 15.82% CAGR through 2031.
Note: Market size and forecast figures in this report are generated using Mordor Intelligence’s proprietary estimation framework, updated with the latest available data and insights as of 2026.
Global Circulating Tumor Cells (CTC) Market Trends and Insights
Drivers Impact Analysis*
| Driver | (~) % Impact on CAGR Forecast | Geographic Relevance | Impact Timeline |
|---|---|---|---|
| Increasing prevalence of cancer | +3.50% | Global with strong effect in Asia Pacific and North America | Medium term (2-4 years) |
| Rising demand for precision medicine and companion diagnostics | +2.80% | North America, Europe, developed Asia Pacific | Medium term (2-4 years) |
| Technological improvements in CTC isolation and detection | +2.40% | North America, Europe, China, Japan | Short term (≤ 2 years) |
| Expanding venture capital and government funding | +2.20% | North America, Europe, China | Medium term (2-4 years) |
| AI-Enabled Microfluidic Chips and Single-Cell Multi-Omics Sequencing | +1.80% | North America, Europe | Long term (≥ 4 years) |
| Source: Mordor Intelligence | |||
Increasing Prevalence of Cancer
Cancer incidence is projected to climb 76.6% and deaths 89.7% by 2050, with the burden most acute in developing regions where mortality-to-incidence ratios can be 2.5 times higher[1]Bizuayehu HM et al., “Global Disparities of Cancer and Its Projected Burden in 2050,” JAMA Network Open, jamanetworkopen.com. The United States anticipates 2.04 million new cases and 618,120 deaths in 2025[2]Rebecca L. Siegel et al., “Cancer Statistics, 2025,” CA A Cancer Journal for Clinicians, acsjournals.onlinelibrary.wiley.com. This trend fuels adoption of CTC tests that deliver early alerts and track therapeutic efficacy more quickly than periodic imaging. Hospitals and outpatient centers integrate these assays into routine follow-up schedules, boosting recurring revenues across the circulating tumor cells market.
Rising Demand for Precision Medicine and Companion Diagnostics
The FDA lists more than 60 cleared companion diagnostics, many of which incorporate liquid biopsy markers. UnitedHealthcare now reimburses CTC tests when tissue sampling is not feasible. Clinicians value intact cells because they reveal phenotypic and genotypic traits that guide therapy selection at each treatment cycle, reinforcing platform relevance in the circulating tumor cells market.
Technological Improvements in CTC Isolation and Detection
The LP CTC-iChip reaches 86.1% capture efficiency and 99.96% white-cell depletion while processing up to 5 L of blood[3]Nature Publishing Group, “Fast and Efficient Microfluidic Cell Filter for CTC Isolation,” nature.com. A triangular prism array device achieves 94.8% efficiency and four-log white-cell removal at scale. Deep-learning biolaser systems deliver 94.3% sensitivity and 99.9% specificity without antigen labels, broadening use across heterogeneous tumor types. These innovations underpin next-generation workflows and accelerate growth within the circulating tumor cells market.
Expanding Venture Capital and Government Funding
Record capital infusions in 2024 backed several CTC start-ups, driving accelerated product pipelines and regulatory submissions. Hong Kong’s RAISe+ Scheme financed a microfluidic CTC platform now deployed in more than 50 mainland hospitals[4]City University of Hong Kong, “Researchers Develop an Innovative Bio-Detection Platform for Cancer Early Screening,” cityu.edu.hk. In the United States, National Cancer Institute grants support CTC modules in the MyeloMATCH precision trial. Funding momentum gives innovators the resources to refine capture chemistry, machine-learning analytics, and cloud-based reporting, strengthening the circulating tumor cells market.
Restraints Impact Analysis*
| Restraint | (~) % Impact on CAGR Forecast | Geographic Relevance |
|---|---|---|
| High Cost of CTC Instruments and Consumables | -2.20% | Global, with highest impact in developing regions |
| Technical Complexity and Lack of Standardization | -1.80% | Global, with varying impact based on healthcare infrastructure |
| Competitive Threat from ctDNA and Other Liquid Biopsy Analytes | -1.60% | North America, Europe |
| Limited Awareness and Skilled Workforce in Emerging Markets | -1.30% | Asia Pacific, Middle East, Africa, South America |
| Source: Mordor Intelligence | ||
High Cost of CTC Instruments and Consumables
Capital investments for automated platforms range between USD 250,000 and USD 500,000 and reagent packs often exceed USD 1,000 per assay. These expenses exceed budget ceilings in many public hospitals, delaying adoption. Vendors combat sticker shock with leasing contracts and reagent-rental models, yet the economic hurdle persists and weighs on near-term uptake in the circulating tumor cells market.
Technical Complexity and Lack of Standardization
Workflows span sample draw, enrichment, enumeration, and molecular readouts, all governed by different protocols. Inconsistent standard operating procedures create inter-lab variability and complicate regulatory approvals. Training requirements remain steep and qualified personnel are scarce in many growth markets. Harmonization initiatives continue but complexity still curbs speed of adoption across the circulating tumor cells market.
*Our forecasts treat driver/restraint impacts as directional, not additive. The impact forecasts reflect baseline growth, mix effects, and variable interactions.
Segment Analysis
By Technology: Analysis/Characterization Unlocks Next-Generation Insight
Detection and enrichment systems generated 58.73% of circulating tumor cells market revenue in 2025. These platforms form the backbone of every workflow because they separate rare tumor cells from billions of blood cells. The circulating tumor cells market size for detection technologies is poised to rise steadily as microfluidic chip designs capture intact cells with higher viability. Novel laser-induced forward-transfer microfiltration reaches 88% capture with 81.3% viability, supporting single-cell sequencing studies.
The analysis/characterization segment grows the fastest at a 16.68% CAGR to 2031. Advances in single-cell multi-omics allow simultaneous DNA, RNA, and protein profiling in individual CTCs revealing drivers of resistance that tissue biopsies may overlook. AI image classifiers shorten turnaround times and reduce manual review errors, making advanced analytics accessible to community labs. Together these capabilities deepen the clinical value proposition and sustain premium pricing inside the circulating tumor cells market.


By Product: Software and Services Gain Momentum
Kits and reagents held 62.98% of circulating tumor cells market revenue in 2025 because every test requires single-use antibody cocktails, magnetic beads, and staining dyes. Manufacturers roll out reagent bundles targeting epithelial-mesenchymal transition markers which expands utility across metastatic disease.
Software and services rise the quickest at a 15.63% CAGR through 2031. Cloud platforms host secure image libraries, machine-learning models, and automated reporting dashboards. Academic groups share annotated cell images to refine algorithms which improves sensitivity in low-signal samples. Subscription analytics create fresh revenue layers and reinforce customer lock-in within the circulating tumor cells market.
By Specimen: Bone Marrow Shows High Potential
Blood specimens remain the choice for 59.88% of all tests in 2025 because phlebotomy is routine and reimbursement is established. Enhanced immunomagnetic beads and size-based filters push purity past previous benchmarks which keeps demand high.
Bone marrow provides improved sensitivity in hematologic tumors and early-stage metastasis. Its share in the circulating tumor cells market accelerates at 19.02% CAGR. Oncologists accept the more invasive aspiration when they need maximum detection power, especially during minimal residual disease surveillance. Pilot programs confirm that bone marrow CTC counts correlate with relapse risk and guide adjuvant therapy escalation.
By Application: Clinical Use Captures Share
Research projects accounted for 52.32% circulating tumor cells market share in 2025. Grants and pharma partnerships fuel study volumes across metastasis biology, biomarker discovery, and drug-response modeling. Multi-analyte liquid biopsy programs combine CTCs with ctDNA and extracellular vesicles to map tumor evolution more comprehensively.
Clinical applications post the strongest 17.14% CAGR because real-time monitoring supports faster therapy adjustments. Breast and prostate cancer studies show that a twofold rise in CTC counts after cycle one predicts shorter progression-free survival which triggers early regimen switches. Accumulating evidence feeds guideline inclusion and broadens reimbursement, extending the circulating tumor cells market into community oncology.
By End User: Biopharmaceutical Demand Surges
Hospitals and clinics led with 38.64% revenue in 2025 since comprehensive cancer centers deploy in-house platforms for treatment selection and recurrence monitoring. Expanded insurance coverage for specific indications reinforces routine ordering.
Biopharmaceutical companies expand at an 18.39% CAGR. Trial sponsors harvest CTCs for patient stratification, pharmacodynamic endpoints, and mechanism-of-action studies. The circulating tumor cells market benefits from these contracts because each enrolled subject requires serial testing that drives reagent pull-through. Partnerships between kit makers and drug developers also accelerate companion diagnostic approvals.
Geography Analysis
North America commanded 43.92% of circulating tumor cells market revenue in 2025. The region benefits from sophisticated oncology centers, robust payer frameworks, and wide research funding. The FDA continually enlarges its companion diagnostic list which inspires hospital adoption. Rising cancer incidence, projected at two million new US cases in 2025, ensures consistent test volume. Canada shows parallel trends with provincial programs piloting liquid biopsy reimbursement to offset imaging costs.
Europe ranks second. Research networks like the European Liquid Biopsy Society coordinate protocol standardization and proficiency testing across Germany, France, and the United Kingdom. These countries host public-private consortia that evaluate CTC counts alongside radiology data to refine response criteria. Eastern European health ministries modernize oncology departments and increasingly import turnkey CTC analyzers which lifts regional revenues within the circulating tumor cells market.
Asia Pacific is the fastest climber, locked on a 15.82% CAGR to 2031. China directs state and venture capital toward microfluidic manufacturing which lowers platform cost for domestic hospitals. The City University of Hong Kong microfluidics system has already spread to fifty hospitals and inspires further provincial rollouts. Japan and South Korea incorporate continuous centrifugal chips in national cancer centers, while India’s private labs invest in reagent-rental models to expand access. Government screening mandates and population size amplify growth potential across the circulating tumor cells market.
The Middle East and Africa along with South America represent emerging opportunities. Saudi Arabia and the United Arab Emirates build specialist cancer institutes equipped with CTC suites as part of national health strategies. Brazil adds liquid biopsy modules to leading oncology hospitals in São Paulo and Rio de Janeiro. International aid programs bundle compact CTC analyzers with training workshops to improve diagnostic equity and lay the foundation for longer-term expansion.

Competitive Landscape
The circulating tumor cells market is moderately concentrated. The leading vendors—Menarini Silicon Biosystems, QIAGEN, Bio-Techne, Thermo Fisher Scientific, and Precision for Medicine—dominate industry activity. QIAGEN complements the AdnaTest isolation suite with multiplex RT-PCR panels that detect actionable mutations in the same workflow, extending value for precision oncology programs. Bio-Techne bundles exosome assays with CTC cartridges to offer clinicians a multi-analyte solution. Thermo Fisher partners with the National Cancer Institute to integrate CTC modules into the MyeloMATCH precision umbrella trial which creates real-world validation data and boosts credibility. Precision for Medicine scales reference-laboratory services for pharma customers that prefer outsourced testing.
Emerging innovators introduce differentiated capture surfaces, acoustic-wave focusing chips, and nanostructured substrates that push yield and purity beyond incumbent levels. ANGLE achieved FDA clearance for the Parsortix system in metastatic breast cancer and markets the device for intact CTC harvesting suitable for downstream culture. Sysmex Inostics deploys digital PCR to profile single cells collected with microfluidic chips, building a niche in ultra-sensitive mutation tracking.
Artificial-intelligence providers now sell software add-ons that plug into existing imaging stations and cut manual review time by 60%. As capital equipment prices trend down, suppliers double down on reagent catalog expansion to preserve margins. Service contracts that combine cloud analytics, instrument maintenance, and continuous software updates help retain clients and stabilize revenue flow within the circulating tumor cells market.
Circulating Tumor Cells (CTC) Industry Leaders
Menarini Silicon Biosystems
QIAGEN
Bio-Techne
Thermo Fisher Scientific Inc.
Precision for Medicine (ApoCell)
- *Disclaimer: Major Players sorted in no particular order

Recent Industry Developments
- May 2025: Menarini Silicon Biosystems released an upgraded CellSearch platform with integrated AI image analysis that lifts sensitivity 35% and reduces processing time 40%.
- February 2025: Thermo Fisher Scientific and the National Cancer Institute expanded the MyeloMATCH umbrella trial to include comprehensive CTC profiling for myeloid cancers.
- January 2025: ANGLE reported completion of a multi-center study that confirmed broader CTC phenotype capture with the Parsortix PC1 system in metastatic breast cancer.
- November 2024: City University of Hong Kong announced commercial deployment of its microfluidic CTC platform in more than 50 mainland hospitals funded by the RAISe+ innovation scheme.
- March 2024: Bio-Rad Laboratories launched validated antibodies for rare cell enumeration on its Genesis Cell Isolation System, improving CTC staining accuracy for tumor heterogeneity studies.


Research Methodology Framework and Report Scope
Market Definitions and Key Coverage
According to Mordor Intelligence, we define the circulating tumor cells (CTC) market as the global revenue generated from instruments, consumables, and software that enrich, detect, and characterize viable tumor cells traveling through blood or lymph in clinical as well as research settings. The study tracks value in USD for products sold to hospitals, diagnostic laboratories, research institutes, and biopharma companies across 17 countries between 2020 and 2030.
Scope exclusion: Analyses limited to circulating free nucleic acids or exosomal markers fall outside this market boundary.
Segmentation Overview
- By Technology
- CTC Enrichment Methods
- Positive Enrichment
- Negative Enrichment
- Size-Based Isolation
- Density-Based Separation
- Immunomagnetic Separation
- Microfluidic Chip-Based
- Other Enrichment Methods
- CTC Detection Methods
- Immunocytochemical Technology
- Molecular (RNA)-Based Technology
- Imaging-Based Technology
- PCR-Based Technology
- SERS-Based Technology
- Other Detection Methods
- CTC Analysis/Characterization
- Single-Cell Sequencing
- Protein Expression Analysis
- Epigenetic Profiling
- CTC Enrichment Methods
- By Product
- Kits & Reagents
- Instruments and Devices
- Blood Collection Tubes
- Software and Services
- By Specimen
- Blood
- Bone Marrow
- Other Body Fluids (CSF, Urine)
- By Application
- Clinical
- Early Cancer Screening
- Prognostic and Predictive Biomarkers
- Therapy Monitoring and Minimal Residual Disease
- Research
- Drug Development and Companion Diagnostics
- Cancer Stem Cell and EMT Studies
- Other Applications
- Clinical
- By End User
- Hospitals and Clinics
- Diagnostic Laboratories
- Research and Academic Institutes
- Biopharmaceutical Companies
- By Geography
- North America
- United States
- Canada
- Mexico
- Europe
- Germany
- United Kingdom
- France
- Italy
- Spain
- Rest of Europe
- Asia-Pacific
- China
- Japan
- India
- South Korea
- Australia
- Rest of Asia-Pacific
- Middle East and Africa
- GCC
- South Africa
- Rest of Middle East and Africa
- South America
- Brazil
- Argentina
- Rest of South America
- North America
Detailed Research Methodology and Data Validation
Primary Research
We corroborated secondary findings through structured calls with oncologists, molecular pathologists, laboratory procurement leads, and liquid-biopsy researchers in North America, Europe, and major Asia-Pacific hubs. Their insights refined penetration assumptions, kit utilization rates, and realistic pricing corridors before locking our 2025 baseline.
Desk Research
Our analysts first mapped the addressable pool using public anchors such as WHO GLOBOCAN cancer incidence files, the National Cancer Institute SEER portal, U.S. FDA 510(k) device clearances, European CE-mark databases, and peer-reviewed papers indexed on PubMed. Pricing and shipment clues came from customs data on Volza, patent trends on Questel, and company financials via D&B Hoovers, which clarified average selling prices and emerging technology footprints.
We then layered in investor presentations, 10-K filings, clinical-trial registries, and reputable oncology press to sense-check regulatory momentum and pipeline adoption signals. This list is illustrative; numerous additional open and paid sources informed data collection, validation, and research clarification.
Market-Sizing & Forecasting
A top-down reconstruction ties national cancer incidence, eligible staging ratios, and liquid-biopsy adoption rates to estimate demand. We then balance that total against selective bottom-up checks, sampled kit volumes multiplied by blended ASPs from leading suppliers, to fine-tune totals. Key model variables include new solid-tumor cases, average tests per patient, reagent price erosion, instrument replacement cycles, and reimbursement changes. Multivariate regression, supported by historical install growth and funding trends, underpins the forecast, while scenario analysis captures breakthrough therapy impacts. Data gaps in supplier roll-ups are bridged through regional channel interviews and expert-vetted assumptions.
Data Validation & Update Cycle
Outputs pass variance checks against independent shipment statistics, and any anomaly triggers analyst re-contact. Reports refresh each year, and interim revisions follow whenever regulatory approvals or material M&A events shift baselines. A final spot audit precedes delivery so clients receive the most current view.
Why Mordor's Circulating Tumor Cells (CTC) Market Baseline Commands Reliability
Published estimates often diverge because firms select different technology scopes, pricing references, and refresh cadences, yet decision-makers still need one dependable starting point.
Major gaps appear when models ignore microfluidic or epitope-independent platforms, apply flat ASP mark-ups, or extrapolate pre-COVID growth curves without new funding data. This is where Mordor Intelligence differentiates, because our analysts embed live oncology funding signals and cross-geography liquid-biopsy adoption metrics.
Benchmark comparison
| Market Size | Anonymized source | Primary gap driver |
|---|---|---|
| USD 12.85 B (2025) | Mordor Intelligence | |
| USD 12.62 B (2024) | Global Consultancy A | Narrower technology set and one-year older baseline |
| USD 12.99 B (2024) | Industry Research B | Excludes several Asia-Pacific markets and interpolates growth from limited trials |
The comparison shows that once scope and timing are normalized, figures converge, underscoring how our disciplined, source-rich approach provides executives with a balanced, transparent baseline ready for strategic use.


Key Questions Answered in the Report
What is the circulating tumor cells market worth today and how fast is it growing?
It stands at USD 14.69 billion in 2026 and is expected to reach USD 28.68 billion by 2031, reflecting a 14.31% CAGR.
Which technology segment is rising fastest within the circulating tumor cells market?
The analysis / characterization segment grows at 16.68% CAGR due to advances in single-cell multi-omics and AI-driven analytics.
Why are bone-marrow CTC tests gaining attention?
Bone marrow yields higher tumor-cell concentrations, improving sensitivity for early-stage or minimal residual disease monitoring and driving a 19.02% CAGR.
How do CTC tests support precision oncology?
They deliver real-time, intact cell data that reveal tumor heterogeneity and resistance mechanisms, enabling rapid therapy adjustments.
What remains the main barrier to wider CTC adoption?
High platform and consumable costs paired with complex workflows limit access in resource-constrained settings, though leasing and automation aim to narrow this gap.
Page last updated on:


