
Induced Pluripotent Stem Cells Market Size and Share
Market Overview
| Study Period | 2020 - 2031 |
|---|---|
| Market Size (2026) | USD 2.59 Billion |
| Market Size (2031) | USD 4.14 Billion |
| Growth Rate (2026 - 2031) | 9.83 % |
| Fastest Growing Market | Asia-Pacific |
| Largest Market | North America |
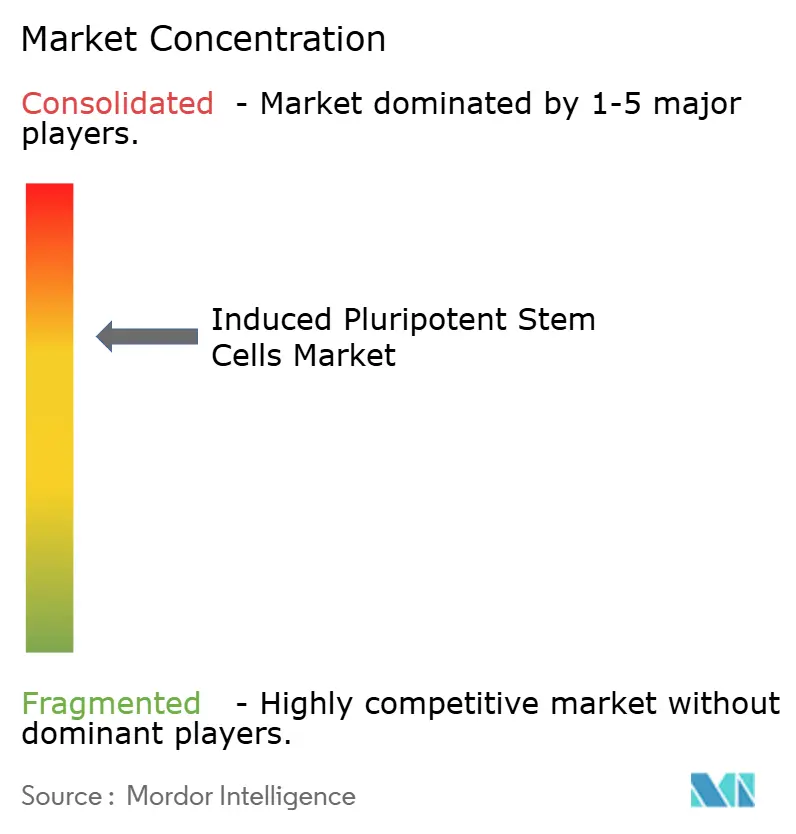
| Market Concentration | Medium |
Major Players *Disclaimer: Major Players sorted in no particular order Image © Mordor Intelligence. Reuse requires attribution under CC BY 4.0. | |
Induced Pluripotent Stem Cells Market Analysis by Mordor Intelligence
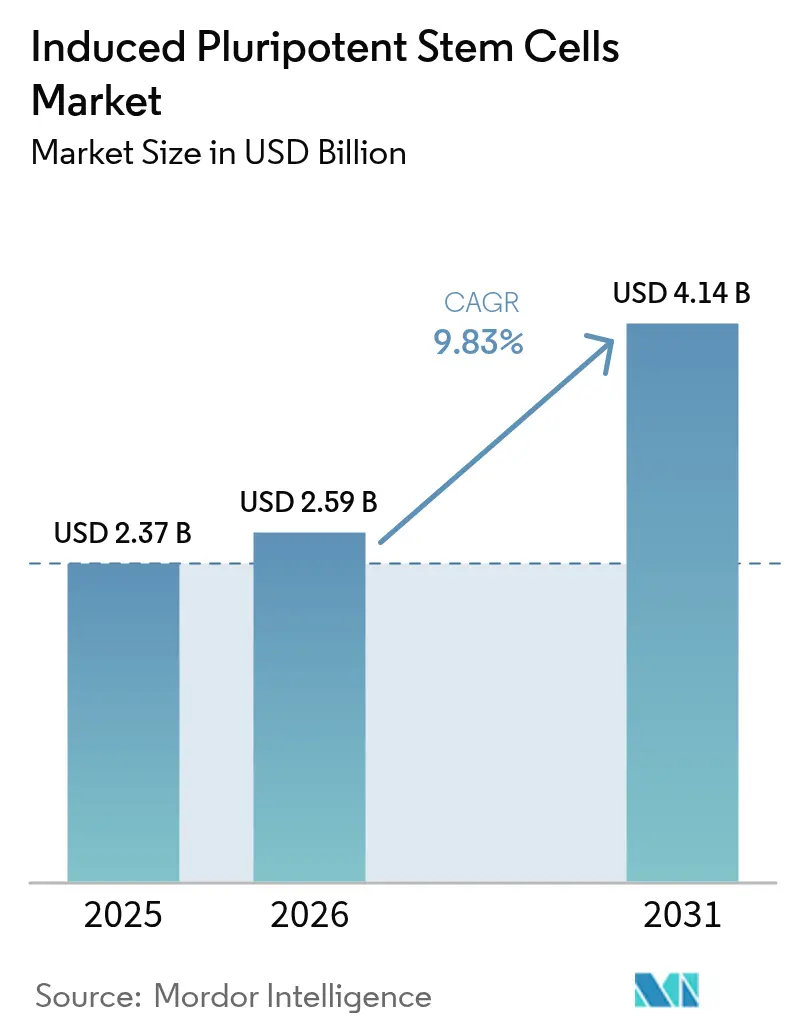
The Induced Pluripotent Stem Cells Market size is projected to expand from USD 2.37 billion in 2025 and USD 2.59 billion in 2026 to USD 4.14 billion by 2031, registering a CAGR of 9.83% between 2026 to 2031.
Consistent adoption of iPSC-enabled cardiotoxicity screens, robust Phase II-ready cell-therapy pipelines, and concerted public funding across the United States, Japan, and the European Union are driving double-digit growth in the induced pluripotent stem cells market. Pharmaceutical and biotechnology companies already command 58.46% of 2025 revenue as they pivot toward patient-specific toxicity models that lower late-stage attrition by as much as 30 percentage points. Rapid automation with closed-system bioreactors is compressing per-batch costs from USD 50,000 to USD 15,000 and widening access for mid-sized sponsors. Meanwhile, regulatory fast tracks in Japan and China shorten commercial timelines for iPSC-derived therapies, encouraging cross-border licensing deals that reinforce momentum in the induced pluripotent stem cells market.
Key Report Takeaways
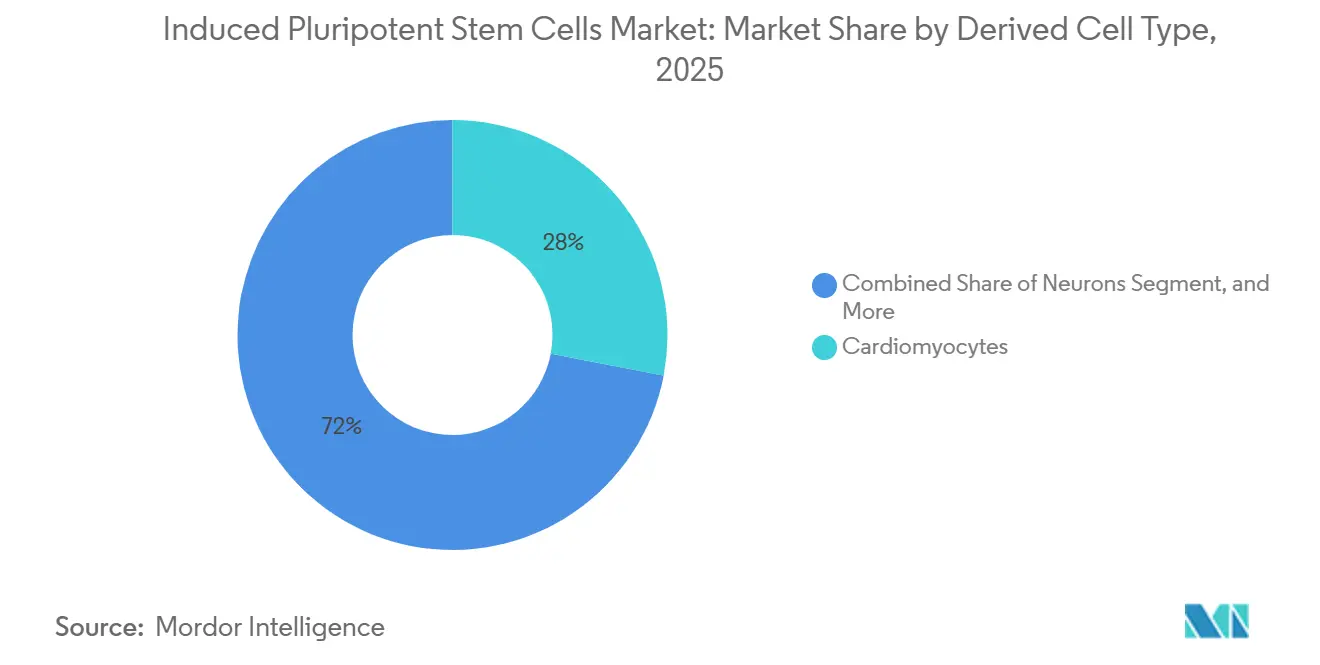
- By derived cell type, cardiomyocytes led with 28.02% revenue share in 2025, while neurons are projected to register a 10.06% CAGR through 2031.
- By application, drug discovery and development accounted for 39.67% of 2025 revenue; regenerative medicine is forecast to grow at an 11.63% CAGR through 2031.
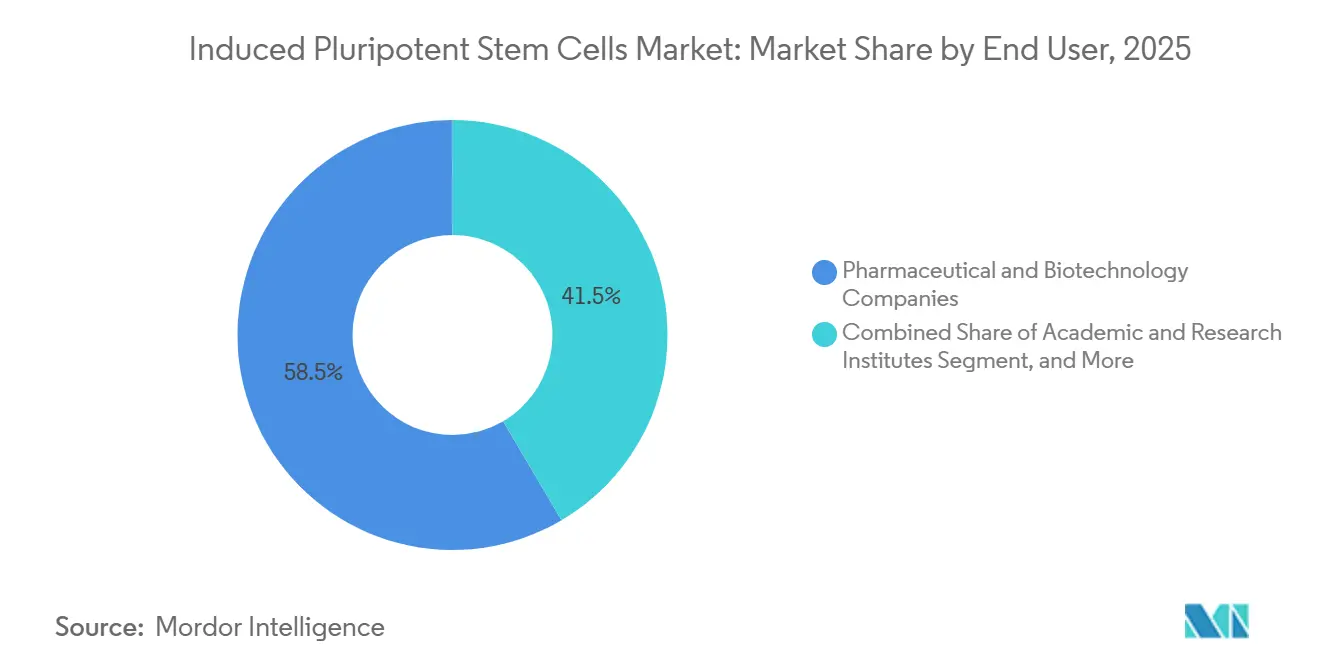
- By end user, pharmaceutical and biotechnology companies held 58.46% of the induced pluripotent stem cells market share in 2025, whereas academic and research institutes are expanding at a 12.18% CAGR over 2026-2031.
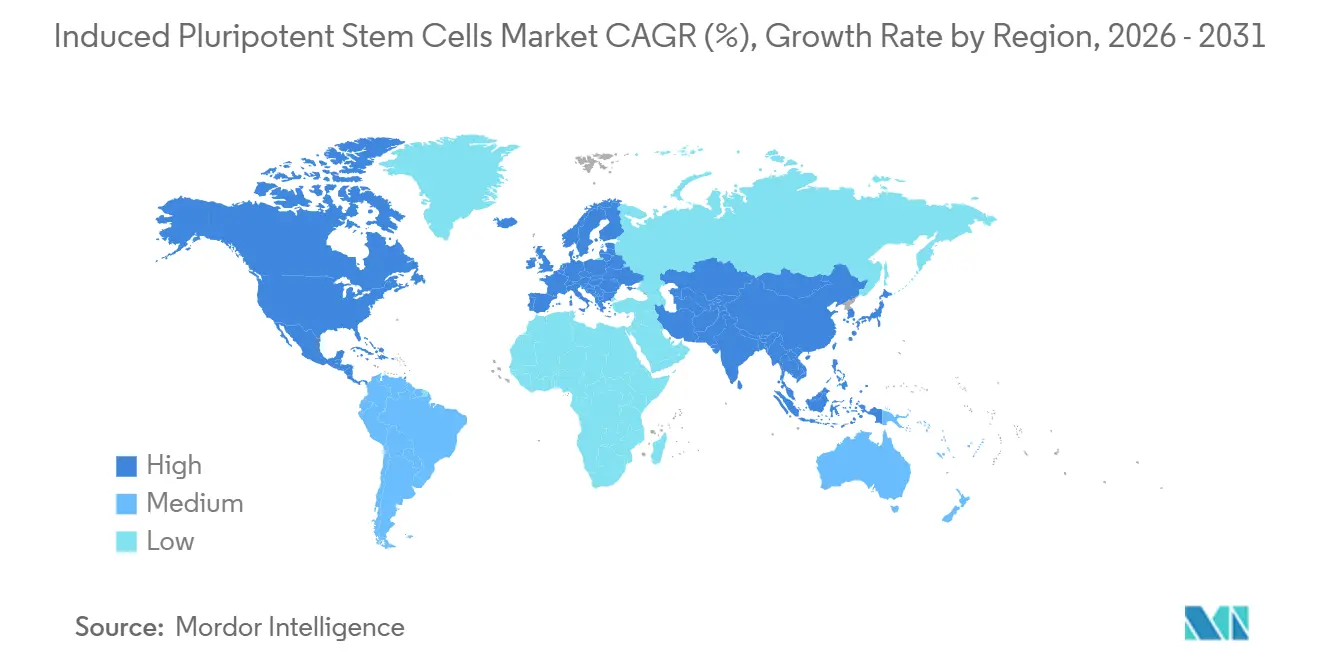
- By geography, North America dominated with a 38.91% share in 2025, yet Asia-Pacific is pacing the field with an 11.67% CAGR through 2031.
Note: Market size and forecast figures in this report are generated using Mordor Intelligence’s proprietary estimation framework, updated with the latest available data and insights as of 2026.
Market Trends and Insights
Drivers Impact Analysis of Induced Pluripotent Stem Cells Market*
| Driver | (~) % Impact on CAGR Forecast | Geographic Relevance | Impact Timeline |
|---|---|---|---|
| Surge in iPSC-enabled drug discovery and toxicity testing demand | +2.1% | North America, Europe | Medium term (2-4 years) |
| Expanding clinical pipeline of iPSC-derived cell therapies | +1.8% | Japan, North America, Europe | Long term (≥ 4 years) |
| Robust public and private funding across U.S., EU, and Japan | +1.5% | North America, Europe, Japan | Short term (≤ 2 years) |
| Advances in non-integrating reprogramming and CRISPR editing | +1.3% | Global, led by North America and Asia-Pacific | Medium term (2-4 years) |
| Adoption of closed-system automated GMP bioreactors | +1.2% | North America, Europe, Asia-Pacific | Short term (≤ 2 years) |
| Emerging industrial uses (cultured meat, iPSC-platelets) | +0.9% | Israel, Japan, Singapore | Long term (≥ 4 years) |
| Source: Mordor Intelligence | |||
Surge in iPSC-Enabled Drug Discovery and Toxicity Testing Demand
Pharmaceutical sponsors are switching from animal models to iPSC-derived cardiomyocytes and hepatocytes that flag human-specific toxicities, cutting Phase II failure rates by up to 35 percentage points.[1]U.S. Food and Drug Administration, “Cellular and Gene Therapy Products,” fda.gov FUJIFILM Cellular Dynamics showed that iCell hepatocytes detected hidden liver liabilities in eight compounds that had cleared rodent screens, leading FDA reviewers to accept iPSC data in investigational new drug files in 2024. Takeda integrated these assays into 40% of its early pipeline by 2025, trimming preclinical timelines by six months and saving roughly USD 30 million per asset. Contract research organizations such as Charles River and Eurofins now charge USD 4,500 per compound for full iPSC toxicity panels, less than half the 2023 rate, broadening adoption among small biotechs. Growing regulatory acceptance under the U.S. 21st Century Cures Act and the EU’s 3Rs principles further institutionalizes the practice.
Expanding Clinical Pipeline of iPSC-Derived Cell Therapies
Seventeen iPSC-based therapeutics were in Phase I or II worldwide by mid-2025, led by BlueRock Therapeutics’ bemdaneprocel for Parkinson’s disease, which delivered a 40% improvement on the Unified Parkinson’s Disease Rating Scale at twelve months. Heartseed’s HS-001 cardiac patch posted a 15% rise in left ventricular ejection fraction without serious adverse events, advancing toward Japan’s conditional approval pathway that can cut three years from a typical launch schedule.[2]Heartseed, “HS-001 Interim Results,” heartseed.jp Fate Therapeutics’ FT596 off-the-shelf CAR-NK cells achieved 60% complete responses in B-cell lymphoma, outperforming autologous CAR-T benchmarks by 15 points. Century Therapeutics secured FDA clearance for CNTY-101 gamma-delta T cells for solid tumors, expanding the addressable oncology base. Collectively, these milestones sustain investor confidence in the induced pluripotent stem cells market.
Robust Public and Private Funding Across U.S., EU, and Japan
The U.S. National Institutes of Health raised its iPSC allocation to USD 450 million for fiscal 2025, targeting Alzheimer’s and diabetes programs. California’s CIRM added USD 310 million that same year, backing twelve clinical studies spanning spinal cord injury to retinal degeneration. Europe’s Horizon Europe committed EUR 280 million (USD 305 million) to multicenter consortia led by Fraunhofer and Institut Pasteur.[3]European Medicines Agency, “3Rs Initiative,” ema.europa.eu Japan’s budget rose to JPY 85 billion (USD 580 million) in 2025 to expand the national HLA-matched iPSC bank now covering 90% of the population. Venture investors added USD 1.8 billion during 2024-2025, underscoring durable capital flows into the induced pluripotent stem cells market.
Advances in Non-Integrating Reprogramming and CRISPR Editing
Sendai virus, episomal vectors, and synthetic mRNA now deliver reprogramming efficiencies above 80% while slashing insertional mutagenesis risks to below 5%. Thermo Fisher’s CytoTune 2.0 kit halves turnaround time to fourteen days and is used by 60% of academic labs worldwide. In 2024, Axol Bioscience supplied 50 isogenic iPSC lines carrying defined pathogenic variants to Vertex and CRISPR Therapeutics for precision target validation. Prime editing studies in 2025 corrected Duchenne muscular dystrophy mutations with 95% on-target accuracy and no detectable off-targets. Takara Bio’s GeneArt service now delivers custom knockouts in 4 weeks at USD 8,000 per line, a 2/3 cost reduction versus 2023.
Restraints Impact Analysis of Induced Pluripotent Stem Cells Market*
| Restraint | (~) % Impact on CAGR Forecast | Geographic Relevance | Impact Timeline |
|---|---|---|---|
| High cost and process complexity for large-scale GMP production | -1.8% | Global, acute in emerging markets | Medium term (2-4 years) |
| Fragmented global regulatory and standardization requirements | -1.2% | Global, with divergence between FDA, EMA, PMDA | Long term (≥ 4 years) |
| Genetic instability and tumorigenicity safety concerns | -1.0% | Global, with stringent oversight in North America and Europe | Medium term (2-4 years) |
| Concentrated patent ownership driving royalty pressure | -0.7% | Global, particularly affecting small biotechs and academic spin-outs | Long term (≥ 4 years) |
| Source: Mordor Intelligence | |||
High Cost and Process Complexity for Large-Scale GMP Production
ISO 13485 facilities, 30-day differentiation runs, and whole-genome release testing push batch costs to as high as USD 150,000, pricing many academic spin-outs out of the market. Media costs often exceed USD 2,000 per liter, and yield variability can reach 50%, hampering the reliable cost of goods. CDMOs charge up to USD 5 million for Phase I clinical material, a hurdle for seed-stage ventures. Cryopreservation losses of 30% force manufacturers to oversize production runs, inflating inventory overhead. Although automation cuts labor by 80%, setting up a 500-liter GMP suite still requires more than USD 10 million in capital, delaying scale-out in the induced pluripotent stem cells market.
Fragmented Global Regulatory and Standardization Requirements
FDA demands whole-genome sequencing, 12-month biodistribution, and tumorigenicity assays, extending development timelines by up to two years and adding USD 10 million in extra studies. EMA rules vary by member state; Germany mandates functional testing across three animal models, whereas France accepts in vitro surrogates, complicating multicountry trial logistics. Japan’s conditional pathway allows earlier launch but restricts prescribing to designated hospitals and requires decade-long surveillance, limiting first-wave volumes. China’s NMPA insists on domestic manufacture, forcing foreign sponsors to duplicate GMP capacity at up to USD 50 million per site. Consensus on potency assays is at least three years away despite ISSCR and ISO efforts, prolonging uncertainty within the induced pluripotent stem cells market.
*Our forecasts treat driver/restraint impacts as directional, not additive. The impact forecasts reflect baseline growth, mix effects, and variable interactions.
Induced Pluripotent Stem Cells Market Segment Analysis
By Derived Cell Type:
Cardiomyocytes Sustain Leadership While Neurons Gain MomentumCardiomyocytes accounted for 28.02% of the induced pluripotent stem cells market share in 2025, supported by pharmaceutical use in cardiotoxicity screening and by regenerative medicine trials such as Heartseed’s HS-001 patch. Parallel progress in ventricular-patch trials could open therapeutic revenue streams as early as 2027.
Neurons remain the fastest-growing sub-segment at a forecast 10.06% CAGR. Pharmaceutical interest in Parkinson’s and ALS models, combined with academic consortia scaling patient-derived lines, underpins sustained demand. BlueRock’s Phase II data and Axol’s 50-line isogenic panel validate commercial potential beyond research reagents. Growing neurodegenerative disease burden reinforces the long-run contribution of neurons to the induced pluripotent stem cells market.



By Application:
Drug Discovery Dominates as Regenerative Medicine AcceleratesDrug discovery and development commanded 39.67% revenue in 2025, driven by broad adoption of iPSC toxicity panels across large pharma portfolios. The induced pluripotent stem cells market size for drug discovery is projected to reach USD 1.8 billion by 2031. Falling assay prices and regulatory alignment keep barriers low for emerging biotechs.
Regenerative medicine logs the highest growth at an 11.63% CAGR to 2031, catalyzed by multiple Phase II cell therapies and Japan’s early commercialization pathway. Heartseed’s cardiac patch and Fate’s CAR-NK will be first movers, but mesenchymal products and iPSC-platelets are close behind. The rising tide extends to tissue-engineering constructs, which broaden clinical categories and enlarge the induced pluripotent stem cells market.
By End User:
Pharma Retains Primacy While Academia ScalesPharmaceutical and biotechnology companies accounted for 58.46% of 2025 revenue, purchasing bulk iPSC-derived cells for both screening and clinical applications. However, academic and research institutes are posting the fastest growth, with a 12.18% CAGR, as universities deploy automated bioreactors that trim per-batch costs by 70%. This democratization diversifies demand sources and stabilizes long-term unit volumes within the induced pluripotent stem cells market.
The contract research organizations segment's growth is driven by bundling iPSC assays with legacy in-vivo services, giving small sponsors a turnkey path to regulatory-grade data. Hospitals in Japan form an emerging purchaser class under PMDA’s conditional rules, illustrating how policy design can reshape downstream demand.
Geography Analysis
North America Induced Pluripotent Stem Cells Market
North America contributed 38.91% of 2025 turnover, reflecting FDA clarity, NIH and CIRM grant programs, and a dense venture-capital ecosystem. Canada’s STEMCELL Technologies supplies culture media to 70% of academic users worldwide, reinforcing the region’s critical input position. Mexico’s new Lonza facility signals movement of contract manufacturing into cost-advantaged locales.
APAC Induced Pluripotent Stem Cells Market
Asia-Pacific is projected to grow at 11.67% CAGR through 2031, the fastest among all regions. Japan’s conditional approval pathway shortens launch timelines by up to five years, drawing global companies to partner or relocate trials. China’s USD 1.2 billion provincial funds and WuXi bioreactor build-out create the largest single new manufacturing corridor for the induced pluripotent stem cells market. India, South Korea, and Australia collectively add momentum through coordinated government grants and translational trials.
EMEA and South America Induced Pluripotent Stem Cells Market
Germany, France, and the United Kingdom dominate clinical trial counts, while harmonized MHRA guidance in 2024 streamlined cross-border submissions. Israel and Brazil spearhead Middle East & Africa and South America adoption respectively, lifting those combined regions to an 8% contribution and illustrating global diffusion of the induced pluripotent stem cells market.

Regulatory Landscape
Induced pluripotent stem cell (iPSC)-derived therapeutic products generally fall under existing biologics and advanced-therapy frameworks, and regulators place a strong focus on CMC control, genomic stability, and tumorigenicity risk management. In the European Union, iPSC-derived therapies are typically regulated as Advanced Therapy Medicinal Products (ATMPs) under Regulation (EC) No 1394/2007, with scientific oversight from the European Medicines Agency (EMA) Committee for Advanced Therapies (CAT). In February 2026, the CAT adopted a classification confirming that allogeneic hiPSC-derived midbrain dopaminergic neuronal progenitor cells meet the definition of a tissue engineered product, reinforcing the need for early classification alignment in EU development plans.
Regulatory expectations are also tightening through updated guidance and standards that formalize quality systems and traceability for cell substrates and derived cell products. EMA updated its clinical-trial expectations through its Guideline on quality, non-clinical and clinical requirements for investigational ATMPs (effective 1 July 2025), while ISO expanded pluripotent-cell related standards in 2024-2026, including ISO 18162:2024 for biobanking of human neural stem cells derived from pluripotent stem cells and ISO 20012:2026 addressing biobanking requirements for human NK cells derived from pluripotent stem cells. These requirements raise the compliance burden for global programs that must reconcile FDA, EMA, and PMDA expectations while building robust comparability, identity, and contamination-control strategies as manufacturing scales.
Competitive Landscape
Vertical integration enables FUJIFILM to deliver 10 billion cardiomyocytes per quarter, while Thermo Fisher and Lonza lock institutions into long-term reagent-plus-automation contracts. Patent royalties on foundational reprogramming IP, largely owned by Kyoto University and CIRM, impose 8-12% revenue tolls on downstream product developers, reinforcing incumbent advantage.
Fate Therapeutics and Century Therapeutics illustrate emerging competition in immune-cell therapies that bypass the cost and time hurdles of autologous CAR-Ts. Hitachi’s AI-optimized bioreactor is a technological challenger that could erode Lonza’s dominance in Asia. Cellino Biotech’s laser-enabled single-cell cloning targets genetic drift issues that constrain scalability, signalling ongoing innovation pressure in the induced pluripotent stem cells industry.
Cultured-meat entrants, platelet suppliers, and industrial platelets diversify the buyer set, attracting non-pharma capital and lowering reliance on therapeutic applications alone. This widening user base underpins durable volume expansion even as clinical timelines fluctuate, securing the long-run relevance of the induced pluripotent stem cells market.
Induced Pluripotent Stem Cells Industry Leaders
Axol Bioscience Ltd.
Evotec SE
FUJIFILM Cellular Dynamics, Inc.
Ncardia BV
Cynata Therapeutics Ltd.
- *Disclaimer: Major Players sorted in no particular order
Induced Pluripotent Stem Cells Market Companies Covered in this Report
- Applied StemCell Inc.
- Axol Bioscience
- BlueRock Therapeutics
- Cellino Biotech
- Century Therapeutics Inc.
- Cynata Therapeutics Ltd.
- Evotec
- Fate Therapeutics Inc.
- FUJIFILM Cellular Dynamics Inc.
- Hitachi
- Lonza Group
- Merck
- Ncardia BV
- Pluristyx Inc.
- REPROCELL Inc.
- Stem Cell Technologies
- Takara Bio
- Thermo Fisher Scientific
- Ushio Inc.

Market Opportunities and Future Outlook
The market is creating near-term whitespace in GMP-grade iPSC infrastructure and standardized cell banking as developers move from research-grade reagents to clinical starting materials that satisfy evolving CMC expectations. In May 2026, FUJIFILM Cellular Dynamics inaugurated a new 175,000-square-foot headquarters and iPSC manufacturing facility in Madison, Wisconsin, as part of a USD 200 million investment to quadruple capacity for research and clinical products. This capacity buildout targets scale constraints and supply reliability. Complementing this, REPROCELL launched an integrated GMP Master Cell Bank (MCB) manufacturing service in March 2026 at its U.S. facility, bundling donor screening, RNA reprogramming, and clinical gene-editing workflows to reduce handoffs across vendors and accelerate bank creation for sponsors that do not operate their own GMP suites.
Regulatory modernization is also supporting opportunity for suppliers that package phase-appropriate controls, traceability, and testing into repeatable workflows across geographies. In 2026, the FDA issued guidance updates relevant to iPSC-derived and genome-edited products, including an April 2026 draft on safety assessment of genome editing using next-generation sequencing and a May 2026 final guidance on CMC flexibilities for cellular and gene therapy products approaching BLA. This is increasing demand for validated analytical methods, documentation systems, and manufacturing comparability strategies. In Japan, contract-manufacturing demand is being pulled by programs that combine earlier clinical deployment pathways with hospital-centric delivery models; for example, Teijin Regenet finalized a consignment agreement with iPS Portal in March 2026 to manufacture autologous iPS cells, creating a commercialization-adjacent workload for qualified manufacturers and testing networks.
Recent Industry Developments in Induced Pluripotent Stem Cells Market
- July 2026: Axol Bioscience opened a new U.S. distribution hub to shorten delivery timelines and improve service for North American customers. The opening strengthens Axol’s operational footprint in the largest iPSC end-user region and supports faster replenishment cycles for iPSC-derived cell models used in screening and disease modeling.
- May 2026: FUJIFILM Cellular Dynamics opened a new 175,000-square-foot headquarters and iPSC manufacturing facility in Madison, Wisconsin, tied to a USD 200 million investment aimed at quadrupling capacity for research and clinical products. Expanded domestic capacity helps de-risk supply for programs that need consistent lots, documentation, and scale-up options as they transition from discovery to clinical manufacturing.
- September 2024: Evotec SE entered a technology development partnership with Novo Nordisk to support next-generation iPSC-based cell therapies, including workstreams connected to clinical and commercial manufacturing needs. The collaboration highlights how platform partnerships that combine iPSC differentiation know-how with industrialization capabilities shape therapy development into scalable production.


Induced Pluripotent Stem Cells Market Report Scope and Research Methodology
Market Definition and Coverage
For this study, the induced pluripotent stem cells (iPSC) market covers the value generated from iPSC cell lines and derived cells, reprogramming tools, supporting reagents, and related services that enable reprogramming, expansion, and differentiation for research, screening, and therapeutic development.
Scope exclusions: We exclude embryonic, adult, and hematopoietic stem cell offerings that do not involve an iPSC reprogramming step.
Segments Covered in This Report
- By Derived Cell Type
- Cardiomyocytes
- Neurons
- Hepatocytes
- Fibroblasts
- Keratinocytes
- Other Cell Types
- By Application
- Drug Discovery and Development
- Disease Modeling
- Toxicity Testing
- Regenerative Medicine
- Cell Therapy
- Tissue Engineering
- Other Applications
- By End User
- Academic and Research Institutes
- Pharmaceutical and Biotechnology Companies
- Contract Research Organizations
- Hospitals and Specialty Clinics
- Other End Users
- By Geography
- North America
- United States
- Canada
- Mexico
- Europe
- Germany
- United Kingdom
- France
- Italy
- Spain
- Rest of Europe
- Asia-Pacific
- China
- Japan
- India
- Australia
- South Korea
- Rest of Asia-Pacific
- Middle East & Africa
- GCC
- South Africa
- Rest of Middle East & Africa
- South America
- Brazil
- Argentina
- Rest of South America
- North America
Data Sources, Market Sizing, and Validation
Desk Research
Desk research was used to map the market boundary and to anchor demand drivers that influence iPSC spending year to year. We referenced public sources such as the NIH RePORTER funding database, ClinicalTrials.gov, FDA and EMA therapy guidance pages, and WHO and OECD health and R&D statistics to understand pipeline intensity and country level research capacity.
To translate activity into spending, we also reviewed peer reviewed papers on iPSC differentiation yields and assay adoption, along with company annual reports, investor presentations, press releases, and university technology transfer updates that often describe platform expansion and manufacturing readiness. In parallel, we used paid subscriptions for company financials and intelligence, news and financials, and patent databases to spot capacity additions, platform licensing signals, and filings tied to reprogramming methods that can shift pricing and product mix. These desk sources are illustrative rather than exhaustive, and many other references were used for data collection, cross checks, and clarification during the analysis.
Primary Interviews and Surveys
Primary work focused on interviews and structured surveys with iPSC suppliers, CDMOs, lab managers, and end users in pharma, biotech, and academic settings to confirm what is purchased directly versus what is bundled into service contracts. We also used the discussions to test regional demand patterns across North America, Europe, Asia-Pacific, and the rest of the world, and to convert pipeline signals into practical adoption and pricing assumptions.
Distribution of primary research fieldwork respondents
| Company type | Respondent position | Region |
|---|---|---|
| Top tier: 34% | CXOs: 15% | APAC: 44% |
| Mid tier: 50% | Functional/Unit leaders: 37% | EMEA: 36% |
| Smaller Players: 16% | Managers: 48% | Americas: 20% |
Market-Sizing & Forecasting
Sizing starts with a top-down build where research intensity and clinical pipeline activity are converted into an addressable spending pool by region, then split into iPSC relevant workflows. In practice, we reconstruct demand for iPSC lines, derived cells, and enabling tools from funding flows, trial counts, and lab capacity indicators, then adjust using the observed share of iPSC work within broader stem cell and cell therapy activities.
To keep totals grounded, we corroborated the outputs with selective bottom-up checks, such as rolling up a sample of supplier revenues where disclosure exists, and validating implied volumes using average selling price ranges for iPSC lines, differentiation kits, and fee based manufacturing services. A few variables that matter most in this market include iPSC adoption in drug discovery and disease modeling programs, growth in regenerative medicine and cell therapy pipelines, the shift toward standardized derived cell types (such as cardiomyocytes and neurons), contract manufacturing utilization for GMP grade work, and the rate of automation in academic and pharma labs that changes throughput and reorder frequency.
For forecasting, we used scenario analysis, because the market responds to policy signals, trial progression speed, and quality and traceability expectations that can accelerate or delay purchasing. Where primary feedback showed limited volume visibility, we used conservative range based assumptions and then rechecked them against procurement patterns and published activity indicators before finalizing the forecast path.
Data Validation & Update Cycle
Validation is done through triangulation across model outputs, interview feedback, and independent signals like trial starts, funding trends, and capacity announcements, so no single input dominates the final number. Outliers are reviewed in a separate pass, and if a region or application shows an unusual jump, we recheck the underlying drivers and, when needed, recontact sources to confirm whether the change is real or timing related.
Before sign-off, a second analyst review is completed to confirm that assumptions, currency conversions, and year mapping are consistent throughout the model. Reports are refreshed annually, and interim updates are made when material events occur (for example, policy changes, major capacity expansions, or visible price resets). Right before delivery, we run a final check so clients receive the most current view available at that time.
Mordor Intelligence's Induced Pluripotent Stem Cells Market Size Versus Other Published Estimates
Published market sizes for iPSC can vary more than expected because different studies pick different cutoffs for what counts as iPSC revenue, and they update pricing and exchange rates on different schedules. Some publishers lock assumptions early, while others revise them closer to release, which changes the reported current year value even if the long term story looks similar.
The spread usually comes from practical choices, such as whether derived cell products are counted separately from tools, how bundled service contracts are allocated between iPSC and adjacent lab services, and whether the model uses stable or fast changing average selling prices for kits and custom differentiation. Quarterly currency timing and the treatment of GMP grade manufacturing fees also matter, and a late refresh of these inputs can shift totals. In that context, the validation cadence and currency cut date used by Mordor Intelligence are reflected in how the estimate aligns with observed demand signals.
Benchmark comparison
| Source | Market Size | Gaps in Research Methodology |
|---|---|---|
| Mordor Intelligence | USD 2.37 B (2025) | |
| Global Consultancy A | USD 1.80 B (2024) | Uses an earlier base year and appears to exclude parts of Asia-Pacific service revenue, which can understate the paid work tied to differentiation and GMP readiness. |
| Industry Publication B | USD 1.93 B (2024) | Likely folds adjacent cell model and organoid revenues into iPSC activity unevenly, and relies on simplified pricing that does not fully reflect custom project mix and contract scope. |
Looking across the table, the biggest differences are explained by timing and boundary decisions, not by a disagreement that iPSC adoption is expanding. When scope is kept strictly to iPSC linked products and services and pricing is updated in line with recent purchasing behavior, the resulting market size becomes easier to trace back to clear inputs and repeatable checks.


Key Questions Answered in the Report
How fast is the induced pluripotent stem cells market expected to grow through 2031?
The market is projected to advance at a 9.83% CAGR between 2026 and 2031, climbing from USD 2.59 billion in 2026 to USD 4.14 billion by 2031.
Which region will record the highest growth?
Asia-Pacific is forecast to post an 11.67% CAGR through 2031 because of Japan’s accelerated regulatory path and China’s USD 1.2 billion provincial funding.
What segment currently dominates revenue?
Drug discovery and development holds 39.67% of 2025 revenue as pharmaceutical firms rely on iPSC assays to de-risk compounds early.
Which derived cell type is growing the fastest?
Neurons are projected to expand at a 10.06% CAGR as Parkinson’s and ALS programs scale.
What is the main cost barrier cited by developers?
GMP production remains capital-intensive; media and release testing push batch costs up to USD 150,000, hindering small sponsors.
Page last updated on:


 Your data is secure and never sold or shared.


