Stem Cell Manufacturing Market Size and Share
Market Overview
| Study Period | 2020 - 2031 |
|---|---|
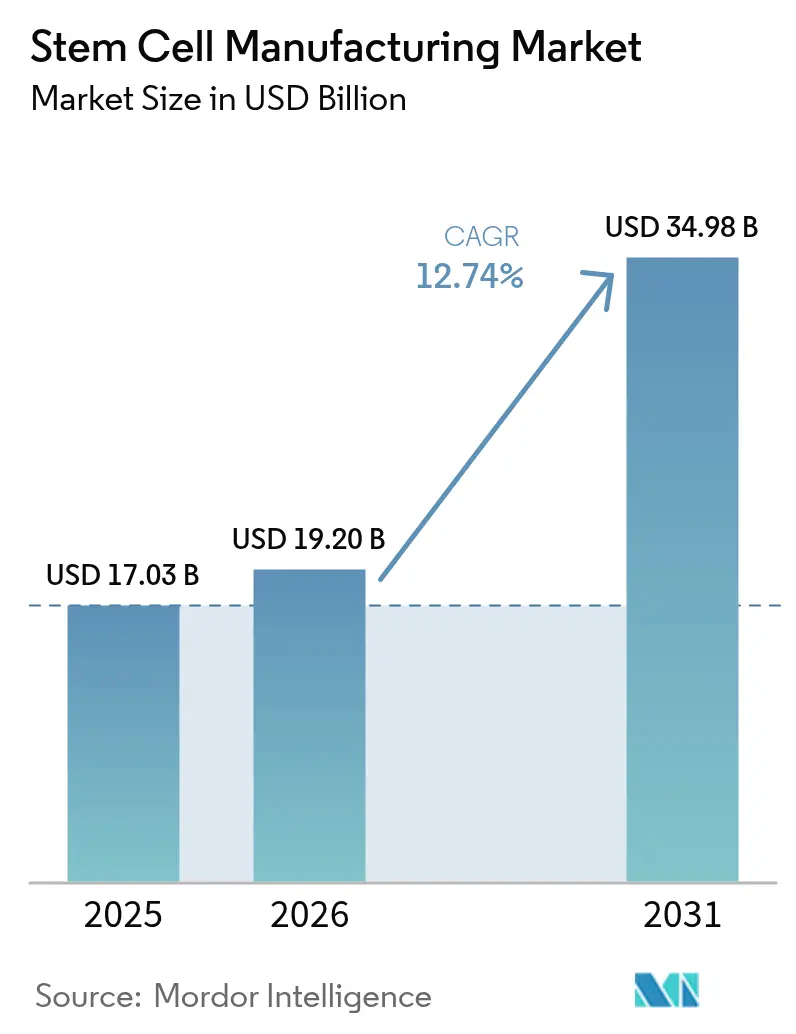
| Market Size (2026) | USD 19.2 Billion |
| Market Size (2031) | USD 34.98 Billion |
| Growth Rate (2026 - 2031) | 12.74% CAGR |
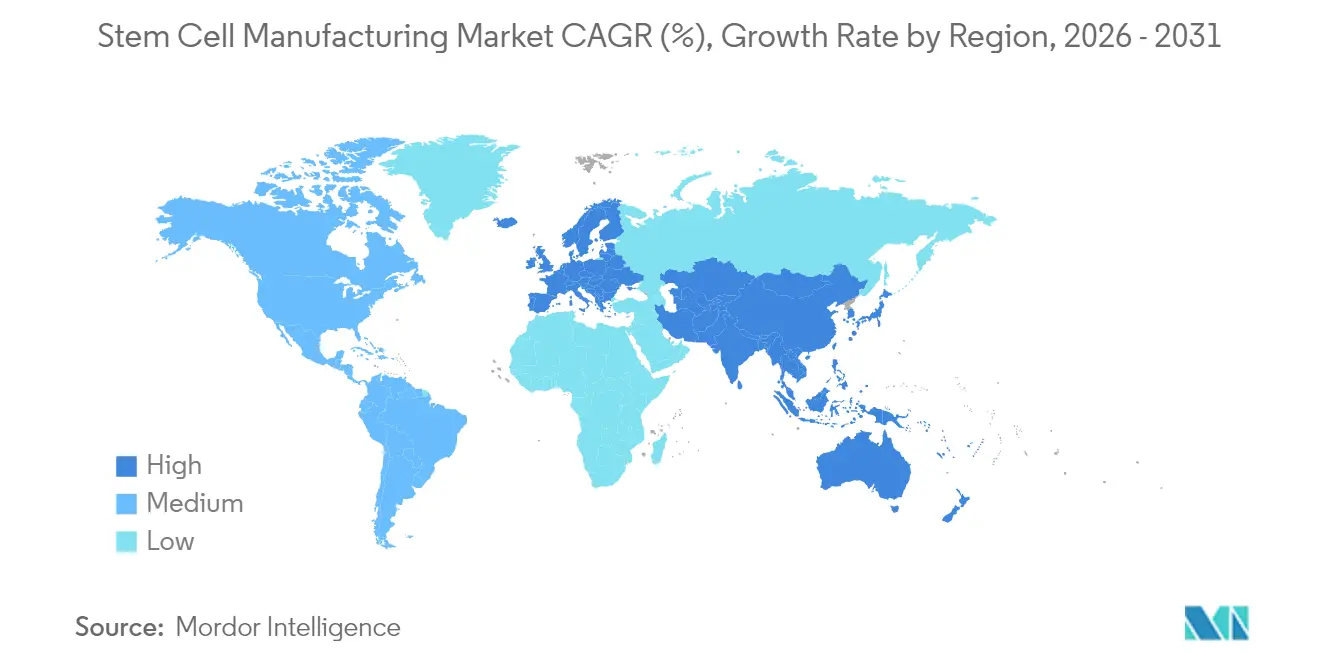
| Fastest Growing Market | Asia Pacific |
| Largest Market | North America |
| Market Concentration | Medium |
Major Players *Disclaimer: Major Players sorted in no particular order Image © Mordor Intelligence. Reuse requires attribution under CC BY 4.0. | |
Stem Cell Manufacturing Market Analysis by Mordor Intelligence
The Stem Cell Manufacturing Market size was valued at USD 17.03 billion in 2025 and estimated to grow from USD 19.2 billion in 2026 to reach USD 34.98 billion by 2031, at a CAGR of 12.74% during the forecast period (2026-2031). Rising adoption of automated, closed-system bioreactors, regulatory harmonization in major economies, and the need for large-batch production to serve regenerative therapies collectively underpin this growth trajectory. Consumables remain the single largest revenue contributor, reflecting their recurring use in every production run, while instruments are scaling fastest as manufacturers deploy robotics and advanced analytics to counter talent shortages. North America retains leadership through strong FDA frameworks and sustained public–private funding, whereas Asia Pacific posts the quickest expansion on the back of policy modernization in Japan and China.[1]Source: Takamasa Hirai et al., “Country-specific regulation and international standardization of cell-based therapeutic products,” cell.com The transition from manual workflows toward single-use technologies is lowering contamination risk and enabling distributed manufacturing close to clinical sites. However, bottlenecks in fetal bovine serum supply and a global skills crunch in bioprocess engineering pose near-term operational challenges.
Key Report Takeaways
- By product type, consumables held 46.58% of the stem cell manufacturing market share in 2025, while instruments are projected to expand at a 13.59% CAGR through 2031.
- By application, stem cell therapy accounted for 51.02% of the stem cell manufacturing market size in 2025; stem cell banking is poised for the highest growth at 14.41% CAGR to 2031.
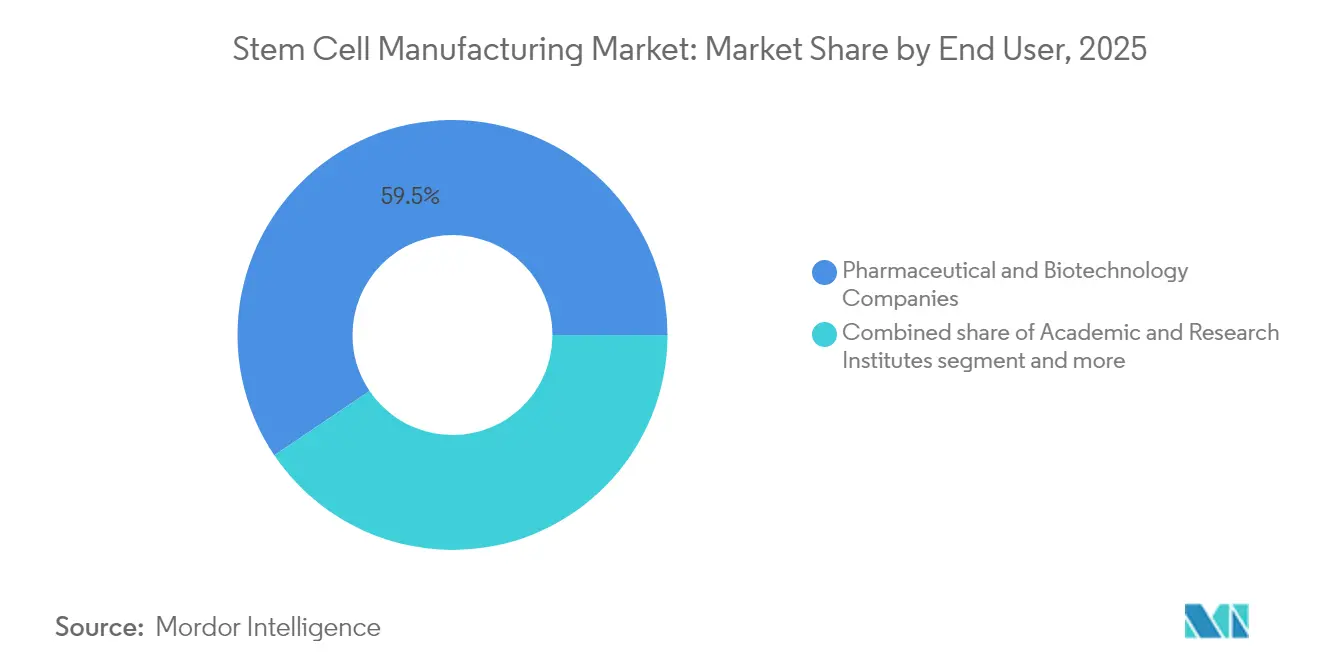
- By end user, pharmaceutical and biotechnology companies commanded 59.45% revenue share in 2025, whereas academic and research institutes are forecast to rise at a 13.76% CAGR through 2031.
- By geography, North America led with 40.88% market share in 2025, while Asia Pacific is the fastest-growing region at a 14.06% CAGR to 2031.
Note: Market size and forecast figures in this report are generated using Mordor Intelligence’s proprietary estimation framework, updated with the latest available data and insights as of 2026.
Global Stem Cell Manufacturing Market Trends and Insights
Drivers Impact Analysis*
| Driver | (~) % Impact on CAGR Forecast | Geographic Relevance | Impact Timeline |
|---|---|---|---|
| Automated, closed-system bioreactors & single-use tech | +2.8% | Global, with early adoption in North America & Europe | Medium term (2-4 years) |
| Growing public–private funding for stem-cell R&D | +2.1% | North America & EU core, expanding to APAC | Long term (≥ 4 years) |
| Rising chronic-disease burden fueling regenerative demand | +1.9% | Global, with highest impact in aging populations | Long term (≥ 4 years) |
| Growing public awareness about therapeutic potency | +1.4% | APAC & emerging markets, spillover to established regions | Medium term (2-4 years) |
| Favorable regulatory and policy support | +1.2% | Japan, EU, with gradual expansion to other regions | Short term (≤ 2 years) |
| Strategic collaborations and market expansion | +0.8% | Global, concentrated in biotech hubs | Medium term (2-4 years) |
| Source: Mordor Intelligence | |||


Automated, Closed-System Bioreactors Transform Manufacturing Paradigms
Industrial deployment of automated, closed-system bioreactors is redefining production economics across the stem cell manufacturing market. Lonza’s Cocoon platform cuts human intervention by up to 70% while maintaining GMP compliance, directly alleviating the global shortage of skilled operators. Job postings for bioprocess engineers climbed 400% between 2019 and 2023, yet remain difficult to fill, underscoring the urgency of automation.[2]Source: UC Davis Continuing Education, “Career Outlook: Cell and Gene Therapy,” cpe.ucdavis.edu Single-use assemblies reduce cross-contamination and lower facility footprints, enabling distributed production models that place manufacturing closer to point-of-care delivery. The University of Technology Sydney’s 3D-printed microfluidic harvester integrates multiple steps into one device, shrinking cost per batch and improving cell viability. Collectively, these innovations anchor a long-term uplift in capacity that underpins the market’s 12.96% CAGR outlook.
Growing Public-Private Funding Accelerates Commercial Translation
Escalating government initiatives and industry alliances continue to channel capital into advanced facilities and workforce programs. The National Institute for Innovation in Manufacturing Biopharmaceuticals (NIIMBL) sponsors collaborative projects that de-risk scale-up challenges while offering experiential training to new technicians. Biofoundry models, often housed within academic settings, are shortening iteration cycles and enabling small firms to access state-of-the-art infrastructure without heavy capital outlay. These funding streams improve technology readiness levels and bring novel therapies closer to commercial launch, solidifying the long-term demand base across the stem cell manufacturing market.
Rising Chronic-Disease Burden Creates Sustained Demand Pull
Chronic conditions such as cardiovascular disorders, diabetes, and neurodegenerative diseases are escalating sharply among aging populations, intensifying demand for regenerative solutions that conventional pharmacology cannot adequately address. The FDA’s approval of Lantidra for Type 1 diabetes in 2024 signaled regulatory willingness to endorse living-cell products for mainstream indications. Concurrently, Japan’s expedited conditional approval pathway fast-tracks therapies with promising early data, compressing timelines and incentivizing manufacturing expansion. The combination of demographic pressure and progressive regulation is strengthening investor confidence, catalyzing new plant builds and equipment upgrades throughout the stem cell manufacturing market.
Public Awareness Drives Market Acceptance and Investment
Education initiatives spearheaded by organizations like the International Society for Cell & Gene Therapy (ISCT) are elevating general understanding of cell-based treatments, translating scientific advances into tangible patient demand. Government-backed outreach in markets such as South Korea and Singapore positions regenerative medicine as a national priority, stimulating enrollment in clinical trials and encouraging insurance payors to consider reimbursement pathways. Expanding vocational curricula and apprenticeships, exemplified by the Canadian Alliance for Skills and Training in Life Sciences (CASTL), are simultaneously addressing workforce gaps and cementing public trust. Heightened awareness stabilizes revenue forecasts and supports long-term capital planning for manufacturers.
Restraints Impact Analysis*
| Restraint | (~) % Impact on CAGR Forecast | Geographic Relevance | Impact Timeline |
|---|---|---|---|
| High GMP operational costs | -1.8% | Global, with highest impact in emerging markets | Medium term (2-4 years) |
| Complex regulatory and ethical hurdles | -1.2% | EU & emerging markets, moderate impact in US/Japan | Long term (≥ 4 years) |
| Shortage of cell-manufacturing bioprocess engineers | -1.0% | Global, acute in North America & Europe | Short term (≤ 2 years) |
| Supply-chain bottlenecks for GMP growth factors and vectors | -0.9% | Global, with regional variations in severity | Medium term (2-4 years) |
| Source: Mordor Intelligence | |||
High GMP Operational Costs Constrain Market Entry
Building and running GMP-compliant facilities requires USD 10–50 million in upfront investments, with operating expenses consuming 15–25% of annual revenue, challenging small firms and emerging nations. Larger incumbents leverage economies of scale and diversified product portfolios to absorb these costs, widening competitive gaps. Bio-Techne’s transition to animal-free reagents illustrates how vendors must continuously invest in compliance-driven process upgrades while balancing cost containment. Contract manufacturing organizations (CMOs) specializing in cell therapies are beginning to democratize access, yet capacity remains limited relative to demand.
Complex Regulatory Frameworks Slow Global Market Development
Divergent regulatory classifications, such as the European Union’s Advanced Therapy Medicinal Products (ATMP) rules, extend development timelines and inflate submission costs. For combination products blending cells with devices, pathway ambiguity persists, creating additional uncertainty. Efforts by the FDA’s CoGenT Global pilot aim to harmonize approaches, but practical convergence remains nascent. Emerging economies face capacity gaps in regulatory expertise, slowing domestic approvals despite strong therapy demand, thus tempering the overall stem cell manufacturing market CAGR.
*Our forecasts treat driver/restraint impacts as directional, not additive. The impact forecasts reflect baseline growth, mix effects, and variable interactions.
Segment Analysis
By Product Type: Consumables Hold the Lion’s Share While Instruments Accelerate
In 2025, consumables accounted for 46.58% of the stem cell manufacturing market share, underscoring the indispensability of media, reagents, and single-use assemblies to every production run. Recurrent demand ensures stable cashflows, allowing suppliers to invest in serum-free and chemically defined formulations that mitigate contamination risk and combat the looming fetal bovine serum shortage. Instruments, although smaller in absolute revenue today, are projected to register a 13.59% CAGR through 2031 as facilities install closed-system bioreactors, automated cell sorters, and AI-enabled monitoring probes. The stem cell manufacturing industry is witnessing a surge in strategic alliances between equipment vendors and therapy developers, enabling real-time process optimization and reducing batch failures.
Emerging platform technologies exemplify the transformational nature of the instrument segment. Ori Biotech’s IRO system delivers 70% labor reduction and 50% cost savings, highlighting how smart hardware can reset production cost baselines. Integration of machine learning models into bioreactors allows dynamic adjustment of feed rates and oxygenation, elevating reproducibility. Consumable suppliers are responding by bundling sensors and pre-sterilized bags, creating end-to-end kits that simplify validation. Collectively, these trends diversify revenue pools and enhance resilience across the stem cell manufacturing market.


By Application: Therapeutic Programs Dominate While Banking Gains Momentum
Therapeutic applications represented 51.02% of the stem cell manufacturing market size in 2025, buoyed by the FDA’s expectation of 10–20 cell-based approvals annually by 2025. Developers prioritize scalable allogeneic platforms that serve global patient populations, propelling demand for high-volume, GMP-grade batches. Tissue engineering solutions, aided by 3D-bioprinting advances, further expand clinical pipelines targeting musculoskeletal and dermal indications. Meanwhile, drug discovery and toxicology workflows use induced pluripotent stem cells (iPSCs) to generate disease-specific models, creating parallel demand streams for smaller yet recurrent batch sizes.
Stem cell banking, though holding a smaller revenue base today, is forecast to post a 14.41% CAGR, driven by public cord-blood initiatives and diversification into adipose and dental pulp sources. Automated cryopreservation systems ensure >90% post-thaw viability, elevating confidence among clinicians. The stem cell manufacturing industry benefits from banking’s annuity-style revenue model: one-time collection fees translate into multi-decade storage income, stabilizing cashflows during fluctuating therapy approval cycles. As reimbursement frameworks evolve, stored cellular assets could serve as the raw material for personalized therapies, reinforcing demand for banked inventories and downstream manufacturing services.
By End User: Pharmaceutical Leaders Leverage Scale While Academia Accelerates Innovation
Pharmaceutical and biotechnology firms captured 59.45% of 2025 revenue, capitalizing on established quality systems and regulatory infrastructures to run multi-product cell therapy suites. Large incumbents integrate stem cell platforms into existing biologics plants, extracting economies of scope and expediting tech-transfer timelines. CMOs embedded within this cohort address capacity bottlenecks by offering turnkey GMP capabilities to venture-backed biotech entrants.
Academic and research institutes, supported by programs such as the NSF-funded Center for Cell Manufacturing Technologies (CMaT), are the fastest-growing end-user class with a 13.76% CAGR. Beyond basic science, universities run pilot-scale GMP suites that de-risk early-phase clinical materials while training a new technical workforce. This dual role enhances translational throughput and tempers the talent deficit constraining the broader stem cell manufacturing market. Hospitals and specialized clinics adopt point-of-care micro-factories to prepare autologous doses onsite, albeit at a modest growth rate, given reimbursement complexities and space constraints. Together, these dynamics foster a heterogeneous customer landscape that demands configurable manufacturing solutions.
Geography Analysis
North America retained 40.88% revenue share in 2025, driven by the world’s largest cluster of cell therapy developers, abundant venture capital, and FDA pathways such as RMAT and accelerated approval that shorten commercialization lead times. The region also houses the highest concentration of CMOs, offering flexible capacity to smaller sponsors. Yet the acute shortfall of bioprocess engineers—vacancies outpace qualified candidates three-to-one—could restrain build-out plans unless workforce initiatives gain further traction. Partnerships among community colleges, NIIMBL, and industry accelerate technician training, but competition from mRNA and viral-vector facilities intensifies hiring pressures.
Asia Pacific is the fastest-growing territory, projected to log a 14.06% CAGR as Japan’s conditional approval scheme and China’s sizeable provincial subsidies encourage rapid scaling of local plants. South Korea’s authorization of 16 cell-based products, including three stem cell therapies, underscores regulatory maturity and positions the peninsula as an exporter of manufacturing know-how. Furthermore, cost-competitive labor and land in China and India lure multinational firms to establish satellite facilities, diversifying supply chains. However, disparate approval procedures among ASEAN members still create time-to-market frictions that multinational sponsors must navigate carefully.
Europe commands a significant but more regulated market environment. The European Medicines Agency’s ATMP framework sets stringent quality benchmarks, which extend development timelines yet elevate global confidence in product safety. Implementation of the European Pharmacopoeia chapter on cell-based products offers clearer analytical standards, easing some validation uncertainties. Funding from Horizon Europe and national programs continues to support infrastructure upgrades, while public skepticism toward animal-derived components accelerates adoption of chemically defined media. Smaller regions such as the Middle East and Africa and South America observe emergent local initiatives—Brazilian and South African centers now pilot stem cell transplant programs—yet limited capital and skills infrastructures temper near-term scale-up prospects.

Competitive Landscape
Top Companies in Stem Cell Manufacturing Market
Competitive intensity across the stem cell manufacturing market is moderate. Thermo Fisher Scientific and Lonza leverage vertically integrated portfolios encompassing consumables, instruments, and contract services, which fosters customer loyalty through one-stop solutions. Continuous investment in single-use bioreactors and closed-system fill/finish lines positions these players at the forefront of automation. Mid-sized innovators such as Ori Biotech employ disruptive hardware to slash labor costs by 70%, appealing to early-stage developers seeking lean capex models.
Traditional life-science equipment firms including Beckman Coulter are entering the segment with purification platforms tailored for cell-based batches, intensifying pricing pressure and speeding technological convergence. Contract manufacturers expand geographically—Lonza in Houston and WuXi in Shanghai—providing global clients with multi-jurisdictional production footprints that ease regulatory submissions. Meanwhile, smaller regional CMOs focus on niche processes like exosome isolation, carving defensible positions through specialization.
Overall, differentiation hinges on automation depth, regulatory track record, and capacity scalability. Companies that couple modular hardware with robust digital twins can offer guaranteed batch reproducibility, a decisive advantage as therapy sponsors prepare for late-stage trials. Intellectual-property light barriers and knowledge-intensive operations favor alliances: equipment suppliers partner with therapy developers to co-create optimized workflows, while reagent vendors bundle consumables with software analytics. The ecosystem thus coalesces around platform partnerships that accelerate market penetration and enhance stickiness across the stem cell manufacturing market.
Stem Cell Manufacturing Industry Leaders
Lonza Group AG
Fujifilm Holdings Corporation (Cellular Dynamics)
Merck KGaA
STEMCELL Technologies
Thermo Fisher Scientific Inc.
- *Disclaimer: Major Players sorted in no particular order

Recent Industry Developments
- June 2025: STEMCELL Technologies acquired Cellular Highways Ltd., expanding into advanced microfluidic cell-sorting systems targeting fragile cell populations.
- May 2025: REPROCELL introduced StemEdit human iPSC non-HLA class I and class I/II knockout lines to streamline allogeneic therapy development.
- July 2024: Bioserve India launched REPROCELL stem cell product lines in India to strengthen domestic regenerative-medicine research.


Research Methodology Framework and Report Scope
Market Definitions and Key Coverage
Our study treats the stem cell manufacturing market as the full spectrum of large-scale, GMP-compliant processes, including upstream isolation, expansion, differentiation, harvest, and fill-finish, that yield therapeutic-grade stem cells, ancillary reagents, and qualified production equipment for clinical, commercial, and banking use.
Scope exclusion: ancillary gene-edited cell lines produced solely for discovery assays are not counted.
Segmentation Overview
- By Product Type
- Culture Media
- Consumables
- Instruments
- Stem Cell Lines
- Services
- By Application
- Stem Cell Therapy
- Drug Discovery and Toxicology
- Stem Cell Banking
- Tissue Engineering and Regenerative Medicine
- By End User
- Pharmaceutical and Biotechnology Companies
- Academic and Research Institutes
- Cell and Tissue Banks
- Other End Users
- By Geography
- North America
- United States
- Canada
- Mexico
- Europe
- Germany
- United Kingdom
- France
- Italy
- Spain
- Rest of Europe
- Asia Pacific
- China
- Japan
- India
- Australia
- South Korea
- Rest of Asia Pacific
- Middle East and Africa
- GCC
- South Africa
- Rest of Middle East and Africa
- South America
- Brazil
- Argentina
- Rest of South America
- North America
Detailed Research Methodology and Data Validation
Primary Research
Interviews and short surveys with QA leads at CDMOs, process-development directors in pharma-biotech firms, and academic translational centers across North America, Europe, Japan, Korea, and Singapore let us stress-test unit yields, failure rates, and median batch costs, sharpening assumptions that desk work alone could not resolve.
Desk Research
Mordor analysts first collated baseline volumes, pricing bands, and facility counts from open regulatory filings, US FDA IND/IDE logs, EU EudraCT releases, and trade bodies such as the International Society for Cell & Gene Therapy. We layered in import-export tariff codes (e.g., HS 3002.90) and NIH grant abstracts to gauge research reagent flows. Paid assets like D&B Hoovers (financials) and Questel (stem-cell patent velocity) helped benchmark company footprints. News archives in Dow Jones Factiva tracked new GMP suites and long-term supply contracts. The sources cited here illustrate, not exhaust, the material reviewed.
Market-Sizing & Forecasting
We anchored 2025 revenue by marrying a top-down 'treated-patient plus banked-sample' demand pool with a bottom-up cross-check of average selling price versus qualified-batch volumes. Key model levers include:
1. Clinical trial starts by phase (proxy for future demand),
2. Cryopreserved dose utilization ratios,
3. Shift from planar flasks to bioreactors,
4. Regional GMP suite capacity additions,
5. Median consumable spend per lot.
Multivariate regression, informed by three macro drivers (R&D outlay, hematologic cancer incidence, venture funding), underpinned the 2025-2030 CAGR.
Where supplier roll-ups under-reported Asia volumes, values were imputed from customs data and cross-validated against interview ranges.
Data Validation & Update Cycle
Outputs pass a two-tier analyst review; variance alerts trigger re-contacts, and models refresh annually, with interim updates when regulatory approvals or plant expansions shift market reality.
Stem Cell Manufacturing Baseline: Why Mordor's Commands Reliability
Published numbers seldom match because firms pick dissimilar product baskets, ASP curves, and refresh cadences.
Key gap drivers here include competitor definitions that drop service revenue, one-time currency conversions, and older base years that miss the 2024 bioreactor build-out surge. Mordor's model, updated in mid-2025, folds in those capacity jumps and validated ASP lifts, giving decision-makers a firmer footing.
Benchmark comparison
| Market Size | Anonymized source | Primary gap driver |
|---|---|---|
| USD 17.03 B (2025) | Mordor Intelligence | - |
| USD 15.79 B (2025) | Regional Consultancy A | Omits consumable kits for autologous protocols |
| USD 16.56 B (2024) | Trade Journal B | Excludes in-house services; uses constant 2021 ASP |
| USD 12.93 B (2024) | Global Consultancy A | Counts only North America and Europe; older currency rates |
Across publishers, spreads narrow once scopes align; nonetheless, Mordor delivers the most current, scope-complete baseline, traceable to transparent variables and refreshed on a disciplined schedule.


Key Questions Answered in the Report
What is the current value of the stem cell manufacturing market?
The stem cell manufacturing market is valued at USD 19.2 billion in 2026 with a forecast to reach USD 34.98 billion by 2031.
Which product segment generates the highest revenue today?
Consumables lead with 46.58% market share owing to their recurring use in every cell culture run.
Why are automated bioreactors considered critical for future growth?
Automated, closed-system bioreactors cut human intervention by up to 70%, mitigate contamination risk, and alleviate the global shortage of skilled bioprocess engineers.
Which geographic region will grow fastest through 2031?
Asia Pacific, buoyed by regulatory modernization and cost-efficient manufacturing capacity, is projected to expand at a 14.06% CAGR.
How do stem cell banks contribute to market expansion?
Stem cell banking offers annuity-style revenues and supports future personalized therapies, driving a 14.41% CAGR within the application segment.
What are the primary hurdles to new market entrants?
High GMP facility costs, complex multinational regulations, and supply chain constraints for critical reagents are the main barriers.
Page last updated on:


