
Cancer Cachexia Market Size and Share
Market Overview
| Study Period | 2020 - 2031 |
|---|---|
| Market Size (2026) | USD 2.95 Billion |
| Market Size (2031) | USD 3.61 Billion |
| Growth Rate (2026 - 2031) | 4.13 % |
| Fastest Growing Market | Asia Pacific |
| Largest Market | North America |
| Market Concentration | Medium |
Major Players *Disclaimer: Major Players sorted in no particular order Image © Mordor Intelligence. Reuse requires attribution under CC BY 4.0. | |

Cancer Cachexia Market Analysis by Mordor Intelligence
Cancer cachexia market size in 2026 is estimated at USD 2.95 billion, growing from 2025 value of USD 2.83 billion with 2031 projections showing USD 3.61 billion, growing at 4.13% CAGR over 2026-2031. Ongoing convergence of oncology survivorship gains, biomarker-enabled patient identification, and clear regulatory guidance positions the cancer cachexia market for durable expansion. Growth is anchored by ghrelin receptor agonists that already hold clinical traction, yet next-generation agents blocking GDF-15, myostatin, or dual anabolic-catabolic pathways are set to diversify the competitive field. Hospital pharmacies remain the dominant dispensing venue because of complex initiation protocols, although digital inventory solutions let online channels accelerate share capture. Regional momentum hinges on the United States, Japan, and China, where government-backed reimbursement pilots have begun to classify cachexia as a distinct treatable condition rather than a palliative endpoint.
Key Report Takeaways
- By therapeutic class, ghrelin receptor agonists led with 34.10% of cancer cachexia market share in 2025; beta-blockers / ACTAs are projected to grow at a 6.32% CAGR through 2031.
- By mechanism of action, appetite stimulators commanded 46.05% share of the cancer cachexia market size in 2025, while catabolic-pathway inhibitors are advancing at a 6.60% CAGR through 2031.
- By cancer type, lung cancer accounted for 29.18% of the cancer cachexia market size in 2025; hematologic malignancies post the fastest growth at 7.62% CAGR to 2031.
- By stage, established cachexia represented 47.96% of volume in 2025, yet pre-cachexia interventions are expanding at a 7.50% CAGR.
- By distribution channel, hospital pharmacies held 51.85% revenue share in 2025, whereas online pharmacies record a 7.33% CAGR through 2031.
- By geography, North America contributed 43.05% revenue in 2025; Asia-Pacific is the quickest-growing region with a 5.25% CAGR through 2031.
Note: Market size and forecast figures in this report are generated using Mordor Intelligence’s proprietary estimation framework, updated with the latest available data and insights as of 2026.
Global Cancer Cachexia Market Trends and Insights
Drivers Impact Analysis*
| Driver | % Impact on CAGR Forecast | Geographic Relevance | Impact Timeline |
|---|---|---|---|
| Rising cancer prevalence and patient survival | +1.2% | Global, concentrated in North America and Europe | Long term (≥ 4 years) |
| High unmet clinical need for weight and muscle preservation | +0.9% | Global, acute in Asia-Pacific emerging markets | Medium term (2-4 years) |
| Advancements in cachexia pathophysiology understanding | +0.8% | North America and EU research hubs, spillover to Asia-Pacific | Medium term (2-4 years) |
| Expanding oncology drug pipeline and combination opportunities | +0.7% | Global, led by United States FDA pathway establishment | Long term (≥ 4 years) |
| Favorable reimbursement and regulatory support in key markets | +0.5% | North America and EU, emerging in Japan | Short term (≤ 2 years) |
| Growing adoption of multimodal care approaches | +0.4% | Global, fastest uptake in integrated health systems | Medium term (2-4 years) |
| Source: Mordor Intelligence | |||
Rising Cancer Prevalence and Patient Survival
Global incidence rose to more than 20 million new diagnoses in 2024 and 5-year survival now averages 68%, effectively enlarging the at-risk population and prolonging the window for metabolic decline[1]National Cancer Institute, “Cancer Statistics Snapshot,” cancer.gov. Longer survival turns cachexia into a chronic comorbidity rather than a terminal sign, making durable pharmacologic control essential. Immuno-oncology agents further alter weight-loss trajectories, creating episodic muscle-wasting phases that require repeat intervention. Since ageing populations overlap with higher cancer incidence, cumulative prevalence stacks year over year. These structural forces bind the cancer cachexia market to the broader oncology growth curve.
High Unmet Clinical Need for Weight and Muscle Preservation
Absence of FDA-approved drugs in the American and European markets leaves physicians with off-label corticosteroids and megestrol, neither of which sustain lean body mass or functional capacity. Oncologists increasingly view cachexia as a limiting factor for chemotherapy dose intensity and immunotherapy response, thereby elevating demand for agents that prevent muscle atrophy. Health-related quality-of-life surveys consistently rank weight stability as a top priority for patients, yet current regimens offer marginal benefit. Diagnostic opacity compounds the treatment gap because dissimilar criteria obstruct multicenter trials and reimbursement audits.
Advancements in Cachexia Pathophysiology Understanding
Discovery of GDF-15 as a master signaling cytokine has unlocked precision interventions, exemplified by ponsegromab’s 5.6% mean weight gain over placebo in Phase 2 cancer cohorts[2]New England Journal of Medicine Editorial Board, “Targeting GDF-15 in Cancer Cachexia,” nejm.org. Molecular stratification now segments patients by inflammatory load, mitochondrial dysfunction, and protein turnover rates, enabling tailored study designs that meet regulatory evidentiary standards. Biomarker panels for early detection encourage pre-cachexia enrollment where pathology is still reversible. Academic-industry consortia accelerate validation of metabolic and genetic predictors, shortening translation timelines between bench and bedside.
Expanding Oncology Drug Pipeline and Combination Opportunities
Integration of cachexia endpoints into mainstream oncology protocols is growing as pharma sponsors evaluate the additive value of lean body mass preservation on progression-free survival. Combination trials pair cachexia candidates with checkpoint inhibitors, tyrosine kinase inhibitors, or cytotoxics to test bidirectional tumor and host metabolism control. Dual-purpose strategies improve overall treatment adherence and can unlock higher tolerated dosing in primary cancer therapy, giving cachexia developers strong partnering leverage. Regulatory agencies encourage such alliances through streamlined investigational new drug amendments.
Restraints Impact Analysis*
| Restraints Impact Analysis | (~) % Impact on CAGR Forecast | Geographic Relevance | Impact Timeline |
|---|---|---|---|
| Limited approved pharmacotherapies | −0.8% | Global, most acute in North America and Europe | Short term (≤ 2 years) |
| Safety and efficacy concerns of novel agents | −0.6% | Global, heightened regulatory scrutiny in United States and EU | Medium term (2-4 years) |
| Lack of standardized diagnostic criteria and trial endpoints | −0.5% | Global | Medium term (2-4 years) |
| High development costs and reimbursement uncertainty | −0.4% | Global, pronounced in markets with cost-effectiveness mandates | Long term (≥ 4 years) |
| Source: Mordor Intelligence | |||
Limited Approved Pharmacotherapies
The European Medicines Agency’s rejection of anamorelin on grounds of insufficient functional benefit demonstrates how variable endpoint expectations chill developer confidence[3]European Medicines Agency, “Assessment Report for Anamorelin,” ema.europa.eu. Weight and appetite metrics alone rarely satisfy payers that seek validated correlations with hospitalization rates or survival. Without clear precedents, pipeline companies shoulder heavier financial risk and often opt to co-develop with larger partners, slowing overall innovation velocity. Absence of label-approved choices also perpetuates heterogeneity in clinical practice, masking true demand.
Safety and Efficacy Concerns of Novel Agents
Cachexia patients carry complex comorbidities and polypharmacy loads, so regulators scrutinize adverse-event profiles meticulously, especially for agents modulating central or cardiovascular pathways. Limited long-term data raises questions around sustained anabolic stimulation and potential tumor-growth signaling. Post-marketing pharmacovigilance commitments can inflate total development cost, nudging smaller biotech firms toward early licensing exits. Efficacy validation is further complicated by disease heterogeneity because single-pathway inhibitors may show modest aggregate improvement despite robust responses in molecularly defined subgroups.
*Our forecasts treat driver/restraint impacts as directional, not additive. The impact forecasts reflect baseline growth, mix effects, and variable interactions.
Segment Analysis
By Therapeutic Class: Ghrelin Agonists Lead amid ACTA Innovation
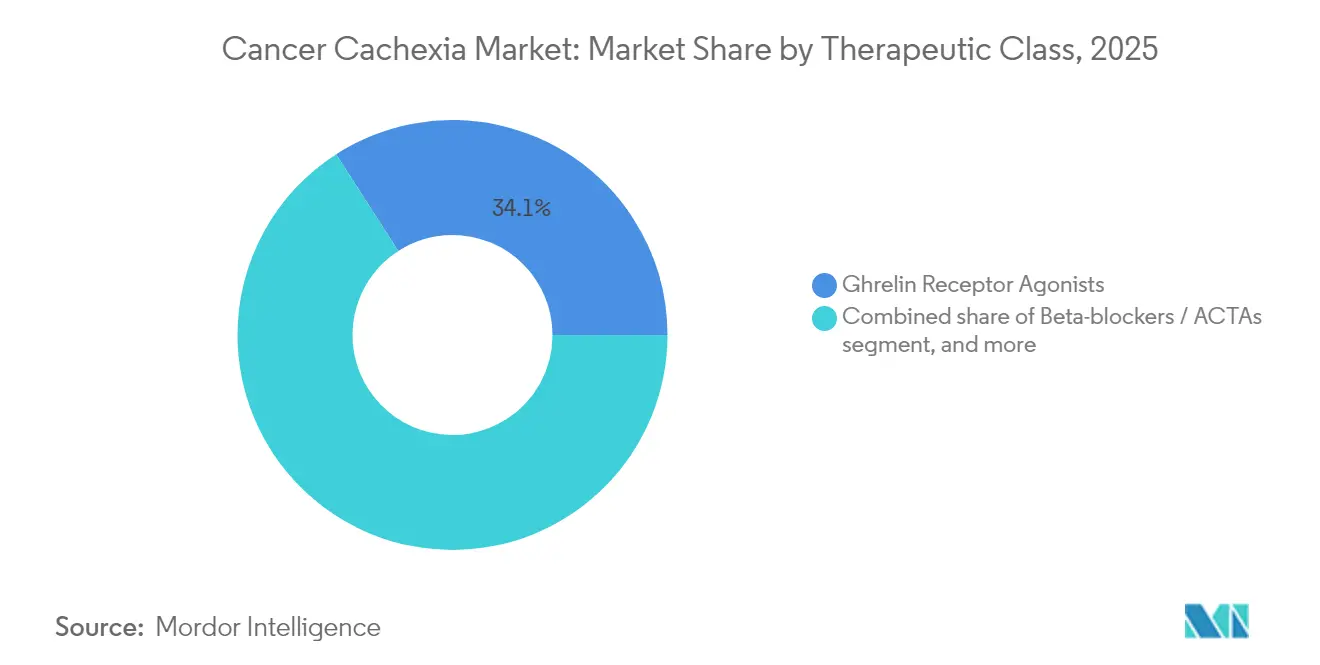
Ghrelin receptor agonists held 34.10% cancer cachexia market share in 2025, reflecting Japan’s clinical familiarity with anamorelin and supportive real-world data collected from more than 6,000 treated patients. The cancer cachexia market size for this class is projected to maintain steady momentum through incremental uptake in markets that await novel approvals. However, beta-blocker-based anabolic-catabolic transforming agents (ACTAs) are on course for a 6.32% CAGR, propelled by S-pindolol’s Phase 2 success in colorectal cancer cohorts showing simultaneous attenuation of proteolysis and stimulation of muscle protein synthesis.
Drug developers increasingly bundle ghrelin agonists with anti-inflammatory or androgen receptor modulators to enhance efficacy. Progestogens and corticosteroids retain niche utility in advanced disease but contribute marginal incremental revenue because metabolic toxicity limits long-term dosing schedules. Selective androgen receptor modulators like enobosarm offer mechanistic novelty, though regulators continue to scrutinize safety for chronic administration. Portfolio strategies therefore gravitate toward mechanistic diversification, with companies balancing the validated appetite route against emerging ACTA combinations.



By Mechanism of Action: Appetite Stimulation Dominance Challenged by Pathway Inhibitors
Appetite stimulators secured 46.05% of the 2025 revenue pool, yet catabolic-pathway inhibitors are forecast for the fastest 6.60% CAGR, mirroring rising clinician belief that caloric intake alone cannot halt sarcopenia. Appetite-based agents will still anchor first-line therapy in regions where regulatory clearance favors well-studied molecules, but second-generation treatments now bypass feeding behavior altogether to block muscle proteasome activation. The cancer cachexia industry thus witnesses a pivot toward agents that interrupt ubiquitin ligase activity or downstream inflammatory cascades.
Anabolic support through selective androgen receptor binding and myostatin inhibition continues to fill pipeline slots, often in multimodal regimens. Immunomodulators targeting IL-1 or TNF-alpha show additive effects when paired with ghrelin agonists, suggesting a future in which combination ecosystems replace monotherapy dominance. Dual-acting ACTAs epitomize this shift by delivering weight gain alongside improved hand-grip strength, a regulatory-recognized functional endpoint in Europe. Industry analysts anticipate that categorical boundaries will blur as companies patent merged mechanisms to defend franchise value.
By Cancer Type: Lung Cancer Leadership with Hematologic Surge
Lung cancer remained the single largest contributing indication, accounting for 29.18% of the cancer cachexia market size in 2025 because systemic inflammation, chronic hypoxia, and aggressive therapy regimens intersect to accelerate weight decline. Yet hematologic malignancies display a compelling 7.62% CAGR outlook, reflecting longer survival driven by CAR-T and bispecific antibodies that extend exposure to catabolic signaling.
Gastro-intestinal cancers form a sizeable segment because surgical resections and malabsorption compound metabolic deficits, leading to early therapeutic intervention. Hormone-sensitive tumors like breast and prostate show moderate cachexia incidence but benefit from rising clinical vigilance. Trial protocols are beginning to stratify by tumor biology as data reveal divergent cytokine signatures influencing drug response, thereby advancing precision dosing algorithms.
By Stage of Cachexia: Pre-Cachexia Prevention Gains Momentum
Pre-cachexia therapy is expanding at a 7.50% CAGR as standardized screening flags subtle involuntary weight losses and inflammatory markers months before clinical wasting appears. Early initiation correlates with stronger lean mass preservation and improved treatment tolerance, prompting oncologists to integrate muscle health checks into baseline work-ups. In contrast, established cachexia still controlled 47.96% of 2025 volumes because legacy diagnostic habits centered on late-stage weight loss.
Refractory cachexia remains the most refractory category, often limited to palliative measures and under-represented in trials because of high morbidity. Industry focus is shifting toward risk prediction algorithms that can route patients into pre-emptive protocols, leveraging AI models with accuracy ranges of 77-85% in multicenter validation studies. These tools support a prevention market that may ultimately eclipse late-stage therapy as clinical guidelines evolve.

By Distribution Channel: Hospital Dominance amid Digital Transformation
Hospital pharmacies captured 51.85% revenue in 2025, highlighting the need for oncologist supervision during induction and early titration. The cancer cachexia market size for hospital sales will remain substantial because agents like ponsegromab require monitoring of cardiovascular and metabolic parameters. Online pharmacies nevertheless post a 7.33% CAGR as tele-oncology gains reimbursement legitimacy and cold-chain logistics mature.
Specialty retail outlets adopt medically integrated dispensing models that bridge chemotherapy suites and community practice, although reimbursement lags dampen penetration. Digital adherence programs, weight-tracking applications, and virtual counseling augment oral regimens, creating a hybrid service architecture. Health systems evaluate outcome-based contracts where pharmas rebate cost if patients fail to maintain predefined muscle benchmarks, incentivizing extended digital follow-up.
Geography Analysis
North America generated 43.05% of global revenue in 2025 thanks to resilient R&D financing, extensive clinical trial networks, and early inclusion of cachexia endpoints within major registrational studies. Academic centers routinely embed metabolic monitoring within oncology pathways, driving timely diagnosis and referral to supportive care clinics. Despite this edge, reimbursement headwinds linger because private payers weigh short-term drug costs against yet-to-be-quantified hospitalization savings.
Asia-Pacific is advancing at a 5.25% CAGR through 2031, propelled by Japan’s landmark anamorelin listing and China’s rapidly scaling oncology infrastructure. Harmonized guidelines across Korea, Australia, and Singapore are shortening review timelines for foreign dossiers. Local biotech pipelines target myostatin and GDF-15 pathways, reflecting strong government incentives for first-in-class launches. Public-private partnerships invest in muscle health programs that bundle nutritional counseling with pharmacotherapy, accelerating demand for comprehensive solutions.
Europe shows moderate growth as fragmented reimbursement landscapes slow rollout. The EMA’s insistence on functional endpoints has delayed market entry for several candidates, yet national cancer plans are now adding cachexia screening metrics, which should lift diagnosis rates. Leading institutions in Germany and Italy pilot multimodal clinics pairing physiotherapists with pharmacologic regimens, generating real-world data that could tip cost-effectiveness evaluations in favor of adoption.


Regulatory Landscape
Cancer cachexia remains a high-bar indication in the United States and Europe, with no pharmacological therapy specifically approved by the US FDA or the European Medicines Agency for cancer cachexia as of the base year 2025. Japan is a notable exception, where anamorelin received approval (2021), highlighting how jurisdictional differences in evidentiary thresholds, especially around functional outcomes versus weight or lean-mass measures, shape commercialization pathways.
Across major agencies, endpoint selection and patient-meaningful benefit documentation increasingly guide trial and filing strategies. FDA Patient-Focused Drug Development guidance on clinical outcome assessments has reinforced sponsor emphasis on validated symptom and function measures, aligning with the EMA precedent reflected in the anamorelin approval outcome in Europe where functional benefit expectations constrained approval. Industry and regulatory stakeholders also convened a Regulatory and Trial Update Workshop in Washington, DC (December 2024) to advance standardization of trial endpoints and regulatory expectations, reflecting ongoing efforts to de-risk development and support consistent benefit demonstration in heterogeneous cachexia populations.
Competitive Landscape
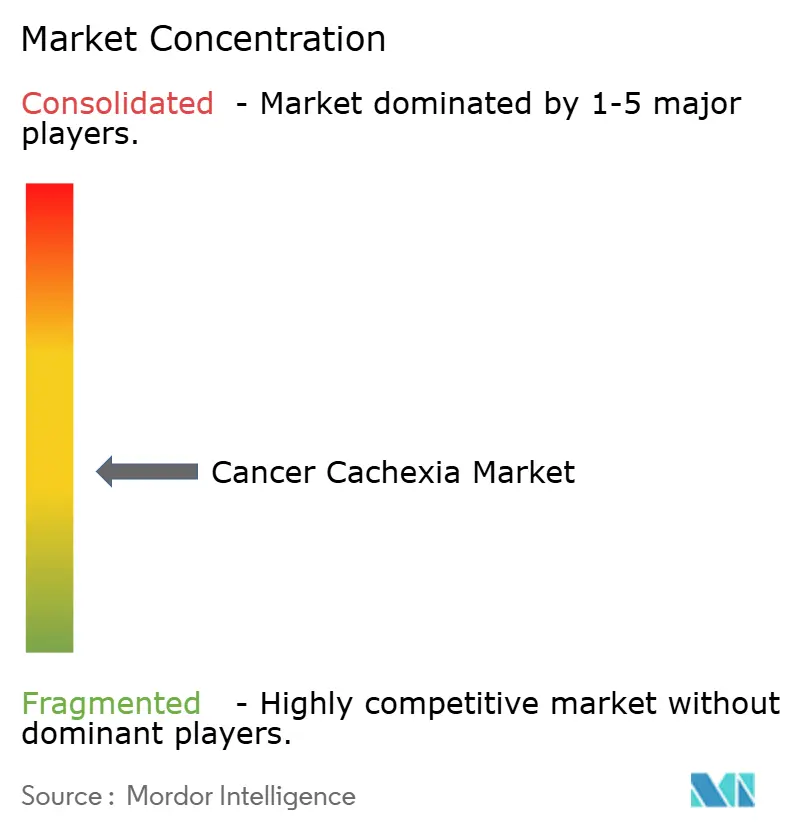
Nineteen notable companies share the global arena, none with more than low-double-digit sales, which confers a market concentration score of 4. Pfizer leverages ponsegromab and alliance depth to set regulatory precedents, while Actimed Therapeutics exploits ACTA know-how to carve specialist mindshare. Helsinn extends anamorelin lifecycle through post-marketing surveillance and regional licensing, keeping the ghrelin franchise relevant.
Digital health entrants collaborate with pharma to layer algorithmic patient selection over traditional trial recruitment, shrinking enrollment windows and boosting statistical power. Patent dossiers reveal clustering around GDF-15 antibodies, myostatin inhibitors, and selective androgen receptor modulators, with many filings covering delivery vectors and combination methods to widen barriers to entry.
Mergers and acquisitions illustrate strategic appetite for supportive-care diversification, highlighted by Merck KGaA’s USD 3.9 billion SpringWorks Therapeutics takeover, which adds rare-tumor know-how adaptable to cachexia. Licensing deals structure milestone-heavy payments tied to functional endpoints, signaling heightened confidence in late-stage value realization. Small biotechs maintain negotiating leverage through phenotype-specific data packages that complement large-cap portfolios.
Cancer Cachexia Industry Leaders
Helsinn Group
Ono Pharmaceutical
Actimed Therapeutics
Pfizer Inc.
Bristol-Myers Squibb
- *Disclaimer: Major Players sorted in no particular order

Market Opportunities and Future Outlook
White space persists in markets where physicians rely on off-label regimens because there are no FDA-approved pharmaceutical therapies specifically indicated for cancer cachexia. This creates scope for differentiated mechanisms that can support both symptom and function endpoints. Development momentum has concentrated around catabolic-pathway inhibition and multi-cytokine approaches, with the GDF-15 signaling axis emerging as a lead target for registrational programs as the market shifts from appetite-only strategies toward therapies that address muscle wasting biology.
Late-stage and newly cleared programs also provide clearer near-term signals for commercialization and partnering. In April 2026, CatalYm dosed the first patient in the global Phase 2/3 VINCIT trial (NCT07112196) evaluating visugromab, broadening the competitive set beyond established ghrelin agonists and placing a late-stage, pathway-focused program into active execution. In May 2026, EOM Pharmaceutical Holdings received FDA IND clearance for a Phase 2a trial of EOM613 in cachectic cancer patients, and GenFleet Therapeutics presented preliminary Phase I data at ASCO 2026 for GFS202A (a GDF15/IL-6 bispecific antibody), reinforcing continued sponsor interest in multi-pathway blockade aligned with durable lean-mass preservation and patient-reported benefit.
Recent Industry Developments
- April 2026: CatalYm dosed the first patient in the global Phase 2/3 VINCIT trial evaluating visugromab. The initiation marks a late-stage pathway-focused program entering active execution and signals momentum beyond appetite-based strategies.
- November 2025: Actimed Therapeutics entered a strategic licensing agreement with Mankind Pharma, granting exclusive rights for its cachexia treatments in India and other South Asian territories. The deal expands regional commercialization planning and unlocks access pathways in Asia-Pacific markets where diagnosis and supportive-care infrastructure are scaling.
- December 2024: Actimed Therapeutics reported publication of results from the Phase 1 pharmacokinetic, pharmacodynamic, and bioavailability study of S-pindolol benzoate (ACM-001.1) in The Journal of Cachexia, Sarcopenia and Muscle. The peer-reviewed dataset strengthens the clinical foundation for ACTA-style approaches that aim to pair anti-catabolic effects with functional improvement in subsequent trials.


Research Methodology Framework and Report Scope
Market Definition and Coverage
For this study, the cancer cachexia market is defined as the total value of therapies used to manage or treat cancer-related cachexia, where patients experience involuntary weight and muscle loss and need medical intervention.
Scope exclusions: Non-cancer wasting conditions and general nutrition products that are not positioned or used specifically for cancer cachexia management are excluded.
Segmentation Overview
- By Therapeutic Class
- Ghrelin Receptor Agonists
- Selective Androgen Receptor Modulators (SARMs)
- Beta-blockers / ACTAs
- Progestogens
- Corticosteroids
- Combination Therapy
- Other Therapeutic Classess
- By Mechanism of Action
- Appetite Stimulators
- Anabolic Agents
- Catabolic-Pathway Inhibitors
- Anti-inflammatory / Immunomodulators
- Multi-target ACTAs
- By Cancer Type
- Lung Cancer
- Gastro-intestinal Cancers
- Breast Cancer
- Prostate Cancer
- Hematologic Malignancies
- Other Cancer Types
- By Stage of Cachexia
- Pre-cachexia
- Established Cachexia
- Refractory Cachexia
- By Distribution Channel
- Hospital Pharmacies
- Retail Pharmacies
- Online Pharmacies
- Geography
- North America
- United States
- Canada
- Mexico
- Europe
- Germany
- United Kingdom
- France
- Italy
- Spain
- Rest of Europe
- Asia-Pacific
- China
- Japan
- India
- Australia
- South Korea
- Rest of Asia-Pacific
- Middle East & Africa
- GCC
- South Africa
- Rest of Middle East & Africa
- South America
- Brazil
- Argentina
- Rest of South America
- North America
Data Sources, Market Sizing, and Validation
Desk Research
Desk research starts with disease and treatment context so the model does not overcount broad oncology supportive care spending. We mainly reviewed public sources such as the World Health Organization, the US CDC, the US NIH, and clinical trial registry records, along with peer-reviewed oncology and nutrition journals, to capture prevalence signals, care pathways, and how cachexia is diagnosed in practice.
To convert the care pathway into a revenue view, we also used sources such as regulator websites (for example, the US FDA and EMA), government health statistics releases, and trade or medical association publications that describe supportive care patterns. Company annual reports, investor presentations, and press releases were used to map therapy focus, regional exposure, and commercialization timelines, then paid subscription access for company financials and patent databases was used selectively to cross-check pipeline intensity and ownership. The sources listed here are illustrative, and there are many other public documents we referred to for data collection, validation, and clarification.
Primary Interviews and Surveys
Primary work was used to pressure-test the assumed treated pool and the practical therapy mix by stage of cachexia, because published guidance and real-world prescribing do not always align. We spoke with clinicians, hospital pharmacy stakeholders, and industry participants across APAC, EMEA, and the Americas to validate adoption patterns, channel mix, and realistic price ranges, then rechecked outliers through follow-up questions so the final assumptions stayed consistent.
Distribution of primary research fieldwork respondents
| Company type | Respondent position | Region |
|---|---|---|
| Top tier: 26% | CXOs: 16% | APAC: 51% |
| Mid tier: 58% | Functional/Unit leaders: 37% | EMEA: 29% |
| Smaller Players: 16% | Managers: 47% | Americas: 20% |
Market-Sizing & Forecasting
Sizing was built using a top-down approach where cancer burden and cachexia prevalence signals are converted into an addressable treated pool, which is then translated into value using therapy mix and average annual cost by channel. Once those totals were formed, we checked them through selective bottom-up approximations, such as sampled price points across hospital and retail settings and a supplier and pipeline sense-check, and then adjusted where the two views did not line up.
Key inputs used in the model include oncology incidence trends, the share of patients progressing to pre-cachexia and later stages, likely treatment eligibility and persistence, channel split across hospital, retail, and online pharmacy routes, and expected price movement as newer mechanisms gain traction. Forecasting relies on scenario analysis supported by expert views on how quickly appetite stimulators and weight stabilization approaches are adopted, along with region-specific access factors that affect uptake. Where a bottom-up check lacked visibility for smaller geographies, we handled the gap by applying validated proxy rates from comparable countries and then reconciling them back to the regional total.
Data Validation & Update Cycle
Outputs were validated through multiple checks so the numbers remain explainable. We compared results against independent signals like regional oncology spending direction, treatment setting mix, and known access constraints, then investigated any sharp swings that did not match the underlying drivers.
Before sign-off, the model and assumptions go through step-by-step analyst review, and follow-up outreach is triggered when a key variable moves meaningfully or when interview feedback contradicts desk findings. The report is refreshed annually, and interim updates are made when material events occur, followed by a final pre-delivery review so the client receives the latest updated view.
Mordor Intelligence's Cancer Cachexia Market Estimate Compared With Other Published Estimates
Published market sizes for cancer cachexia often vary because the treated pool is hard to pin down, and because therapy scope and channel coverage get interpreted differently across studies. Differences also come from how firms handle stage definitions, pricing assumptions, and the timing of currency conversion, which can change the reported USD value even when the same geographies are covered.
The main gap comes from whether general oncology nutrition and broad supportive care are counted alongside therapy spend. In the Mordor Intelligence model, those items are included only when they are directly tied to cancer cachexia management through the defined therapeutic and channel scope. Estimates can also diverge when a report assumes faster uptake for newer mechanisms without checking access and prescribing reality, or when it uses a single global price progression rather than region-specific pricing and channel mix checks.
Benchmark comparison
| Source | Market Size | Gaps in Research Methodology |
|---|---|---|
| Mordor Intelligence | USD 2.95 B (2026) | |
| Global Consultancy A | USD 2.54 B (2024) | Uses an earlier base year and a broader segmentation that can pull in adjacent supportive care items, and the treated pool assumptions are not clearly reconciled to cachexia stage and channel mix. |
| Industry Publisher B | USD 2.53 B (2024) | Relies on a base-year snapshot with limited visibility on persistence and real-world adoption by stage, and the pricing logic appears to be applied more uniformly across regions than what channel checks usually support. |
Taken together, the spread is mainly explained by what gets counted as cachexia-specific care and how the treated pool and pricing are carried across regions and years. By keeping the variables tied to stage progression, channel mix, and realistic adoption speed, the final number stays traceable to inputs that can be rechecked and repeated.


Key Questions Answered in the Report
What is the current value of the cancer cachexia market?
The market was valued at USD 2.95 billion in 2026 and is projected to reach USD 3.61 billion by 2031.
Which therapeutic class leads the cancer cachexia market?
Ghrelin receptor agonists lead with 34.10% market share thanks to widespread use of anamorelin in Japan.
Which mechanism of action is growing fastest?
Catabolic-pathway inhibitors show the highest projected CAGR at 6.60% through 2031 as clinicians prioritize muscle preservation over appetite stimulation.
Which cancer type offers the strongest growth opportunity?
Hematologic malignancies are forecast to expand at a 7.62% CAGR because extended survival from novel therapies increases cachexia risk.
Which region is expanding most rapidly?
Asia-Pacific posts the quickest growth at 5.25% CAGR due to increased oncology capacity and supportive regulatory pathways.
Why is early intervention emphasized in cachexia management?
Pre-cachexia treatment preserves lean body mass before irreversible wasting occurs, leading to better therapy tolerance and lower downstream healthcare costs.
Page last updated on:


 Your data is secure and never sold or shared.


