Cancer Immunotherapy Market Size and Share
Market Overview
| Study Period | 2020 - 2031 |
|---|---|
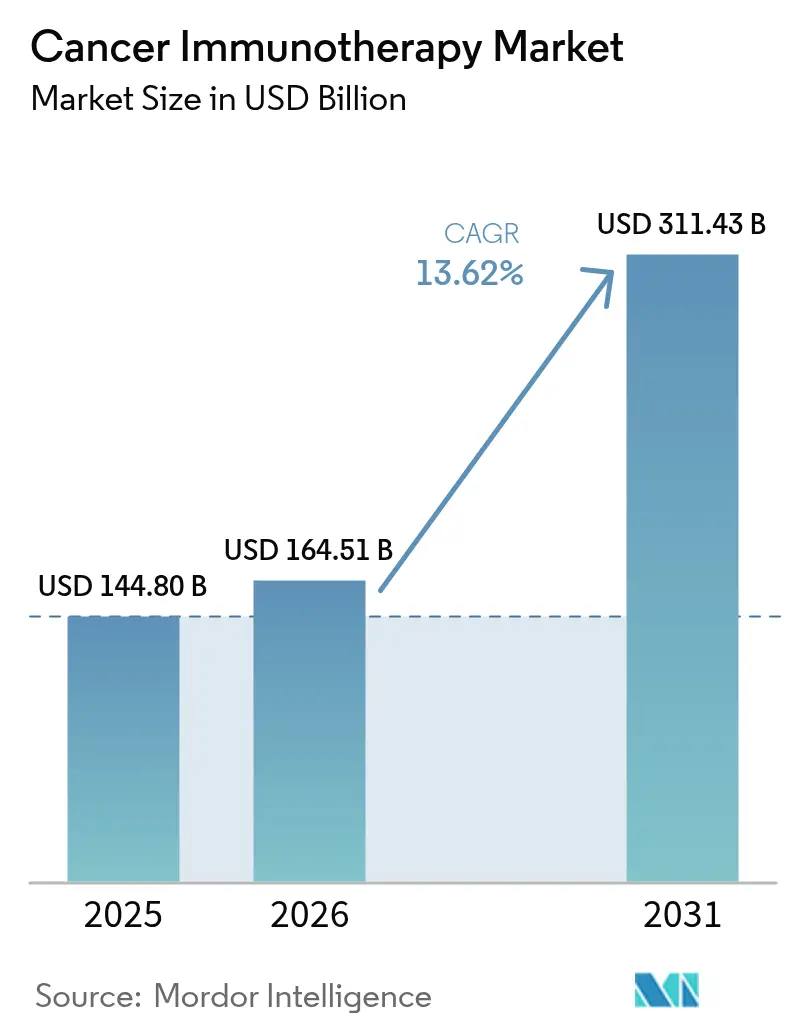
| Market Size (2026) | USD 164.51 Billion |
| Market Size (2031) | USD 311.43 Billion |
| Growth Rate (2026 - 2031) | 13.62% CAGR |
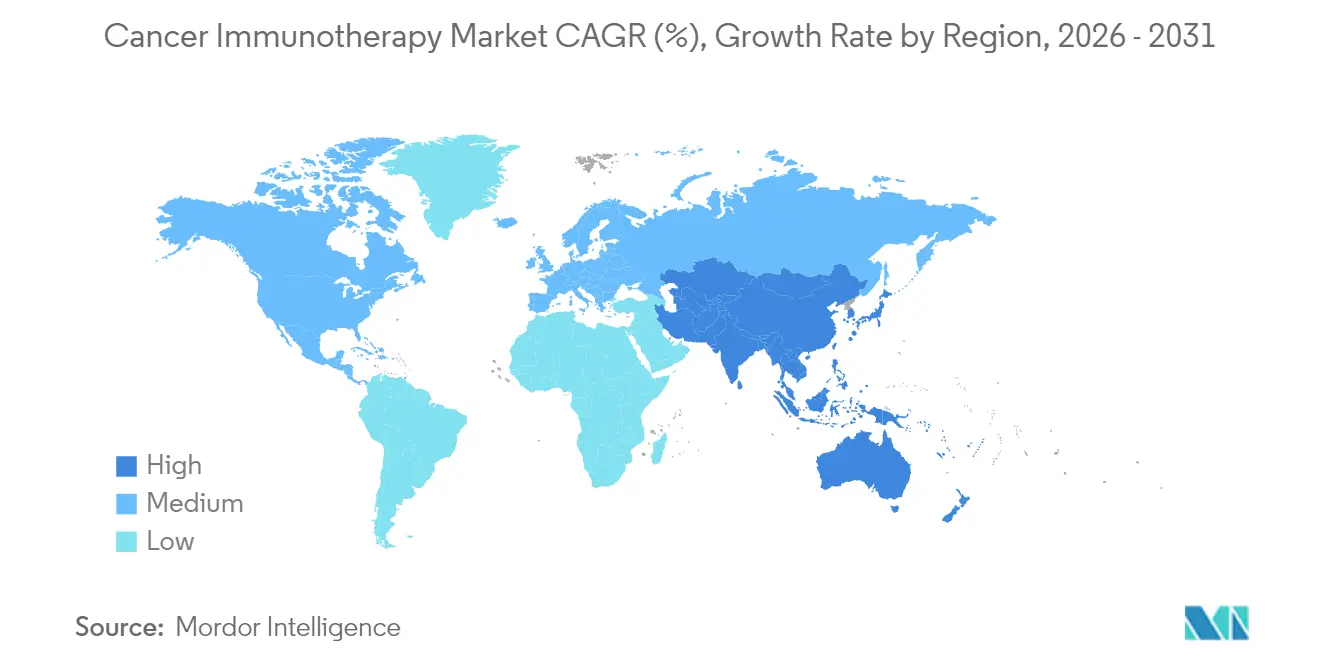
| Fastest Growing Market | Asia-Pacific |
| Largest Market | North America |
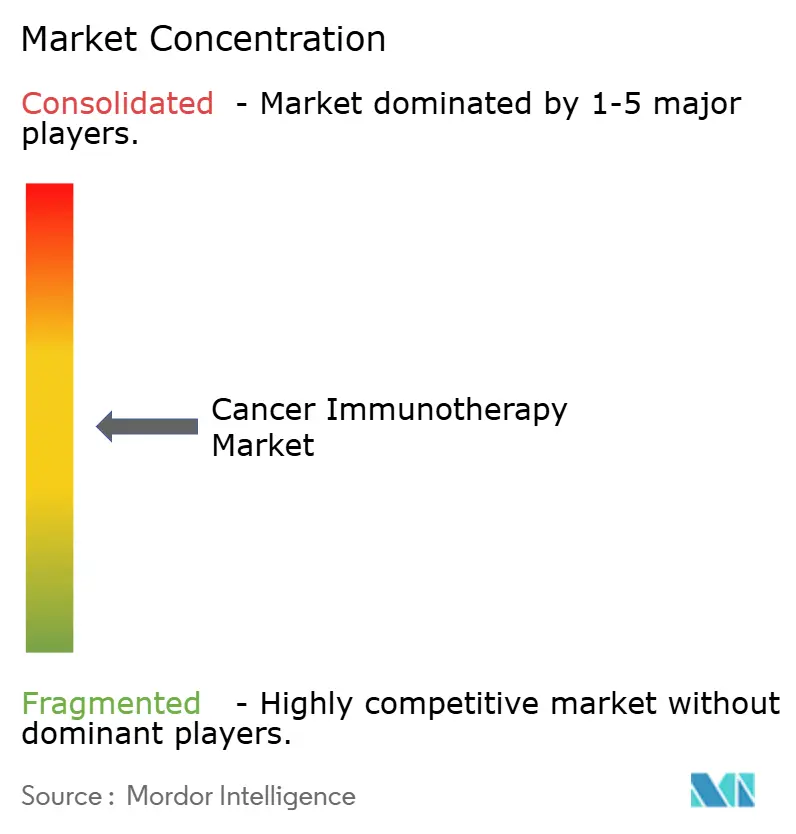
| Market Concentration | Medium |
Major Players *Disclaimer: Major Players sorted in no particular order Image © Mordor Intelligence. Reuse requires attribution under CC BY 4.0. | |
Cancer Immunotherapy Market Analysis by Mordor Intelligence
The cancer immunotherapy market size was valued at USD 144.80 billion in 2025 and estimated to grow from USD 164.51 billion in 2026 to reach USD 311.43 billion by 2031, at a CAGR of 13.62% during the forecast period (2026-2031). The growth surge mirrors the therapy class’ graduation from experimental use to a pillar of standard oncology care, accelerated by high-profile approvals such as the February 2024 U.S. Food and Drug Administration (FDA) clearance of lifileucel, the first tumour-infiltrating lymphocyte (TIL) therapy for advanced melanoma[1]U.S. Food and Drug Administration, “FDA Approves Lifileucel for Advanced Melanoma,” fda.gov. Momentum is reinforced by large-scale manufacturing investments, widening payer acceptance of outcome-based contracts, and combination-therapy trial readouts that validate durable survival benefits. Supply-chain maturity around viral vectors and mRNA synthesis further lowers production risk, encouraging broader commercial roll-outs. Asia-Pacific’s regulatory harmonisation and capacity build-out add a second growth engine that balances North America’s established dominance, while competitive intensity heightens as cash-rich incumbents acquire specialised innovators to secure next-generation modalities.
Key Report Takeaways
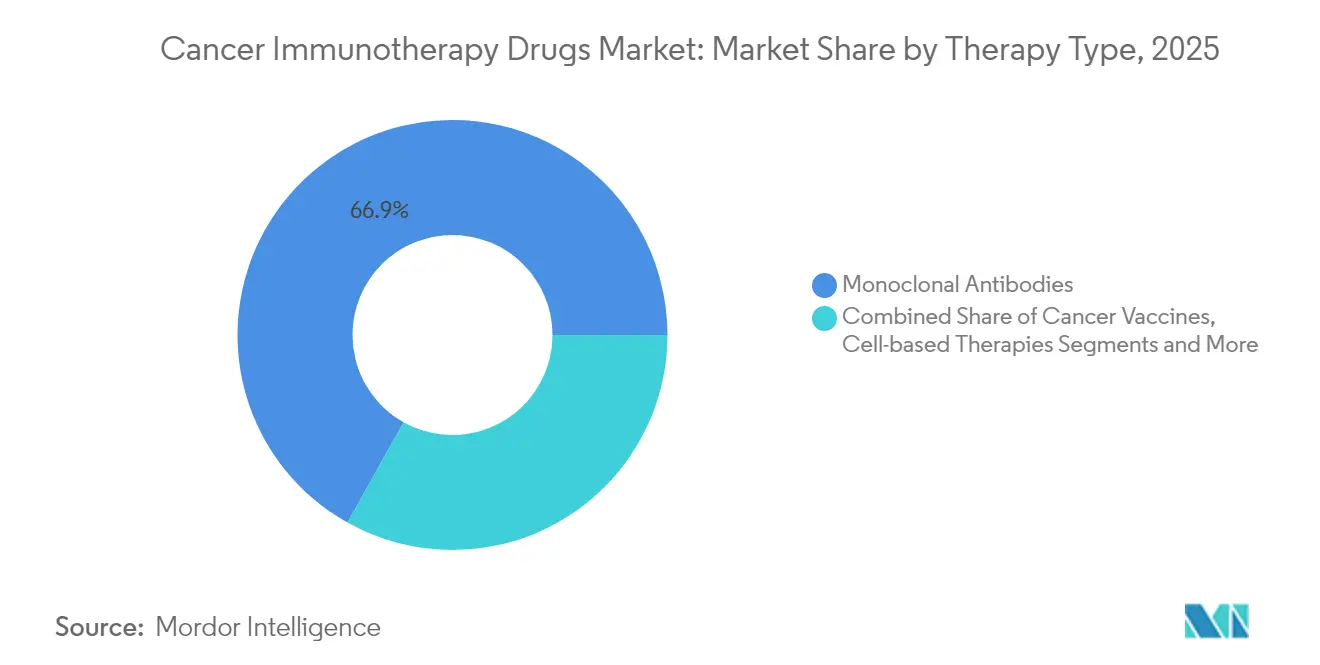
- By therapy type, monoclonal antibodies led with 66.88% revenue share in 2025, whereas oncolytic virus therapies are projected to expand at a 23.28% CAGR to 2031.
- By cancer type, lung cancer held 25.12% of the cancer immunotherapy market share in 2025, while hematologic malignancies are advancing at a 21.42% CAGR through 2031.
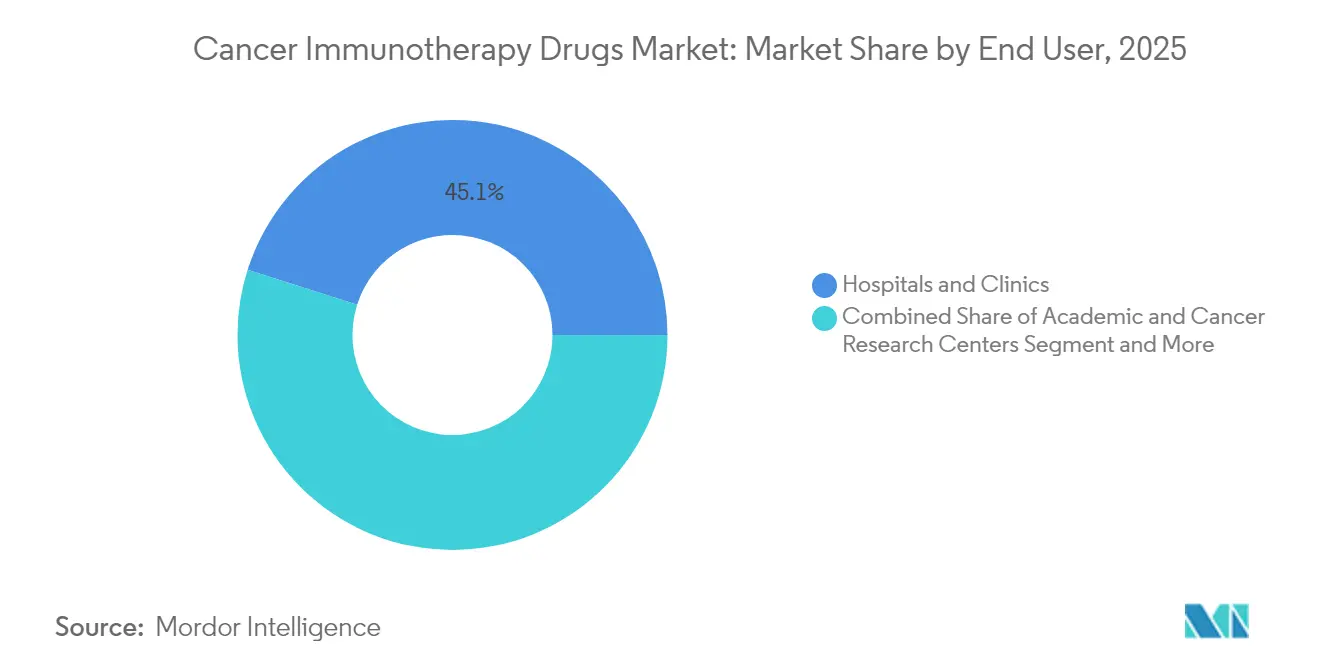
- By end user, hospitals and clinics accounted for 45.10% of demand in 2025, whereas academic and cancer research centres record the highest projected CAGR at 17.96% to 2031.
- By route of administration, intravenous delivery represented 63.05% share in 2025; subcutaneous and intratumoral routes are growing at a 14.88% CAGR.
- By geography, North America commanded 48.10% of revenue in 2025, yet Asia-Pacific is forecast to register the fastest 17.74% CAGR through 2031.
Note: Market size and forecast figures in this report are generated using Mordor Intelligence’s proprietary estimation framework, updated with the latest available data and insights as of 2026.
Global Cancer Immunotherapy Market Trends and Insights
Drivers Impact Analysis*
| Driver | (~) % Impact on CAGR Forecast | Geographic Relevance | Impact Timeline |
|---|---|---|---|
| Escalating Global Incidence Of Solid Tumors | +2.8% | Global, with highest impact in North America & Europe | Long term (≥ 4 years) |
| Superior Long-Term Survival Vs. Chemotherapy & Targeted Small-Molecule Agents | +3.2% | Global, particularly developed markets | Medium term (2-4 years) |
| Expanding FDA/EMA Label Approvals For PD-1/PD-L1 Inhibitors | +2.1% | North America & EU primary, APAC secondary | Short term (≤ 2 years) |
| Rapid Pipeline Of CAR-T & Bispecific Antibodies Entering Late-Phase Trials | +2.9% | Global, with concentration in US, EU, China | Medium term (2-4 years) |
| AI-Optimised Neoantigen Prediction Shortening Personalised Vaccine Lead-Times | +1.4% | North America & EU core, expanding to APAC | Long term (≥ 4 years) |
| Hospital Adoption Of "In-House" TIL Manufacturing Driven By Point-Of-Care Bioreactors | +1.1% | North America & EU primary markets | Medium term (2-4 years) |
| Source: Mordor Intelligence | |||
Escalating Global Incidence of Solid Tumours
Rising lifestyle-related risk factors and ageing demographics enlarge the treatable patient pool, notably in lung, colorectal, and breast cancers. Oncology societies now recommend routine biomarker screening, ensuring more patients are triaged early into immunotherapy regimens. Public-sector cancer awareness campaigns further accelerate diagnosis rates, while payer agencies expand reimbursement budgets for precision drugs that promise superior outcomes. Collectively, these forces sustain volume growth in the cancer immunotherapy market even as pricing pressures mount.
Superior Long-Term Survival Versus Chemotherapy
Five-year follow-up from CheckMate 9LA confirmed that nivolumab plus ipilimumab with chemotherapy achieved 18% overall survival in metastatic non-small cell lung cancer against 11% for chemotherapy alone, reinforcing the durability advantage that shapes modern treatment algorithms. Oncology guidelines increasingly prioritise checkpoint inhibitors in first-line settings for PD-L1-high tumours, driving protocol revisions at major cancer centres. Real-world registries corroborate trial data, boosting clinician confidence and catalysing hospital formulary expansion.
Expanding FDA/EMA Label Approvals for PD-1/PD-L1 Inhibitors
Regulatory bodies granted multiple new indications in 2025, including nivolumab–ipilimumab for dMMR/MSI-H metastatic colorectal cancer, trimming disease-progression risk by 79% over chemotherapy. Parallel approvals of a subcutaneous nivolumab formulation cut chair time and infusion-suite costs, encouraging community-hospital uptake. Harmonised review timelines between the FDA and European Medicines Agency (EMA) shorten launch lags, enabling synchronous global roll-outs that amplify revenue scaling.
Rapid Pipeline of CAR-T & Bispecific Antibodies
More than 400 CAR-T candidates and a wave of bispecific constructs approach pivotal read-outs, indicating a rich late-stage pipeline. BioNTech’s BNT327, a dual PD-L1/VEGF-A bispecific, achieved an 85.4% overall response rate in extensive-stage small cell lung cancer, illustrating potency gains from multi-target engagement. Manufacturing advances such as point-of-care bioreactors compress autologous CAR-T lead-times from weeks to days, broadening applicability in rapidly progressing malignancies.
Restraints Impact Analysis*
| Restraint | (~) % Impact on CAGR Forecast | Geographic Relevance | Impact Timeline |
|---|---|---|---|
| Therapy List-Prices >USD 300k And Reimbursement Caps | -1.8% | Global, most acute in emerging markets | Short term (≤ 2 years) |
| Immune-Related Adverse Events Requiring Intensive Management | -1.2% | Global, particularly affecting community hospitals | Medium term (2-4 years) |
| Emerging Biosimilar PD-1s Pressuring Global Price Corridors | -0.9% | Europe & emerging markets primary | Medium term (2-4 years) |
| Viral-Vector Supply Bottlenecks For Autologous Cell Therapies | -0.7% | Global manufacturing hubs | Short term (≤ 2 years) |
| Source: Mordor Intelligence | |||
Therapy List Prices Above USD 300,000 and Reimbursement Caps
CAR-T therapies price above USD 300,000 per course, stretching payer budgets and prompting the rise of outcome-based contracts in markets such as the United States. Iovance’s Amtagvi lists at USD 515,000, triggering negotiations that link payment to patient response[2]Iovance Biotherapeutics, “Amtagvi List Price and Access Update,” iovance.com. Tiered pricing and compulsory-licensing threats in emerging economies weigh on revenue trajectories, pressing manufacturers to streamline production for cost efficiencies.
Immune-Related Adverse Events (irAEs) Requiring Intensive Management
Checkpoint inhibitors can induce pneumonitis, myocarditis, or endocrinopathies that demand specialist oversight. The February 2025 NCCN immunotherapy-toxicity guideline underscores the need for multidisciplinary teams and rapid intervention pathways. Community hospitals lacking immunology consult services often refer patients to tertiary centres, limiting local uptake. Tele-oncology and remote monitoring platforms emerge to disseminate expertise but require investment.
*Our forecasts treat driver/restraint impacts as directional, not additive. The impact forecasts reflect baseline growth, mix effects, and variable interactions.
Segment Analysis
By Therapy Type: Monoclonal Antibodies Dominate While Viral Therapies Surge
Monoclonal antibodies retained 66.88% of revenue in 2025, giving them the largest cancer immunotherapy market share among modalities. Continued first-line use in lung, melanoma, and renal cancers supports sizable volumes, and the segment’s cancer immunotherapy market size is projected to reach USD 192.36 billion by 2031. In contrast, oncolytic viruses are growing fastest at a 23.28% CAGR, underpinned by rising late-phase assets and manufacturing partnerships that unlock scale.
Investment patterns confirm strategic re-weighting; Pfizer’s equity stake in Ignite Immunotherapy provides access to proprietary viral backbones aligned with mRNA payloads. Parallelly, Bristol Myers Squibb’s alliance with BioNTech on bispecific antibodies merges antibody engineering know-how with mRNA capabilities. Convergence of modalities fosters combo regimens that enhance tumour-specific immunity and mitigate resistance.


By Cancer Type: Lung Cancer Leadership Meets Hematologic Acceleration
Lung cancer contributed 25.12% of 2025 sales, representing the single largest indication within the cancer immunotherapy market. The segment’s dominance persists as regulators approve adjuvant uses and high-burden geographies roll out screening programmes that drive earlier diagnosis. Hematologic malignancies exhibit the most rapid 21.42% CAGR, elevating their cancer immunotherapy market size to USD 81.73 billion by 2031.
CAR-T approvals for multiple myeloma and acute lymphoblastic leukaemia expand addressable patient pools, while bispecific antibodies extend therapy to those ineligible for cell therapy. Data from China show over 400 investigator-led CAR-T trials, reflecting academic enthusiasm and government support for indigenous innovation. Such activity positions hematology as a pivotal revenue accelerator over the forecast horizon.
By End User: Academic Centres Drive Innovation While Hospitals Scale Access
Hospitals and clinics captured 45.10% revenue in 2025, benefitting from established infusion infrastructure and reimbursement pathways. Yet academic and cancer research centres outpace all peers, growing 17.96% annually and steadily enlarging their share of the cancer immunotherapy market. Their early-adopter status stems from dedicated cell-therapy suites and protocol development capabilities that influence downstream hospital adoption.
The United States hosts 311 certified CAR-T treatment sites, most embedded in academic health systems. As point-of-care bioreactors shrink manufacturing footprints, community hospitals begin offering autologous products, democratising access and fuelling volume expansion.
By Route of Administration: Intravenous Dominance Faces Subcutaneous Innovation
Intravenous infusion commanded 63.05% revenue in 2025. However, subcutaneous and intratumoral routes grow at 14.88% CAGR as patient-centric delivery gains traction. Subcutaneous nivolumab received FDA clearance in 2025, slashing chair time from hours to minutes without efficacy compromise. The formulation change eases capacity constraints and improves patient convenience, elements crucial for chronic maintenance dosing.
Intratumoral delivery, pivotal for oncolytic viruses and local immune modulators, garners clinician interest for its potential to convert “cold” tumours into immunologically “hot” lesions. Device innovation—micro-needle arrays and image-guided injectors—improves targeting accuracy, supporting broader adoption in dermatology and interventional radiology suites.
Geography Analysis
North America preserved leadership with 48.10% of global revenue in 2025. The United States benefits from rapid FDA approvals, robust venture capital inflows, and payers experimenting with outcome-based reimbursement that sustains premium pricing. National Cancer Institute funding underwrites translational research across 71 designated cancer centres, maintaining a pipeline of investigator-initiated trials and novel combination studies. Canada mirrors the trend through federal investments in cell-therapy centres of excellence, accelerating domestic manufacturing capability.
Asia-Pacific delivers the fastest 17.74% CAGR through 2031. China spearheads regional momentum, hosting more than 400 CAR-T clinical programmes and building viral-vector capacity via public-private joint ventures. Regulatory reforms, such as the National Medical Products Administration’s priority-review pathway, compress approval timelines to under 12 months for breakthrough therapies. Japan extends leadership in early adoption; the Pharmaceuticals and Medical Devices Agency approved nivolumab for malignant pleural mesothelioma ahead of other major markets, signalling regulatory agility. India focuses on indigenous CAR-T manufacturing, leveraging cost-efficient processes to widen access and capture export demand in emerging neighbouring nations.
Europe maintains steady expansion underpinned by EMA-level coordination. Pan-EU clinical-trial networks enable efficient patient recruitment across diverse genetic backgrounds, enriching data for precision biomarker validation. While Brexit imposes dual regulatory submissions, parallel scientific advice mitigates delays, sustaining UK participation in pivotal studies. Health Technology Assessment bodies across Germany, France, and the Nordics apply cost-effectiveness thresholds that pressure list prices, incentivising outcome-based discount frameworks. Local biomanufacturing clusters in Switzerland and Ireland scale supply for both domestic and export markets, reinforcing Europe’s status as an advanced-therapy manufacturing hub.

Competitive Landscape
The cancer immunotherapy market is moderately fragmented. Merck, Bristol Myers Squibb, and Roche retain blockbuster franchises yet face intensifying competition from mRNA pioneers BioNTech and Moderna as well as cell-therapy specialists Iovance and Kite. Pfizer’s USD 43 billion purchase of Seagen integrates antibody–drug conjugate (ADC) capability that dovetails with its checkpoint inhibitor Bavencio. Merck’s USD 680 million acquisition of Harpoon Therapeutics adds bispecific T-cell engager technology, strengthening its beyond-Keytruda portfolio.
Strategic focus tilts toward modality convergence. BioNTech collaborates with Bristol Myers Squibb to develop bispecifics that merge anti-PD-1 and anti-VEGF activity, combining immune-checkpoint blockade with angiogenesis inhibition—an approach aimed at tumours resistant to single-target agents. Moderna leverages AI-optimised neoantigen discovery algorithms within its mRNA-4157 personalised cancer vaccine platform, reporting 3-year melanoma data that show sustained recurrence-free survival benefits when paired with pembrolizumab[3]Merck & Co., “Moderna & Merck Announce 3-Year Data for mRNA-4157,” merck.com.
Cost reduction emerges as a competitive lever. Novartis deploys closed-system bioreactors to lower CAR-T manufacturing costs by 40%, while China-based JW Therapeutics scales automated viral-vector units that triple annual output. Companies embracing distributed manufacturing—micro-factory networks near treatment centres—shorten supply chains and enhance responsiveness, positioning them for share gains in price-sensitive markets.
Cancer Immunotherapy Industry Leaders
Bristol-Myers Squibb
Merck & Co., Inc.
F. Hoffmann-La Roche Ltd
AstraZeneca PLC
Pfizer Inc.
- *Disclaimer: Major Players sorted in no particular order

Recent Industry Developments
- May 2025: BioNTech presented broad oncology pipeline updates at ASCO 2025, highlighting BNT327 bispecific progress and plans for 20 Phase 2/3 trials through 2026.
- May 2025: ImmunityBio signed an agreement with Saudi Arabian health institutions to deploy IL-15 superagonist Cancer BioShield across the Middle East.


Research Methodology Framework and Report Scope
Market Definitions and Key Coverage
Our study defines the cancer immunotherapy market as all prescription therapies, including monoclonal antibodies, immune-checkpoint inhibitors, cell-based products, therapeutic vaccines, and oncolytic viruses, that deliberately activate or modulate a patient's immune system to treat malignancies. Revenues are captured at ex-manufacturer levels in constant 2024 US dollars and cover commercial sales plus named-patient or compassionate-use programs worldwide.
Scope exclusion: Supportive care drugs, chemotherapy, and pre-clinical R&D spending lie outside this estimate.
Segmentation Overview
- By Therapy Type
- Monoclonal Antibodies
- Cancer Vaccines
- Immunomodulators (Cytokines, Adjuvants)
- Cell-based Therapies
- Oncolytic Virus Therapies
- Combination Regimens
- By Cancer Type
- Lung Cancer
- Breast Cancer
- Melanoma & Skin Cancers
- Prostate Cancer
- Hematologic Malignancies (Leukemia, Lymphoma, Myeloma)
- Others (CRC, Gastric, Renal, etc.)
- By End User
- Hospitals & Clinics
- Academic & Cancer Research Centers
- Ambulatory & Specialty Infusion Centres
- By Route of Administration
- Intravenous
- Sub-cutaneous / Intratumoral
- Geography
- North America
- United States
- Canada
- Mexico
- Europe
- Germany
- United Kingdom
- France
- Italy
- Spain
- Rest of Europe
- Asia-Pacific
- China
- Japan
- India
- South Korea
- Australia
- Rest of Asia-Pacific
- Middle East and Africa
- GCC
- South Africa
- Rest of Middle East and Africa
- South America
- Brazil
- Argentina
- Rest of South America
- North America
Detailed Research Methodology and Data Validation
Primary Research
Mordor analysts interviewed medical oncologists, hospital pharmacists, payers, and immunotherapy researchers across North America, Europe, Asia-Pacific, and the Middle East. Conversations clarified real-world adoption rates, dosing patterns, average selling prices, and reimbursement hurdles, letting us reconcile desk findings with frontline realities.
Desk Research
We began by collating incidence, prevalence, and survival data from WHO GLOBOCAN, CDC SEER, and Eurostat cancer registries, which give grounded patient pools for each tumor type. Approvals and label expansions were traced through FDA Drugs@FDA, EMA public assessment reports, and ClinicalTrials.gov so therapy class timelines align with real regulatory milestones.
Financial signals came from company 10-Ks, investor decks, and D&B Hoovers records, while cost benchmarks were cross-checked against Centers for Medicare & Medicaid Services price files, peer-reviewed journals such as NEJM, and major oncology association white papers. These publicly available sources, though not exhaustive, provided the factual spine for subsequent validation.
Market-Sizing & Forecasting
A top-down and bottom-up hybrid model was applied. Incidence by cancer site was aligned with immunotherapy eligible patient ratios, then multiplied by treatment lines per patient and calibrated average selling prices. Supplier roll-ups and channel checks supplied a bottom-up reasonableness test. Key variables like new indication approvals, line-extension success rates, regional reimbursement uptake, therapy-specific ASP erosion, and clinical-trial win probabilities feed a multivariate regression that drives the 2025-2030 outlook. Where bottom-up inputs were thin, gap-fills relied on interpolated uptake curves confirmed during primary calls.
Data Validation & Update Cycle
Model outputs undergo variance checks against independent sales audits and national import data. Senior reviewers sign off only after anomalies are resolved, and the dashboard is refreshed annually or sooner if major approvals, safety signals, or price resets occur.
Why Mordor's Cancer Immunotherapy Market Baseline Earns Trust
Published values often diverge because firms pick different therapy baskets, patient criteria, and pricing anchors. We acknowledge those gaps at the outset so decision-makers see exactly why totals differ.
Key gap drivers include whether cell therapies are counted, how future ASP erosion is treated, and the speed at which emerging indications are assumed to win reimbursement. Mordor models each lever transparently and updates faster, whereas many publishers freeze assumptions for two-plus years.
Benchmark comparison
| Market Size | Anonymized source | Primary gap driver |
|---|---|---|
| USD 144.8 B (2025) | Mordor Intelligence | |
| USD 136.4 B (2025) | Regional Consultancy A | Omits CAR-T and oncolytic therapies, leading to a narrower scope |
| USD 105.7 B (2024) | Global Consultancy B | Projects forward from historic sales only, disregarding pipeline approvals and price shifts |
| USD 158.4 B (2025) | Industry Portal C | Assumes rapid universal reimbursement, inflating patient penetration |
Taken together, the comparison shows that Mordor's disciplined scope selection, live price tracking, and brisk refresh cadence deliver a balanced, reproducible baseline that buyers can trust for portfolio planning and forecasting.


Key Questions Answered in the Report
What is the current size of the cancer immunotherapy market?
The cancer immunotherapy market reached USD 164.51 billion in 2026.
How fast is the cancer immunotherapy market expected to grow?
The market is projected to expand at a 13.62% CAGR, hitting USD 311.43 billion by 2031.
Which therapy type holds the largest cancer immunotherapy market share?
Monoclonal antibodies accounted for 66.88% of revenue in 2025.
Which region is growing fastest in the cancer immunotherapy market?
Asia-Pacific is forecast to record the highest 17.74% CAGR through 2031.
Why are oncolytic virus therapies attracting investment?
They combine direct tumour lysis with immune activation and are projected to grow at a 23.28% CAGR through 2031, the fastest among modalities.
Page last updated on:


