Canada Smart Home Market Size and Share
Market Overview
| Study Period | 2020 - 2031 |
|---|---|
| Forecast Data Period | 2026 - 2031 |
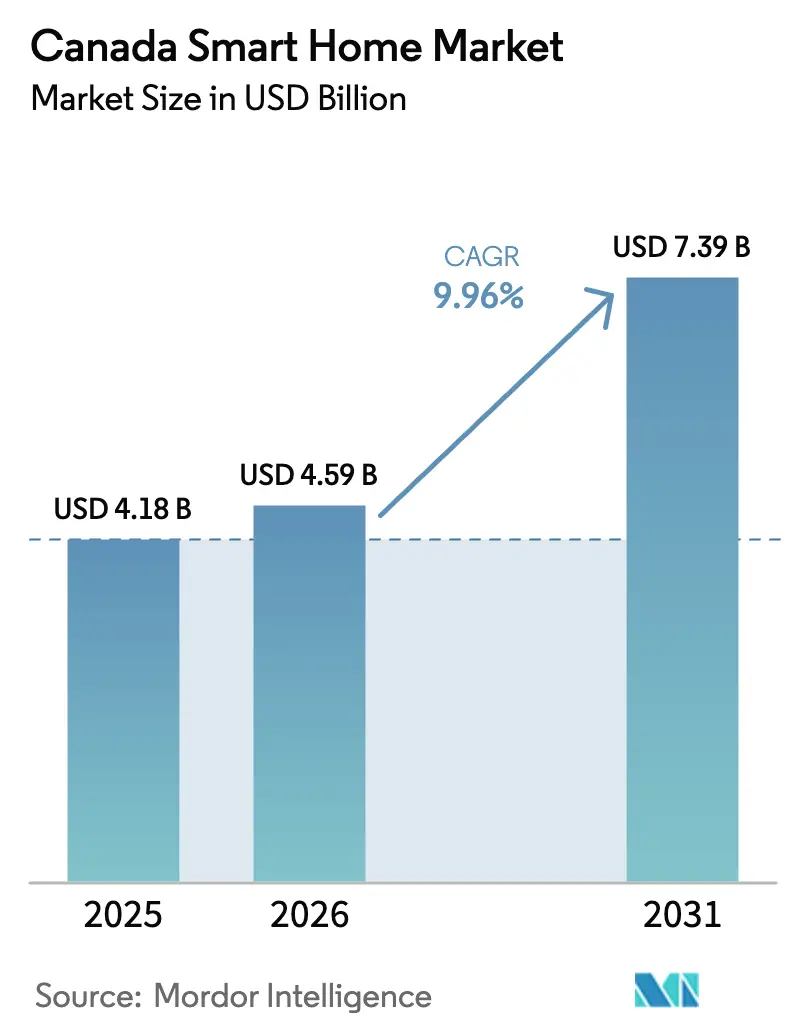
| Base Year Market Size (2025) | USD 4.18 Billion |
| Market Size (2026) | USD 4.59 Billion |
| Market Size (2031) | USD 7.39 Billion |
| Growth Rate (2026 - 2031) | 9.96% CAGR |
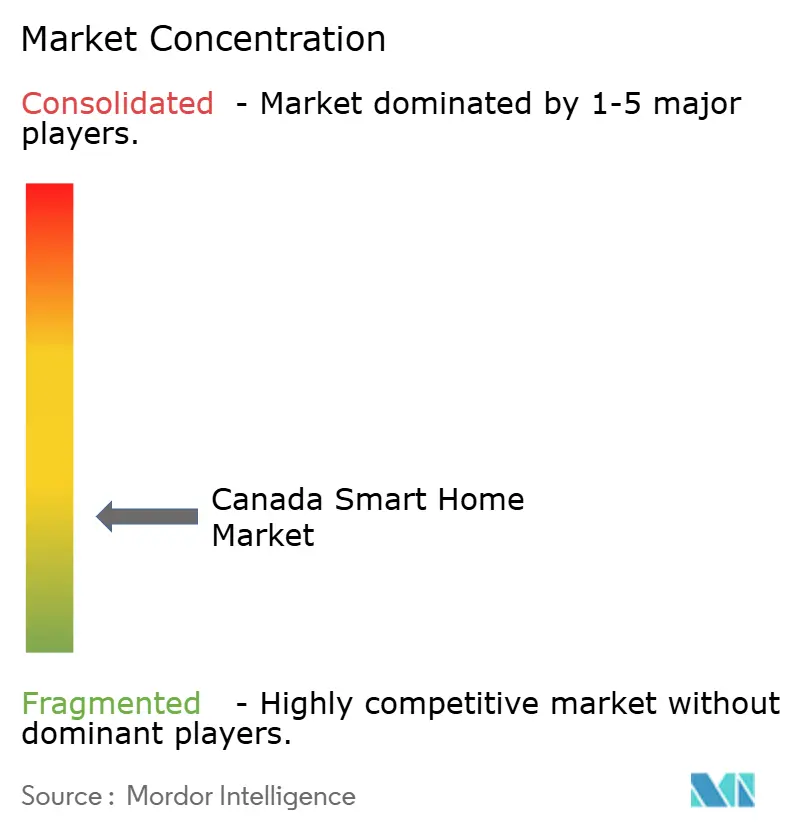
| Market Concentration | Low |
Major Players*Disclaimer: Major Players sorted in no particular order Image © Mordor Intelligence. Reuse requires attribution under CC BY 4.0. | |
Canada Smart Home Market Analysis by Mordor Intelligence
The Canada Smart Home Market size is expected to grow from USD 4.18 billion in 2025 to USD 4.59 billion in 2026 and is forecast to reach USD 7.39 billion by 2031 at 9.96% CAGR over 2026-2031. The market’s growth draws strength from sustained federal and provincial funding for energy efficiency, fast-evolving AI compute capacity, and the rapid standardization of connectivity protocols. Strong utility partnerships—especially Ontario’s Peak Perks and Hydro-Québec’s free thermostat roll-out—push adoption beyond traditional retail pathways. Telecommunications companies bundle connected devices with broadband to generate new recurring revenue streams, while insurance providers add premium discounts that materially lower consumer payback periods. Ongoing semiconductor price pressures temper short-term hardware margins, yet the pivot to Matter-compliant devices is expected to reduce future interoperability friction and unlock incremental demand.
Key Report Takeaways
- By product type: Security products led with 16.45% of Canada smart home market share in 2025, while Smart Appliances are set to expand at a 16.1% CAGR to 2031.
- By technology: Wi-Fi solutions accounted for 62.45% of the Canada smart home market size in 2025; Matter-ready Wi-Fi 7 devices are forecast to climb at a 20.3% CAGR through 2031.
- By sales channel: The Direct-to-Consumer route held 51.12% revenue share in 2025, whereas Utility/Telco-bundled offers are projected to grow at 13.95% CAGR by 2031.
- By end-user dwelling: Single-Family homes represented 60.95% of the Canada smart home market size in 2025; Multi-Family dwellings are advancing at a 13.18% CAGR over the same horizon.
Note: Market size and forecast figures in this report are generated using Mordor Intelligence’s proprietary estimation framework, updated with the latest available data and insights as of 2026.
Canada Smart Home Market Trends and Insights
Drivers Impact Analysis*
| Driver | (~) % Impact on CAGR Forecast | Geographic Relevance | Impact Timeline |
|---|---|---|---|
| Rising concerns about home security & safety | +2.1% | National, concentrated in urban centers | Medium term (2-4 years) |
| Advances in IoT, AI & voice-controlled assistants | +2.8% | National, strongest in tech-forward provinces | Long term (≥ 4 years) |
| Insurance discounts tied to connected-home devices | +1.4% | National, provincial discount variability | Short term (≤ 2 years) |
| Electric-utility demand-response incentives | +2.3% | Ontario, Quebec, Alberta | Medium term (2-4 years) |
| Source: Mordor Intelligence | |||
Rising Concerns About Home Security and Safety
Insurance-backed security bundles accelerate device uptake by translating risk mitigation into measurable premium savings. Desjardins’ Alert program grants 10% policy discounts, while Co-operators supports up to USD 1,000 toward alarm installation costs Desjardins Insurance Co-operators.[1]Desjardins Insurance, “Home Security System: Discover the Alert Program,” desjardins.com Hardware advances such as Johnson Controls’ IQ Panel 5 integrate high-resolution cameras with HVAC management, shifting adoption drivers from reactive monitoring to proactive household optimization. Multi-family retrofits demand scalable solutions that respect shared-space privacy, a concern amplified after British Columbia’s regulator scrutinized municipal camera deployments. Vendors differentiating through edge-based AI and Canadian data-hosting standards are well-positioned to capture this security-centric share of the Canada smart home market.
Advances in IoT, AI & Voice-Controlled Assistants
Generative AI pushes smart homes toward predictive management. Amazon’s 2025 Alexa+ launch illustrates conversational orchestration across heterogeneous devices.[2]Fasken, “Noteworthy News: Privacy & Cybersecurity in Canada…,” fasken.com Source: Panos Panay, “Introducing Alexa+,” aboutamazon.com Federal AI-compute programs totaling USD 300 million foster domestic breakthroughs such as BrainBox AI’s autonomous HVAC controls that slash energy use by 25%. Rapid Matter adoption driven by Samsung-ABB collaboration removes historic vendor-lock barriers, paving the way for holistic control layers that bolster user confidence. Apple’s context-aware voice patent further eases human–device interaction, an important step for inclusive adoption by older Canadians. Collectively, these advances reinforce long-run growth for the Canada smart home market.
Insurance Discounts Tied to Connected-Home Devices
Intact Insurance now incorporates real-time sensor data into underwriting, rewarding households that deploy leak, smoke, and intrusion sensors with lower premiums ThinkInsure. Typical water-damage claims average USD 15,000, so payback on sensor kits can be immediate when insurers subsidize hardware. Amica’s Smarter Home Savings program pairs manufacturer rebates with premium reductions, stacking incentives that entice risk-averse customers. Wildfire-prone regions in Alberta and British Columbia apply elevated discounts to smart smoke detectors, localizing pull factors across the Canada smart home industry.
Electric-Utility Demand-Response Incentives
Ontario’s IESO Peak Perks targets 130,000 thermostat enrollments supported by USD 342 million in grid-reliability funding. Participating households receive bill credits as devices autonomously shift loads during peak events, reinforcing the Canada smart home market’s value proposition. Hydro-Québec will distribute 1 million free thermostats to cut provincial consumption by 10% and trim customer bills by 25%.[3]Sébastien Auger, “Hydro-Québec mise sur plus d'efficacité…,” ledevoir.com TELUS’s SmartEnergy service bundles telecom and energy management, proving that cross-industry partnerships can unlock 15% utility savings TELUS. These programs make connected devices integral to grid stability, anchoring medium-term market expansion.
Restraints Impact Analysis*
| Restraint | (~) % Impact on CAGR Forecast | Geographic Relevance | Impact Timeline |
|---|---|---|---|
| Complex installation & setup | -1.8% | National, higher in rural areas | Short term (≤ 2 years) |
| Interoperability issues across brands | -1.2% | National, multi-device households | Medium term (2-4 years) |
| Privacy concerns around data residency | -0.9% | National, heightened in Quebec | Long term (≥ 4 years) |
| Source: Mordor Intelligence | |||
Complex Installation and Setup
Legacy wiring and fragmented building codes add friction, especially in pre-1990 homes. Johnson Controls’ PowerManage integration simplifies deployments by localizing data storage and streamlining network requirements.[4]Johnson Controls, “Johnson Controls IQ Panels now supported by PowerManage,” johnsoncontrols.com Nonetheless, failed DIY attempts often necessitate professional intervention, strengthening installer channels tied to telecom technicians. Condominium boards complicate retrofits as owners must secure collective approvals. Emerging plug-and-play modules ease pain points, yet alignment with Canadian electrical standards still demands expert oversight, temporarily dampening parts of the Canada smart home market.
Privacy Concerns Around Data Residency
The postponement of federal Bill C-27 prolongs uncertainty around cross-border data flows. British Columbia’s successful action against Clearview AI illustrates provinces’ willingness to enforce jurisdictional privacy controls. Quebec’s stringent language and consent rules raise localization costs for global manufacturers, while federal consultations on children’s data elevate compliance thresholds for voice assistants. Edge computing mitigates some risks by retaining data on-device, yet hardware prices rise accordingly, moderating uptake among price-sensitive households.
*Our forecasts treat driver/restraint impacts as directional, not additive. The impact forecasts reflect baseline growth, mix effects, and variable interactions.
Segment Analysis
By Product Type: Security Dominance Meets Appliance Innovation
The Security segment commanded 16.45% of Canada smart home market share in 2025, a position secured by insurance partnerships and rising urban safety concerns. Smart Appliances, however, are forecast to post a 16.1% CAGR, underscoring how AI-enabled ovens, refrigerators, and laundry units now act as energy nodes in demand-response programs. Samsung’s Vision AI showcases appliances doubling as control hubs, bridging comfort and conservation. Security remains foundational particularly doorbell cameras and smart locks but its growth rate lags appliances as households pivot toward proactive energy management.Continued appliance innovation aligns with energy regulations such as Amendment 18, which mandates efficient compressors and pool pumps that sync with monitoring platforms. HVAC controls and energy monitors integrate with thermostat-driven ecosystems, reinforcing demand for sensor fusion. Entertainment and lighting sub-categories likewise capitalize on circadian-friendly illumination and vehicle-to-home interoperability, widening total addressable revenue across the Canada smart home market.
By Technology: Wi Fi Dominance Challenged by Next Generation Protocols
Wi Fi held a 62.45% stake of the Canada smart home market size in 2025 thanks to near universal router penetration and consumer familiarity. Yet Matter ready Wi Fi 7 shipments are predicted to rise at a 20.3% CAGR, benefiting from expanded 6 GHz spectrum and deterministic QoS features. Thread and Zigbee remain favored in battery based sensors where low power mesh networking is critical. The Connectivity Standards Alliance’s Matter 1.4 adds native energy management clusters, making interoperable load control practical for utilities.Bluetooth retains niche relevance for wearables and presence detection, while 5G based modules address rural deployments where fixed broadband is inconsistent. Honeywell’s 5G smart meter pilot with Verizon exemplifies cellular’s role as resilient backhaul for mission critical loads. Over the forecast horizon, protocol coexistence persists, but unified onboarding flows should reduce set up abandonment rates, aiding holistic growth for the Canada smart home market.
By Sales Channel: Utility Partnerships Reshape Distribution
Direct to Consumer commerce dominated in 2025 with 51.12% revenue share, propelled by online marketplaces, brand stores, and social commerce. However, the Utility/Telco Bundled pathway is accelerating at 13.95% CAGR as providers exploit existing billing relationships to subsidize hardware costs. TELUS’s SmartEnergy bundle offers thermostats with connectivity plans, enhancing retention and diversifying ARPU. Retail chains still matter for product discovery but face margin compression when utilities distribute devices free of charge.Professional installer networks expand as device complexity and cross system integration rise. Johnson Controls’ installer certification program standardizes deployments, ensuring performance consistency. Insurance linked distribution adds another layer, blending product acquisition with policy enrollment. Altogether, diversified channels fortify resilience against single point disruptions, supporting the Canada smart home market’s forward momentum.
By End User Dwelling: Multi Family Acceleration Drives Market Evolution
Single Family residences comprised 60.95% of the Canada smart home market size in 2025, benefiting from higher discretionary spending and simpler decision pathways. Momentum is shifting: Multi Family dwellings are forecast to climb at 13.18% CAGR as retrofit funding and new build codes require embedded smart infrastructure. British Columbia’s Strata Energy Advisor program steers 8,000 aging condominiums toward connected thermostats and heat pumps.Retrofit complexity remains a barrier; condo owners must negotiate shared assets and limited ductwork. CBC reports that heat pump adoption in condos is frequently blocked by structural constraints. Builders of new rental towers increasingly pre wire units to achieve differentiating green certifications, integrating EV chargers, leak sensors, and parcel management systems. Hospitality and short term rentals also absorb smart devices to automate turnovers and energize guest experiences, further expanding the Canada smart home industry footprint.
Geography Analysis
Ontario anchors the Canada smart home market through a USD 10.9 billion slate of efficiency programs, including an expanded Peak Perks thermostat incentive and a 30% Home Renovation Savings rebate. Toronto’s tech cluster, high household incomes, and maturing broadband coverage create fertile ground for premium ecosystems, though condominium retrofits require creative low voltage solutions to circumvent dated wiring. Grid forecasts showing 40% load growth in 20 years give utilities the mandate to drive connected device penetration, ensuring steady demand for thermostats, load controllers, and behind the meter storage.
Quebec presents distinct dynamics shaped by Hydro Québec’s free thermostat scheme, French language interface mandates, and a privacy regime more stringent than federal PIPEDA. Montreal’s AI corridor, highlighted by Trane Technologies’ acquisition of BrainBox AI, feeds intellectual capital into residential energy management. Device makers willing to localize firmware and documentation position themselves to win sizable volume tied to the 1 million unit thermostat target.British Columbia’s wildfire challenges push adoption of smart smoke and evacuation sensors. Its Zero Emissions Innovation Centre supports condo retrofits, a segment representing thousands of energy inefficient multi family buildings. Alberta and the Prairie provinces leverage federal clean tech funds to integrate smart home elements into community microgrids, often led by Indigenous partnerships. Atlantic provinces and the North trail in sheer volume but benefit from the Canada Housing Infrastructure Fund, which finances broadband ready housing that is smart home capable by design.Collectively, regional policy asymmetry means vendors must tailor go to market tactics: utility alignment in Ontario, regulatory localization in Quebec, resilience marketing in British Columbia, and subsidy driven pilots in emerging Atlantic and northern territories. Such provincial nuances continue to sculpt adoption curves across the Canada smart home market.
Competitive Landscape
Competition remains moderate as Big Tech ecosystems vie with specialized Canadian entrants. Amazon, Google, and Apple monetize through voice AI, subscription services, and device platforms that anchor customer lock in. Ecobee stands out locally; since its Generac acquisition, the firm’s thermostats form a pivot into residential backup power, underpinning peak shaving strategies. Nanoleaf differentiates with design centric lighting but faces tariff driven cost pressures on China sourced components.
Johnson Controls and Honeywell leverage decades of building automation IP to bridge commercial and residential segments. Johnson Controls’ OpenBlue suite claims up to 30% utility savings, signaling corporate ambition well beyond security panels. Samsung partners with ABB to embed energy dashboards directly into appliances, combining hardware scale with industrial controls know how. Emerging AI start ups in Montreal and Toronto exploit federal compute grants to develop edge native analytics that respect domestic data sovereignty rules, carving niches in privacy sensitive households.
Standardization around Matter lowers entry barriers for innovative SMEs, enabling them to interoperate with dominant hubs without costly proprietary stacks. Price competition intensifies at mass market price points, though professional service layers monitoring, preventative maintenance, energy optimization create defensible recurring revenue streams. These dynamics collectively define a Canada smart home market that rewards both ecosystem breadth and specialized depth.
Canada Smart Home Industry Leaders
Schneider Electric SE
Ecobee
TELUS International
ABB Ltd.
Johnson Controls
- *Disclaimer: Major Players sorted in no particular order


Recent Industry Developments
- May 2025: Ottawa published Amendment 18 to Energy Efficiency Regulations, adding compressors, faucets, and pool pumps to the regulated list.
- April 2025: Johnson Controls connected PowerManage with IQ Panel 4 to enable local data storage and simpler installs.
- March 2025: Johnson Controls unveiled IQ Panel 5 with a 13 megapixel camera and PowerG+ wireless security.
- March 2025: Canadian government closed a USD 240 million investment in Cohere’s USD 725 million AI data center project to bolster domestic compute resources.


Research Methodology Framework and Report Scope
Market Definitions and Key Coverage
Our study defines the Canada smart home market as all network-enabled devices, hubs, and embedded sensors that allow Canadian residents to remotely monitor, automate, or control household functions through IP-based links. This spans security cameras, smart speakers, thermostats, lighting, appliances, and supporting software resident in single- and multi-family dwellings.
Scope exclusion: purely commercial building automation systems and stand-alone professional monitoring service revenues are kept outside our scope.
Segmentation Overview
- By Product Type
- Comfort and Lighting
- Control and Connectivity
- Energy Management
- Home Entertainment
- Security
- Smart Appliances
- HVAC Control
- By Technology
- Wi-Fi
- Bluetooth
- Zigbee / Thread
- Other Protocols (Z-Wave, LTE-M, etc.)
- By Sales Channel
- Direct-to-Consumer
- Retail
- Utility
- Professional Installer
- By End-user Dwelling
- Single-Family Homes
- Multi-Family
- Hospitality and Short-Term Rental
Detailed Research Methodology and Data Validation
Primary Research
Mordor analysts interviewed device OEM product managers, provincial energy-utility program heads, telecom bundle leads, certified installers, and real-estate professionals across Ontario, Québec, British Columbia, Alberta, and Atlantic provinces. These conversations validated penetration estimates, clarified average selling prices, and flagged behavioral barriers that pure desk research could not surface.
Desk Research
We first mapped the universe of potential devices using openly published data from agencies such as Statistics Canada, Natural Resources Canada, the Canadian Radio-television and Telecommunications Commission, the Canadian Energy Regulator, and the Insurance Bureau of Canada. Shipment trends and unit pricing were then refined through company filings, investor decks, industry association releases, and selected paid databases including D&B Hoovers for company financials and Dow Jones Factiva for news verification. A small set of customs records and patent filings helped us spot upcoming technologies and adjust long-range assumptions. The sources listed illustrate the breadth of the secondary pool; many complementary references were reviewed to finalize every datapoint.
Market-Sizing & Forecasting
A top-down model begins with the count of broadband households by province and applies device penetration ratios that vary by dwelling type, followed by average system price curves. Bottom-up roll-ups of sampled shipments and retail scans serve as reasonableness checks. Key variables include new housing starts, household disposable income, electricity price index, 5Gcoverage, and ASP shifts from Wi-Fi 6 to Matter-ready chips. A multivariate regression links these drivers to historic uptake, producing the base forecast, which is then stress-tested with three adoption scenarios before sign-off.
Data Validation & Update Cycle
Outputs pass a two-analyst variance review, peer comparison, and anomaly flagging in a shared dashboard. We refresh the model annually and trigger interim updates for material events such as sudden incentive changes or major security vulnerabilities. A final accuracy sweep is completed just before publication.
Why Our Canada Smart Home Baseline Commands Reliability
Market estimates published by different firms often diverge because each chooses its own scope, price stacks, and refresh cadence.
Key gap drivers include whether aftermarket installation labor, multi-dwelling wiring, or subscription platform fees are counted; the aggressiveness of assumed device ASP deflation; and how frequently models are refreshed to capture rebate rollouts and currency swings.
Benchmark comparison
| Market Size | Anonymized source | Primary gap driver |
|---|---|---|
| USD 4.18 B (2025) | Mordor Intelligence | - |
| USD 9.07 B (2024) | Global Consultancy A | Includes premium install services and bundled warranties, inflating value |
| USD 3.10 B (2024) | Regional Consultancy B | Focuses only on connected white-goods; omits security and energy devices |
| USD 8.29 B (2024) | Trade Journal C | Relies on household spend surveys without device-level splits or legacy adjustment |
The comparison shows that, by selecting a clear device scope, blending top-down penetration logic with shipment reality checks, and updating figures every year, Mordor delivers a balanced and reproducible baseline that decision-makers can trust.


Key Questions Answered in the Report
What is the current value of the Canada smart home market?
The market stands at USD 4.59 billion in 2026.
How fast will the Canada smart home market grow by 2031?
It is projected to expand at a 9.96% CAGR, reaching USD 7.39 billion by 2031.
Which product segment leads the Canada smart home industry?
Security devices hold the largest 2025 revenue share at 16.45%.
Why are Canadian utilities giving away smart thermostats?
Programs in Ontario and Quebec use free or subsidized thermostats to reduce peak load and improve grid reliability while lowering consumer bills.
How do privacy laws affect smart home adoption in Canada?
Provincial rules, especially in Quebec and British Columbia, require strict data residency and consent standards, pushing manufacturers toward edge processing and localized data storage.
What role do telecom companies play in smart home growth?
Telcos like TELUS bundle energy management services with broadband, driving a 13.95% CAGR in the Utility/Telco channel and enhancing customer retention.
Page last updated on:


