
Market Overview
| Study Period | 2020 - 2031 |
|---|---|
| Forecast Data Period | 2026 - 2031 |
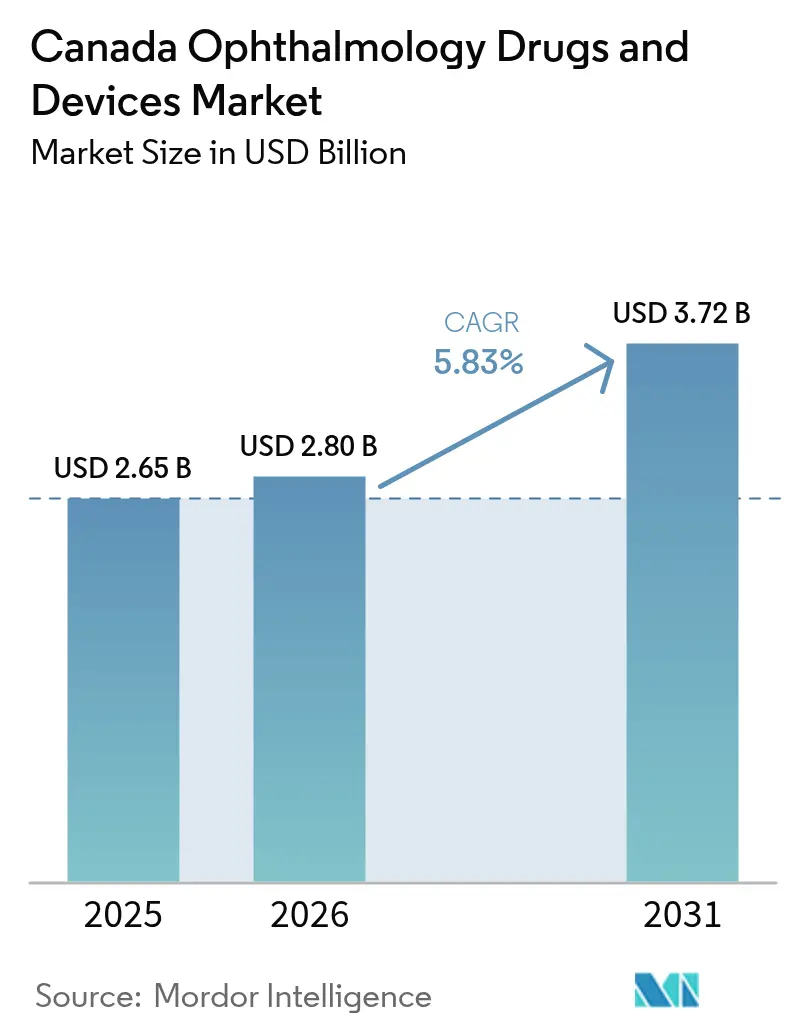
| Base Year Market Size (2025) | USD 2.65 Billion |
| Market Size (2026) | USD 2.8 Billion |
| Market Size (2031) | USD 3.72 Billion |
| Growth Rate (2026 - 2031) | 5.83 % |
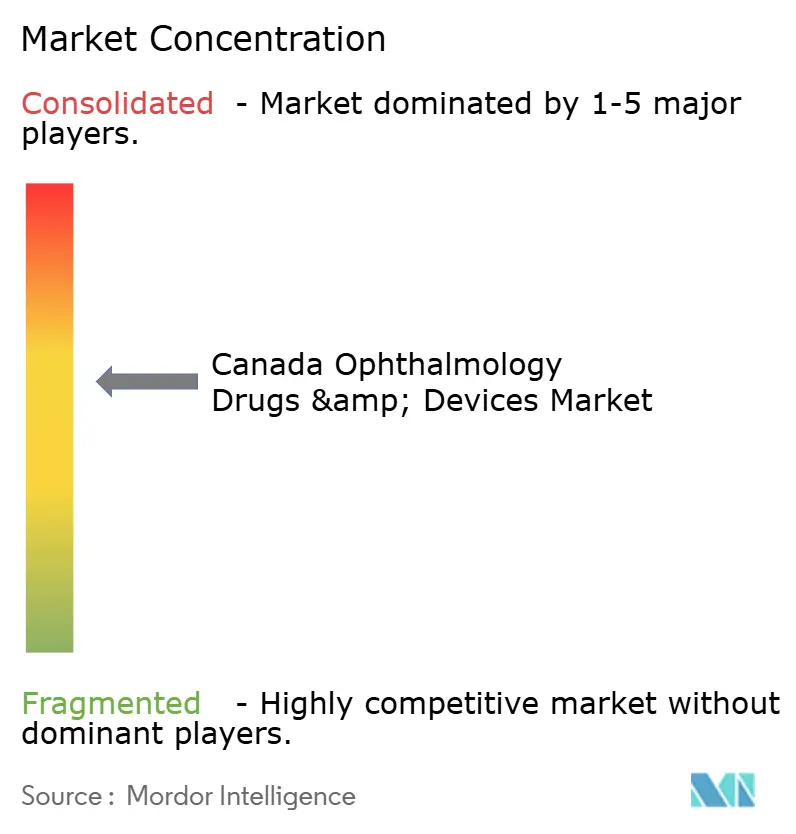
| Market Concentration | Medium |
Major Players *Disclaimer: Major Players sorted in no particular order Image © Mordor Intelligence. Reuse requires attribution under CC BY 4.0. | |
Canada Ophthalmology Drugs & Devices Market Analysis by Mordor Intelligence
The Canada ophthalmology drugs & devices market size in 2026 is estimated at USD 2.8 billion, growing from 2025 value of USD 2.65 billion with 2031 projections showing USD 3.72 billion, growing at 5.83% CAGR over 2026-2031. Rising provincial reimbursement for advanced imaging and the arrival of lower-priced biosimilar anti-VEGF agents are expanding patient access, while hospital and ambulatory sites adopt lean surgical models that cut episode-of-care costs. Suppliers of portable diagnostics are finding new demand in remote and Indigenous communities, and multinational manufacturers are reinforcing their pipelines through targeted acquisitions that accelerate entry into cell and gene therapies. At the same time, procurement rules that favor sustainable supply chains are nudging device makers to localize assembly and documentation.
Key Report Takeaways
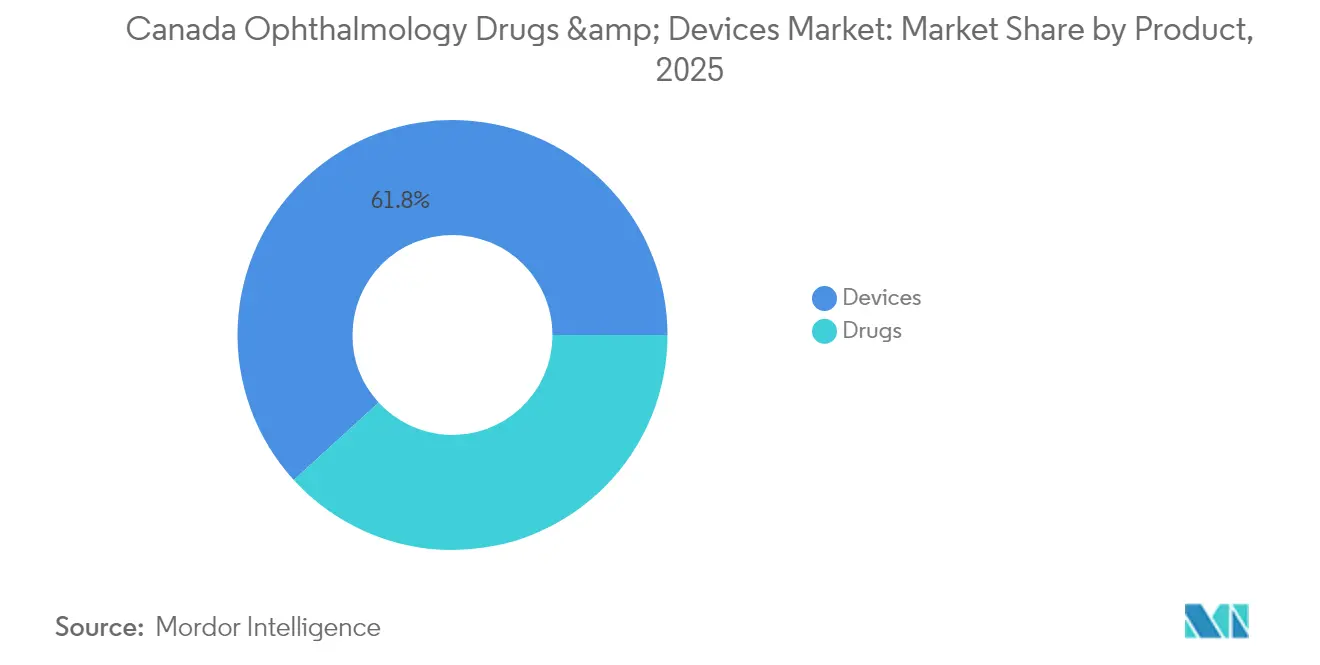
- By product, devices led with 61.78% revenue share of the Canada ophthalmology drugs & devices market in 2025, while diagnostic & monitoring devices are projected to expand at a 7.78% CAGR through 2031.
- By drug class, glaucoma drugs captured 44.89% of 2025 sales; dry-eye drugs are forecast to grow at a 7.22% CAGR over 2026-2031.
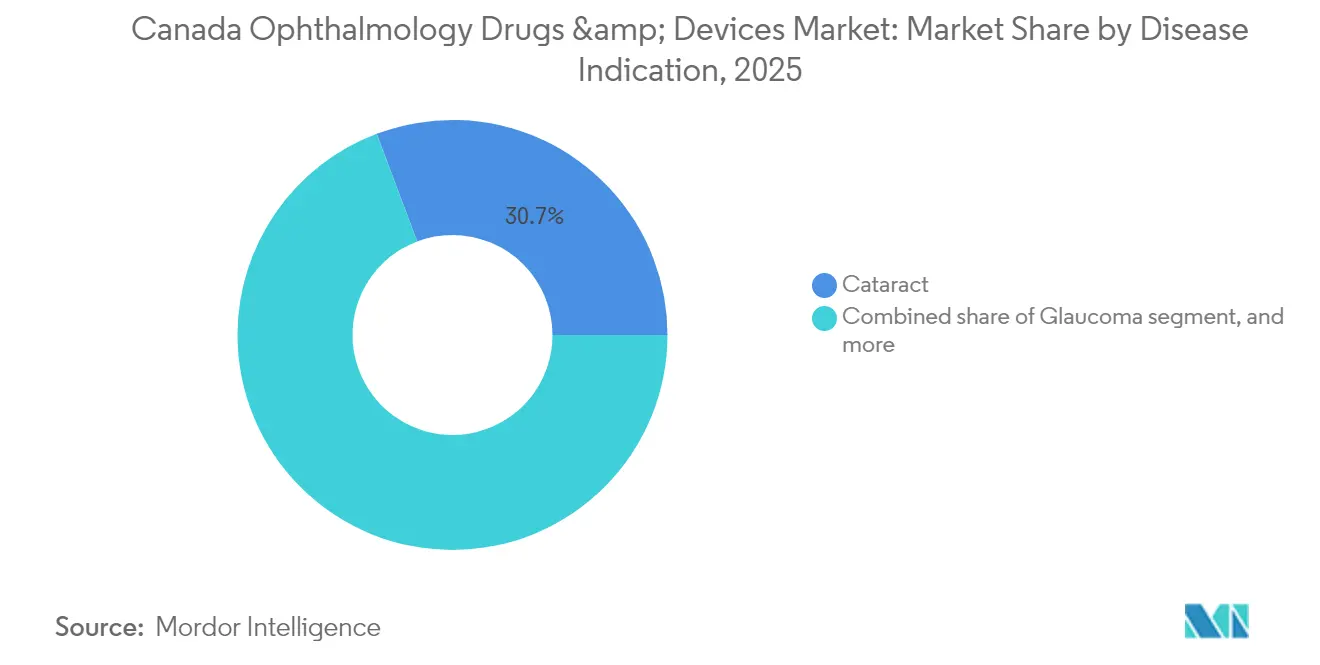
- By disease indication, cataract accounted for 30.74% of spending in 2025, whereas diabetic retinopathy is expected to register a 6.95% CAGR to 2031.
- By end-user, hospitals held 44.62% share in 2025, while ambulatory surgery centers are set to increase at a 6.86% CAGR during the forecast period.
Note: Market size and forecast figures in this report are generated using Mordor Intelligence’s proprietary estimation framework, updated with the latest available data and insights as of 2026.
Canada Ophthalmology Drugs & Devices Market Trends and Insights
Drivers Impact Analysis*
| Driver | % Impact on CAGR Forecast | Geographic Relevance | Impact Timeline |
|---|---|---|---|
| Provincial adoption of advanced imaging reimbursement codes | +1.2% | Ontario & British Columbia; spillover to Alberta and Quebec | Medium term (2-4 years) |
| Accelerated Health Canada approvals for biosimilar anti-VEGF agents | +0.9% | National, early uptake in Ontario, Quebec and British Columbia | Short term (≤2 years) |
| Indigenous vision-screening programs driving portable diagnostics uptake | +0.8% | Northern territories, Ontario, Manitoba, Saskatchewan | Medium term (2-4 years) |
| National Pharmacare negotiations encouraging rare-disease gene-therapy investment | +0.7% | National, concentrated in Ontario and Quebec research hubs | Long term (≥4 years) |
| Rising childhood myopia rates fueling refractive-management demand | +0.6% | Urban centers nationwide | Medium term (2-4 years) |
| Post-pandemic cataract-surgery backlog boosting surgical-device utilization | N/A | National, highest in provinces with long wait-lists | Short term (≤2 years) |
| Source: Mordor Intelligence | |||
Provincial Adoption of Advanced Imaging Reimbursement Codes in Ontario & British Columbia
The March 2025 update to Ontario’s Schedule of Benefits raised reimbursements for optical coherence tomography and fundus photography by 12%, spurring clinics to invest in next-generation scanners. Early data show a 23% jump in glaucoma and diabetic-retinopathy detection, and vendors of handheld OCT units report double-digit order growth as community optometrists qualify for the new fees[1]Ontario Ministry of Health, “Schedule of Benefits for Physician Services – March 2025 Update,” health.gov.on.ca. British Columbia’s Medical Services Plan created tiered fees that reward community-based screening, shifting volumes from tertiary hospitals to smaller practices and broadening the installed base for imaging hardware.
Accelerated Health Canada Approvals for Biosimilar Anti-VEGF Agents
Ranibizumab biosimilar FYB201 entered the Canadian formulary in late 2023, and aflibercept follow-on Yesafili is cleared for July 2025 launch. Ten provinces have adopted mandatory biosimilar switching in public drug plans, triggering a 15-20% price drop for retinal injections. Surveys by the Canadian Ophthalmology Society show 80% of specialists accept biosimilars as a route to wider access while seeking to retain prescribing freedom.
Indigenous Vision-Screening Programs Driving Portable Diagnostics Uptake in Northern Canada
The CAD 1.7 million Indigenous Children’s Eye Examination program blends on-site visits, tele-ophthalmology and local workforce training. More than 800 screenings since February 2024 indicate three in four children require corrective lenses. Manufacturers are ruggedizing tablet-based autorefractors to tolerate Arctic temperatures, creating a niche segment that links community health funding with commercial demand[2]CNIB, “Indigenous Children’s Eye Examination Program Report 2025,” cnib.ca.
Rising Childhood Myopia Rates Fueling Demand for Refractive Management Solutions
Prevalence of myopia among pupils aged 11-13 has climbed to nearly 30%, up 50% in two decades. The Canadian Association of Optometrists’ 2024 campaign, backed by Alcon and CooperVision, broadcast evidence that daily-disposable dual-focus lenses can cut axial elongation by more than half. Eyenovia’s MicroPine spray, re-acquired for North American development, could become the first topical therapy aimed at slowing progression in an estimated 5 million at-risk children[3]Canadian Association of Optometrists, “Children’s Vision Month Campaign Toolkit 2024,” opto.ca.
Restraints Impact Analysis*
| Restraints Impact Analysis | (~) % Impact on CAGR Forecast | Geographic Relevance | Impact Timeline |
|---|---|---|---|
| Provincial cost caps on premium intraocular lenses | –0.5% | Ontario, British Columbia, Quebec | Medium term (2-4 years) |
| Shortage of ophthalmic surgeons in Atlantic Canada | –0.4% | Nova Scotia, New Brunswick, Prince Edward Island, Newfoundland and Labrador | Short term (≤2 years) |
| Cross-border supply-chain vulnerabilities causing device stock-outs | –0.3% | National, stronger effect in smaller provinces | Short term (≤2 years) |
| Hospital sustainability procurement rules raising import-compliance costs | –0.2% | National, early enactment in Ontario and British Columbia | Medium term (2-4 years) |
| Source: Mordor Intelligence | |||
Provincial Cost Caps on Premium Intraocular Lenses Curtailing Adoption
Ontario’s Health Insurance Plan reimburses only monofocal lenses, leaving patients to self-pay the full upgrade cost for toric or multifocal optics. A 2024 population-based study found surgery volumes rose for residents in the wealthiest quintile but fell for the lowest, underscoring a two-tier pattern in access. Manufacturers now tailor go-to-market models toward high-volume private clinics that can navigate mixed-billing rules.
Shortage of Ophthalmic Surgeons in Atlantic Canada Limiting Procedure Volume
Prince Edward Island, Nova Scotia and New Brunswick report cataract waits exceeding the 112-day benchmark for most patients. Governments are piloting contracts with private centers to add capacity: New Brunswick’s Horizon Health Network expects 3,200 extra cataract cases a year through its Fredericton partner, yet workforce recruiting remains difficult.
*Our forecasts treat driver/restraint impacts as directional, not additive. The impact forecasts reflect baseline growth, mix effects, and variable interactions.
Segment Analysis
By Product: Devices Command Scale, Diagnostics Propel Momentum
Devices generated USD 1.64 billion in revenue and represented 61.78% of the Canada ophthalmology drugs & devices market in 2025. Surgical platforms for cataract extraction still dominate device value, leveraging public-private centers in New Brunswick that target thousands of extra cases annually. Diagnostic and monitoring equipment is the fastest-advancing slice, logging an 7.78% CAGR as reimbursement for OCT and ultra-widefield fundus imaging broadens. Ontario’s 12% fee bump for retinal scans, for instance, has already spurred community optometrists to order compact OCT units, extending reach beyond tertiary hospitals. Device makers are also integrating tele-ophthalmology modules so northern clinics can transmit images for remote grading, meeting demand triggered by Indigenous vision programs.
Drugs delivered USD 1,012.8 million in 2025 sales. Anti-VEGF agents for retinal disease are the growth locomotive as biosimilars compress prices and provincial formularies embrace mandatory switching. Health Canada’s green light for ranibizumab FYB201 and pending approval of aflibercept Yesafili lower payer outlays and create headroom to treat more patients. Glaucoma drug volumes hold steady, yet surgeons increasingly pair medication with minimally invasive implantable devices such as the Hydrus Microstent, which a 2025 Canadian cost study showed produced 9.351 QALYs at CAD 26,770—less than cataract surgery alone.



By Disease Indication: Cataract Prevails, Retinopathy Gains Traction
Cataract captured 30.74% of 2025 spending, reflecting its status as the most common ocular surgery and the backbone of surgical-device revenue. Manitoba’s wait-time dashboard listed more than 3,100 patients queued for cataract operations, with median waits of 6-9 weeks—a level that continues to fuel throughput investments. Innovation focuses on premium intraocular lenses and femtosecond laser platforms, although cost caps in large provinces temper premium adoption rates.
Diabetic retinopathy is projected to grow at a 6.95% CAGR, powered by national diabetes incidence and earlier screening. Consensus guidelines released in 2024 highlight personalized injection intervals and systemic-risk management, spurring demand for imaging and anti-VEGF therapy. Glaucoma remains substantial as novel shunts such as XEN Gel and PreserFlo Microshunt reshape management for moderate disease. Age-related macular degeneration markets gain from the approval of avacincaptad pegol for geographic atrophy, while regulatory reviews for dual-pathway antibodies such as faricimab enlarge future options.
By End User: Hospitals Anchor Care, Ambulatory Centers Accelerate
Hospitals accounted for 44.62% of the Canada ophthalmology drugs & devices market size in 2025, safeguarded by integrated diagnostic, surgical and pharmacy services under global budgets. They continue to absorb complex corneal transplants and vitreoretinal surgeries, yet face efficiency pressure from multi-year elective-surgery backlogs. Provincial funding agreements now reward centers that adopt day-surgery cataract pathways, compressing in-patient length of stay.
Ambulatory surgery centers (ASCs) posted the highest growth rate at 6.86% CAGR. Provinces encourage these facilities because they clear surgical queues at lower per-case costs and free hospital operating rooms for emergent work. Private-clinical partners operating under public contracts in Atlantic Canada exemplify this model, delivering volume while maintaining fee-schedule parity. Specialty ophthalmic clinics thrive in urban belts where demand for refractive and premium cataract services supports higher self-pay ratios. Tele-ophthalmology hubs linked to northern nursing stations form a fourth end-user tier, reinforcing equity in access.
By Drug Class: Glaucoma Dominates as Dry Eye Accelerates
Glaucoma therapies generated the most significant slice of revenue in 2025, capturing 44.89% of the Canada ophthalmology drugs & devices market share through a broad mix of prostaglandin analogs, fixed-dose combinations and emerging sustained-release implants. Hospital formularies continue to list branded latanoprost and brimonidine–timolol combinations as first-line options, yet specialists are rapidly adopting micro-dose bimatoprost and biodegradable drug-delivery inserts that cut adherence risk. These innovations, combined with rising disease prevalence among adults over 60, anchor glaucoma’s steady contribution to the Canada ophthalmology drugs & devices market size and help stabilize overall drug revenues during the forecast horizon.
Dry-eye drugs form the fastest-growing class, on track for a 7.22% CAGR from 2026 to 2031 as environmental stressors, screen time and an aging population lift diagnosis rates. Cyclosporine and lifitegrast eye drops remain the mainstays, but next-generation agents that target tear-film osmolarity and neuro-trophic pathways are moving through Health Canada review, signaling a diversified pipeline. Manufacturers are also testing preservative-free multi-dose bottles and micro-mist delivery to improve tolerability, features that resonate with patients who struggle with chronic instillation regimens.
Regulatory Landscape
Health Canada is the primary regulator for ophthalmology drugs, medical devices, and drug-device combination products under the Food and Drugs Act, with implementing requirements set through the Food and Drug Regulations and the Medical Devices Regulations (SOR/98-282). Drug-device combination products are routed through a single pathway depending on the principal mechanism of action (PMOA), meaning the lead component drives whether the submission is handled as a drug file or a device license, and sponsors can seek a formal classification decision from Health Canada prior to filing to reduce rework and timeline risk. On the device side, evidence requirements scale with device risk class (Class I to Class IV), and manufacturers can use Health Canada-recognized standards supported by a Declaration of Conformity to demonstrate compliance. Health Canada also published draft guidance on co-packaged drug products for public consultation in March 2025 (open through May 18, 2025), an area that intersects with how kits and combination offerings are positioned and documented for market authorization.
Competitive Landscape
Multinational manufacturers occupy the top tiers of the Canada ophthalmology drugs & devices market, but competition is intensifying as biosimilar entrants and diagnostic start-ups gain footholds. Alcon reinforced its cataract and cornea franchise by taking a majority stake in Aurion Biotech in March 2025, securing AURN001 cell therapy that can yield multiple endothelial graft doses from one donor cornea and is slated for Phase 3 trials later this year. Johnson & Johnson Vision continues to integrate its TECNIS Synergy IOL range with digital planning tools, while Bausch Health leverages domestic manufacturing to respond quickly to provincial tenders.
In the retinal-therapy space, the arrival of biosimilar ranibizumab and forthcoming aflibercept options have already trimmed injection prices by up to 20%, pressuring originators such as Roche’s Genentech. Biocon Biologics partnered with Apotex for national commercial reach, showcasing a playbook that combines global biologics capacity with local distribution. Diagnostic imaging sees fresh entrants: EssilorLuxottica acquired Toronto-based Cellview Imaging in February 2025, adding an ultra-widefield retinal camera that captures 133-degree views in one shot.
Regional specialists focus on niche gaps. Aequus Pharmaceuticals licensed the Paul Glaucoma Drainage Device to supply complex refractory cases. Canadian start-ups that tailor portable autorefractors and slit-lamp modules to remote conditions benefit from federal Indigenous-health grants that offset early adoption costs. Sustainable-procurement directives taking effect in large hospital systems further reshape vendor selection, pushing multinationals to issue carbon-footprint disclosures and to evaluate localized packaging lines for the Canada ophthalmology drugs & devices market.
Canada Ophthalmology Drugs & Devices Industry Leaders
Alcon Inc.
Carl Zeiss Meditec AG
Bausch Health Companies Inc.
Johnson & Johnson Vision Care
Novartis AG
- *Disclaimer: Major Players sorted in no particular order

Market Opportunities and Future Outlook
Near-term whitespace in Canada centers on lower-cost retinal biologics and workflow upgrades that expand throughput across community clinics, hospitals, and ambulatory settings. Biosimilar momentum has moved beyond ranibizumab into aflibercept: Sandoz Canada launched Enzeevu (aflibercept) in February 2026 for retinal indications including neovascular age-related macular degeneration and diabetic macular edema, reinforcing payer and provider pathways already shaped by provincial biosimilar switching rules and the observed injection price compression referenced in the market context. On the device and procedure side, procurement is increasingly tied to productivity and standardization, creating openings for integrated surgical and diagnostic platforms and for products that reduce chair time. Alcon launched the UNITY Cataract System in Canada in June 2026, and ZEISS expanded its ophthalmic workflow portfolio in Canada in March 2026 (including new refraction devices such as VISUREF 600 and VISUCORE 500), aligning with provincial reimbursement actions that have increased utilization of OCT and fundus imaging in community settings. In parallel, portable diagnostics linked to Indigenous vision-screening programs continue to translate public funding into commercial demand for rugged, tele-ophthalmology-enabled tools, offering a route for manufacturers to scale deployments beyond urban centers while meeting documentation and sustainability requirements embedded in hospital procurement.
Recent Industry Developments
- June 2026: Alcon launched the UNITY Cataract System (CS) in Canada, announcing availability at the Canadian Ophthalmological Society meeting in Montreal, Quebec. The launch expands Alcon's integrated cataract workflow footprint and supports provider efforts to increase surgical throughput under provincial backlog reduction and day-surgery efficiency programs.
- July 2025: Alcon received Health Canada approval for the UNITY Vitreoretinal Cataract System (VCS). The approval strengthens competition in premium surgical platforms by enabling a broader installed base for a combined cataract and vitreoretinal workflow architecture in Canadian operating rooms.
- May 2024: Bausch + Lomb received Health Canada approval for the enVista Envy full visual range intraocular lens (IOL). The approval added another premium IOL option for cataract patients, while provincial cost caps on premium lenses kept commercialization strategies focused on clinics with established mixed-billing and self-pay pathways.


Research Methodology Framework and Report Scope
Market Definition and Coverage
For this study, the market covers revenues generated in Canada from ophthalmic drugs and ophthalmic devices used to prevent, diagnose, or treat eye conditions, across prescription and nonprescription channels where applicable.
Scope exclusions: We do not count general consumer vision care items that are not positioned for eye disease management, such as routine fashion eyewear and basic accessories.
Segmentation Overview
- By Product
- Devices
- Diagnostic & Monitoring Devices
- OCT Scanners
- Fundus & Retinal Cameras
- Autorefractors & Keratometers
- Corneal Topography Systems
- Ultrasound Imaging Systems
- Perimeters & Tonometers
- Other Diagnostic & Monitoring Devices
- Surgical Devices
- Cataract Surgical Devices
- Vitreoretinal Surgical Devices
- Refreactive Surgical Devices
- Glaucoma Surgical Devices
- Other Surgical Devices
- Vision Care Devices
- Spectacles Frames & Lenses
- Contact Lenses
- Diagnostic & Monitoring Devices
- Drugs
- Glaucoma Therapeutics
- Retinal Disorder Therapeutics (Anti-VEGF & Others)
- Dry Eye Therapeutics
- Allergic Conjunctivitis & Inflammatory Therapeutics
- Other Ophthalmic Drugs
- Devices
- By Drug Class
- Glaucoma Drugs
- Retinal Disorder Drugs
- Dry Eye Drugs
- Allergic Conjunctivitis and Inflammation Drugs
- Other Drug Classes
- By Disease Indication
- Cataract
- Glaucoma
- Diabetic Retinopathy
- Other Disease Indications
- By End-user
- Hospitals
- Specialty Ophthalmic Clinics
- Ambulatory Surgery Centers (ASCs)
- Other End-users
Data Sources, Market Sizing, and Validation
Desk Research
Desk work started by mapping the care pathway for eye conditions in Canada, and then linking it to product use in clinics, hospitals, and retail settings. We relied on public health and utilization signals such as Statistics Canada, the Canadian Institute for Health Information, and Health Canada publications to anchor patient volumes and procedure context.
Next, pricing and reimbursement context was reviewed using sources such as provincial drug formularies, public procurement notices, and peer reviewed clinical and health economics articles. Company filings, investor presentations, and reputable press were used to cross check product launches and therapy shifts, and paid subscriptions for company financials and for patent and innovation tracking were used to validate timelines and category emphasis. These desk sources are not exhaustive, and we used additional public references for data collection, validation, and clarification.
Primary Interviews and Surveys
Primary inputs came from interviews and structured surveys with stakeholders such as ophthalmologists, optometrists, hospital pharmacists, clinic procurement teams, and device distribution specialists across Canada. The respondent input helped confirm treatment intensity, product mix shifts, and average selling price movements, and then we used it to challenge any desk based assumptions that looked too optimistic or too conservative.
Distribution of primary research fieldwork respondents
| Company type | Respondent position |
|---|---|
| Top tier: 36% | CXOs: 19% |
| Mid tier: 44% | Functional/Unit leaders: 33% |
| Smaller Players: 20% | Managers: 48% |
Market-Sizing & Forecasting
Sizing was built using a mixed approach. The top down view was formed by reconstructing the demand pool from eye disease burden and care activity in Canada, and then applying realistic adoption and spend patterns for drugs and devices used at each step of care. After totals were obtained, they were corroborated with selective bottom up checks, such as sampled product category revenues, channel checks on unit volumes, and ASP times volume approximations, which are then used to adjust any overstatement.
Key inputs (illustrative) included cataract and retina procedure levels, treated glaucoma and dry eye patient pools, contact lens and intraocular lens replacement cycles, public reimbursement access signals, and the pace of premium product uptake that shifts the average price per unit. Forecasting was handled through scenario analysis supported by expert feedback, because near term demand is tied to procedure recovery, therapy switching, and pricing actions that do not always move in a straight line. Where bottom up evidence was incomplete for a niche category, we used proxy utilization rates from similar product groups and then stress tested the assumption ranges in interviews.
Data Validation & Update Cycle
Outputs were checked in several passes so that odd jumps get explained before finalization. We compared the final totals against independent signals like procedure trends, reimbursement access changes, and category growth patterns seen in public reporting, and then re-ran the model if a variance was outside a reasonable band.
Before sign off, another analyst reviews assumptions, units, and currency treatment to confirm the logic is repeatable. Reports are refreshed annually, with interim updates when material events occur such as major approvals, policy changes, or pricing shifts, and a final pre delivery review is done so the latest information is reflected.
Mordor Intelligence's Canada Ophthalmic Drugs Devices Market Size Versus Other Published Estimates
Published market sizes for Canada in this space do not always match because studies draw the boundary differently, and they may also use different base years and pricing logic. Differences also come from how much weight is given to real world care activity versus product shipment style assumptions.
Procedure volumes and treated patient pool checks, combined with provincial formulary access signals, are the evidence points that keep Mordor Intelligence tied to what is actually used in Canadian eye care settings, instead of counting adjacent consumer vision spending. The spread usually widens when other estimates blend broader eye care items, apply faster premiumization, or convert currencies using a different timing window.
Benchmark comparison
| Source | Market Size | Gaps in Research Methodology |
|---|---|---|
| Mordor Intelligence | USD 2.65 B (2025) | |
| Market Research Publisher A | USD 2.50 B (2024) | Uses a different base year and a longer forecast window, and the scope description suggests a wider mix of vision care device categories, which can shift the starting value downward or upward depending on what is counted as medical. |
| Market Research Publisher B | USD 3.43 B (2024) | Appears to include broader ophthalmology revenue pools beyond drugs and clinical devices, and it likely applies different ASP progression assumptions for premium devices, which can inflate the 2024 level versus a care activity anchored model. |
Overall, the table shows that scope boundaries and starting year choices explain most of the difference, and pricing progression assumptions explain the rest. By keeping inputs traceable to demand signals and then cross checking with practical bottom up approximations, the final number stays easier to reproduce and update in the next refresh cycle.


Key Questions Answered in the Report
What is the current value of the Canada ophthalmology drugs & devices market?
The market generated USD 2.8 billion in 2026 and is projected to reach USD 3.72 billion by 2031, implying a 5.83% CAGR.
Which product category holds the largest share?
Devices account for 61.78% of revenue, with surgical platforms leading value and diagnostics recording the fastest growth.
Why are biosimilar anti-VEGF agents important for Canada?
Their accelerated approval has reduced injection costs by up to 20%, allowing provinces to treat more retinal-disease patients within existing budgets.
How are Indigenous communities influencing market demand?
Federal funding for vision-screening programs in northern regions is driving uptake of portable, tele-medicine-enabled diagnostic devices.
What is driving the rapid growth of ambulatory surgery centers?
Provinces contract ASCs to shorten cataract wait lists and lower overall procedure costs, creating a 6.86% CAGR opportunity through 2031.
Which disease segment is expanding fastest?
Which disease segment is expanding fastest? Diabetic retinopathy leads growth with a forecast 6.95% CAGR, supported by higher diabetes prevalence and broader screening.
Page last updated on:





