
Market Overview
| Study Period | 2020 - 2031 |
|---|---|
| Forecast Data Period | 2026 - 2031 |
| Base Year Market Size (2025) | USD 16.65 Billion |
| Market Size (2026) | USD 17.63 Billion |
| Market Size (2031) | USD 24.11 Billion |
| Growth Rate (2026 - 2031) | 6.46 % |
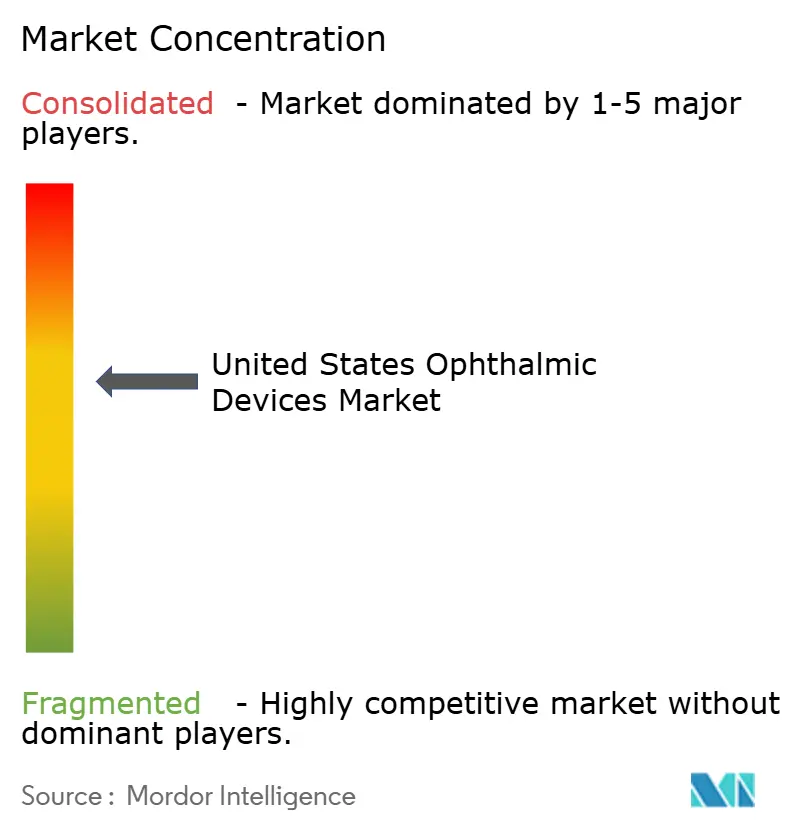
| Market Concentration | Medium |
Major Players *Disclaimer: Major Players sorted in no particular order Image © Mordor Intelligence. Reuse requires attribution under CC BY 4.0. | |
United States Ophthalmic Devices Market Analysis by Mordor Intelligence
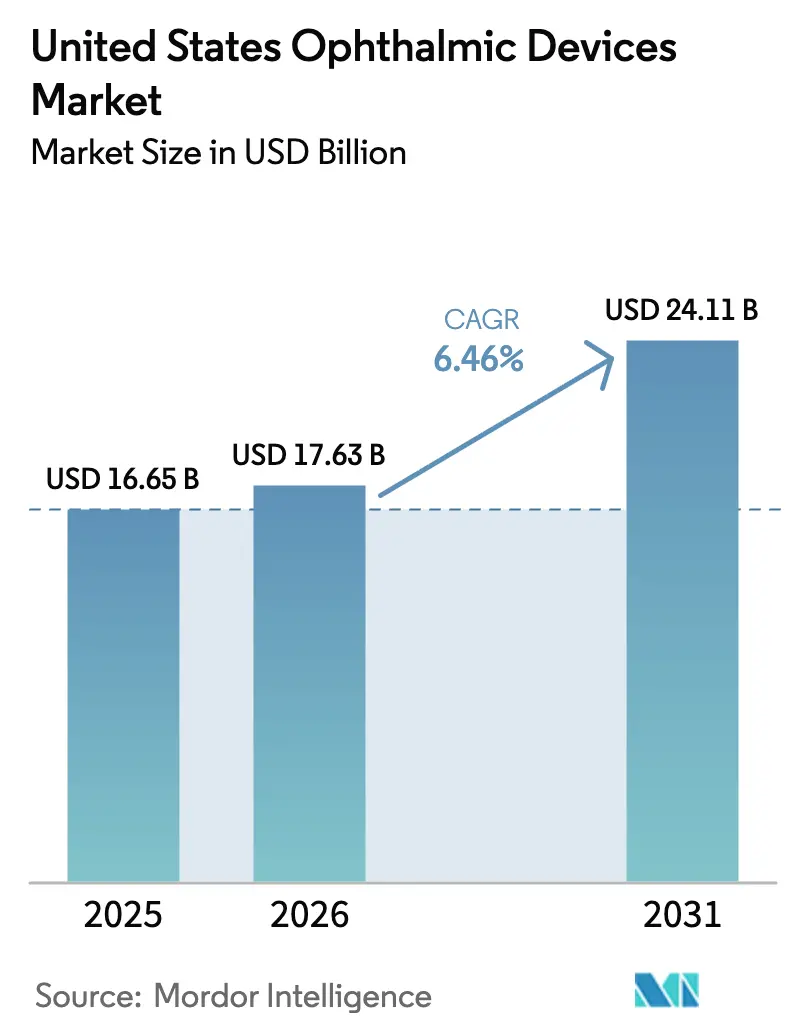
The United States Ophthalmic Devices Market size is projected to be USD 16.65 billion in 2025, USD 17.63 billion in 2026, and reach USD 24.11 billion by 2031, growing at a CAGR of 6.46% from 2026 to 2031.
A sharp rise in cataract volumes among seniors, an expanding diabetic and glaucoma population, and the rapid adoption of autonomous artificial-intelligence screening tools are reinforcing sustained demand. Device makers are pivoting toward ambulatory surgery centers (ASCs), which now handle most routine cataract and minimally invasive glaucoma surgery (MIGS) cases, and are unbundling service contracts to appeal to cost-conscious buyers. Premium intraocular lenses (IOLs) priced beyond USD 2,500 per eye continue to gain acceptance as patients seek spectacle independence. At the same time, daily-disposable contact lenses are displacing monthly formats, helping high-volume manufacturers leverage automated production. Regulatory momentum has accelerated for AI-driven diagnostics, while tariff pressure on steel and titanium surgical instruments is nudging vendors to diversify supply chains and safeguard margins.
Key Report Takeaways
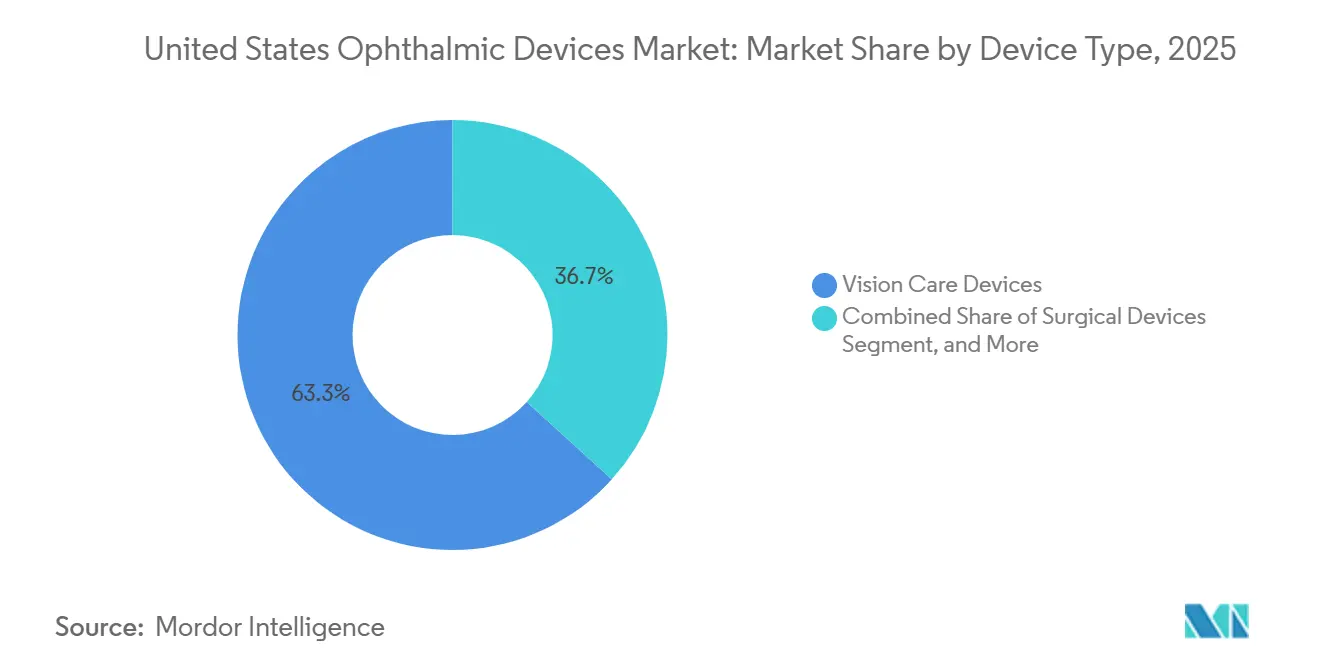
- By device type, vision care devices led with 63.27% revenue share in 2025; diagnostic and monitoring platforms are projected to post the fastest 7.32% CAGR through 2031.
- By disease indication, cataract procedures accounted for 39.33% share of the United States ophthalmic devices market size in 2025, whereas diabetic retinopathy diagnostics are advancing at a 6.69% CAGR through 2031.
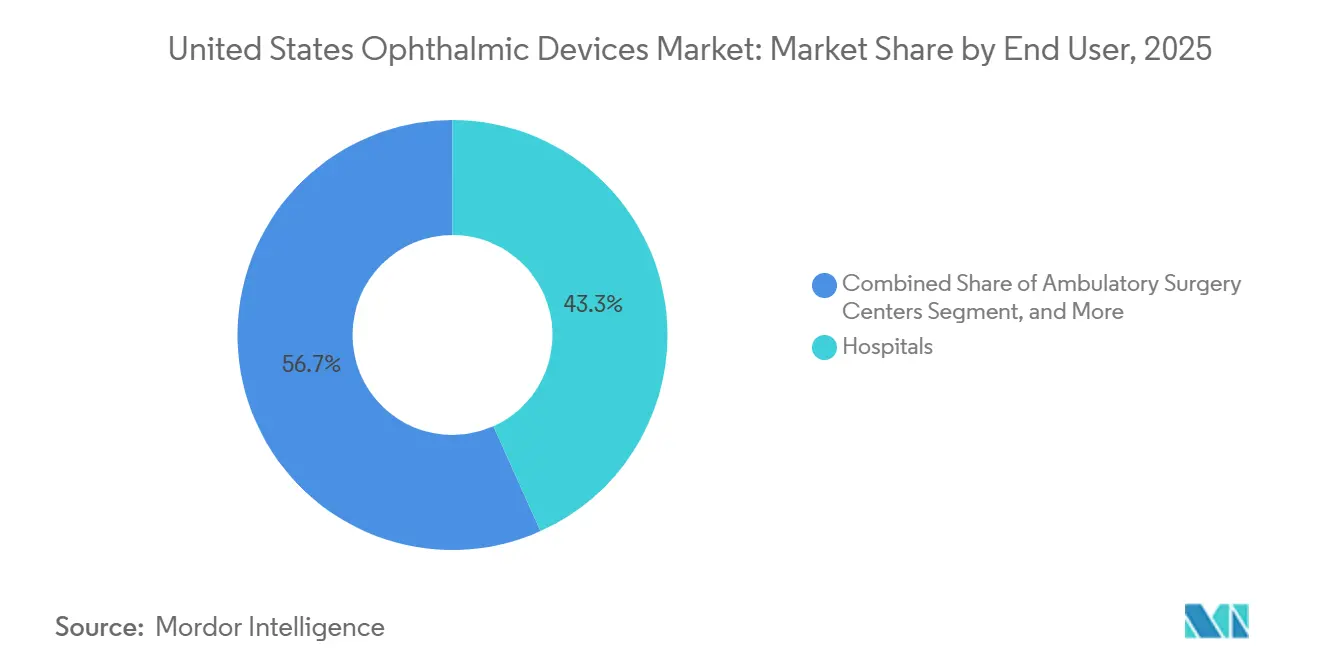
- By end-user, hospitals held 43.28% of the United States ophthalmic devices market share in 2025, while ASCs are expanding at a robust 9.01% CAGR through 2031.
Note: Market size and forecast figures in this report are generated using Mordor Intelligence’s proprietary estimation framework, updated with the latest available data and insights as of January 2026.
United States Ophthalmic Devices Market Trends and Insights
Drivers Impact Analysis*
| Driver | (~) % Impact on CAGR Forecast | Geographic Relevance | Impact Timeline |
|---|---|---|---|
| Aging Population & Cataract Prevalence Surge | +1.2% | National, with concentration in Sun Belt states (Florida, Arizona, Texas) | Long term (≥ 4 years) |
| Rising Diabetes & Glaucoma Comorbidity Burden | +0.9% | National, with higher prevalence in Southern and Appalachian regions | Medium term (2-4 years) |
| Shift of Cataract & MIGS Procedures to ASCs | +1.5% | National, led by metropolitan areas with ASC density | Medium term (2-4 years) |
| Surge in Premium IOL & Daily-Disposable Contact Lens Uptake | +0.8% | National, skewed toward urban and suburban affluent demographics | Short term (≤ 2 years) |
| AI-Integrated OCT & Fundus Imaging Adoption | +1.1% | National, with early adoption in integrated health systems and retail clinics | Medium term (2-4 years) |
| Sustainability Push for Single-Use Surgical Packs | +0.3% | National, driven by hospital sustainability mandates and GPO procurement policies | Long term (≥ 4 years) |
| Source: Mordor Intelligence | |||
Aging Population & Cataract Prevalence Surge
The U.S. Census Bureau expects the 65-plus cohort to reach 73 million by 2030, up from 58 million in 2022.[1]National Eye Institute, “Diabetic Retinopathy Statistics,” nei.nih.gov Cataract formation accelerates after age 60, and the National Eye Institute projects 50 million Americans could have cataracts by 2050. Medicare covers standard monofocal cataract extraction, ensuring broad access, while premium IOL penetration rose to 35% of procedures in 2024, according to JAMA Ophthalmology. Sun Belt states attract retiring patients and record-high volumes, prompting vendors to open regional service hubs to minimize downtime.
Rising Diabetes & Glaucoma Comorbidity Burden
The CDC counted 38.4 million Americans with diabetes in 2024, and roughly a quarter will develop diabetic retinopathy within 15 years of diagnosis.[2]American Academy of Ophthalmology, “Capital Expenditure Guide for Diagnostic Suites,” aao.org Glaucoma Research Foundation data indicate 3.3 million Americans aged 40 and older have glaucoma, expected to reach 4.3 million by 2030. Diabetic patients face a 40% higher risk of open-angle glaucoma, prompting demand for integrated platforms that identify both conditions in one visit. Autonomous AI systems such as IDx-DR extend screening into primary-care offices, easing rural capacity gaps.
Shift of Cataract & MIGS Procedures to ASCs
Medicare’s 2025 Physician Fee Schedule raised ASC payments for cataract extraction by 2.8% versus a 1.9% hospital outpatient increase. Lower overhead spurs surgeons to migrate cases to ASCs, where overhead costs are 30-40% lower than in hospitals. ASCs now complete 68% of U.S. cataract surgeries, up from 62% in 2020. Bundling MIGS with cataract extraction elevates procedural efficiency, yet intense ASC price negotiations are compressing phacoemulsification and handpiece margins.
Surge in Premium IOL & Daily-Disposable Contact Lens Uptake
Toric, multifocal, and extended-depth-of-focus IOLs continue to outpace monofocal lens growth as patients value spectacle freedom. Alcon’s PanOptix Toric and Johnson & Johnson Vision’s TECNIS Synergy series exemplify the technology leap. A 2024 American Society of Cataract and Refractive Surgery survey found that 42% of patients opted for premium lenses when benefits were clearly explained.[3] Daily-disposable contact lenses, led by CooperVision’s MyDay brand, cater to infection-conscious presbyopes and fuel double-digit revenue expansion.
Restraints Impact Analysis*
| Restraint | (~) % Impact on CAGR Forecast | Geographic Relevance | Impact Timeline |
|---|---|---|---|
| High Capital Cost of Femtosecond & OCT Platforms | -0.7% | National, with greater impact on independent practices and rural ASCs | Medium term (2-4 years) |
| Reimbursement Uncertainty for Emerging MIGS & AI Diagnostics | -0.5% | National, with regional variation in private payer coverage policies | Short term (≤ 2 years) |
| Growing ASC Price Pressure on Instrument Vendors | -0.4% | National, concentrated in high-ASC-density metropolitan markets | Medium term (2-4 years) |
| Tariff-Driven Raw-Material Inflation for Steel/Titanium Tools | -0.3% | National, affecting all device categories with metal components | Short term (≤ 2 years) |
| Source: Mordor Intelligence | |||
High Capital Cost of Femtosecond & OCT Platforms
Acquiring a femtosecond laser requires USD 500,000-750,000, with annual service fees of USD 50,000-100,000. Independent practices rarely reach the 300-case threshold needed to justify these expenses. Advanced multimodal OCT units cost more than USD 150,000, prompting rural clinics to defer upgrades. Leasing and click-fee programs shift risk to vendors, tightening their profit margins.
Reimbursement Uncertainty for Emerging MIGS & AI Diagnostics
Glaukos’ iDose TR lacks a dedicated CPT code, forcing providers to bill using unlisted codes and resulting in payment delays. While Medicare covers CPT 92229 for autonomous diabetic retinopathy screening, regional reimbursement variations often fail to offset software licensing costs. Mixed private-payer determinations further stall adoption.
*Our forecasts treat driver/restraint impacts as directional, not additive. The impact forecasts reflect baseline growth, mix effects, and variable interactions.
Segment Analysis
By Device Type: Vision Care Dominates, Diagnostics Accelerate
Vision care devices accounted for 63.27% of revenue in 2025, underpinned by the vast base of spectacle and contact lens users. Diagnostic and monitoring equipment is on track for a 7.32% CAGR through 2031 as AI platforms migrate into primary care settings. Spectacle lenses, especially EssilorLuxottica’s Stellest for myopia control, continue to drive high unit demand. Daily-disposable contact lenses continue to outpace monthly formats, driven by convenience and perceived hygiene. Surgical devices remain vital for cataract, vitreoretinal, refractive, and glaucoma care. Premium IOLs bundled with advanced phacoemulsification consoles deepen vendor-ASC relationships, while MIGS and sustained-release glaucoma implants open new therapy classes.
A broad installed base of phaco consoles means replacement cycles create stable revenue, but the commoditization of consumables tightens margins. Diagnostic players are differentiating through cloud connectivity and AI-based analytics. The CIRRUS 6000 OCT illustrates this shift, automatically segmenting retinal layers to flag early change and reducing technician variability. Fundus cameras coupled with EyeArt AI extend reliable screening to retail and federally qualified clinics. Collectively, these trends reinforce growth in the United States ophthalmic devices market even as vision-care dominance persists.



By Disease Indication: Cataract Still Leads but Diabetic-Retinopathy Solutions Outpace
Cataract remained the largest indication, generating 39.33% of 2025 revenue. Medicare reimbursement secures procedure volumes, and rising IOL adoption drives average selling prices higher. Diabetic retinopathy diagnostics, however, are the fastest-growing segment at a 6.69% CAGR to 2031, thanks to AI tools that allow non-specialists to screen in primary-care settings. Glaucoma solutions benefit from the aging demographics and the overlap with diabetes, reinforcing demand for perimeters, tonometers, and OCT-based progression monitoring.
Other conditions, including age-related macular degeneration and dry eye, add incremental growth. Home OCT technology shifts wet-AMD monitoring from clinic to home, reducing patient travel and improving adherence. Thermal pulsation devices for dry-eye treatment create cash-pay streams for specialty clinics even though upfront procedure costs exceed USD 1,000. Overall, diversified disease needs ensure resilient expansion of the United States ophthalmic devices market.
By End User: Hospitals Retain Influence While ASCs Speed Ahead
Hospitals accounted for 43.28% of 2025 sales but are ceding routine cases to ASCs, which are projected to grow at a strong 9.01% CAGR through 2031. Narrowing Medicare payment gaps makes ASC economics attractive, and lower overhead enables competitive private-payer contracts. High-volume metro markets such as Dallas, Phoenix, and Orlando illustrate this shift. Specialty ophthalmic clinics focus on premium services like LASIK and advanced IOL implantation and often rely on cash-pay models. Retail chains and federally qualified health centers leverage autonomous AI cameras to embed diabetic retinopathy screening into routine exams, widening access for underserved populations.
Geography Analysis
Sun Belt states drive cataract growth as retirees flock to warmer climates. Florida alone accounts for roughly 12% of national cataract procedures, and high ASC density in Miami, Tampa, and Orlando enables competitive bidding on capital equipment. Texas mirrors this pattern across Dallas-Fort Worth, Houston, and Austin. California’s large diabetic cohort creates sustained demand for diagnostic imaging, particularly in federally qualified health centers serving low-income patients. The prevalence of diabetic retinopathy in these regions supports the expansion of AI-enabled fundus-camera fleets.
The Midwest and Appalachia face limited ophthalmologist availability, prompting primary care facilities to install AI fundus camera systems such as IDx-DR and EyeArt AI. Veterans Health Administration facilities in Montana, Wyoming, and the Dakotas use teleophthalmology programs that pair home OCT devices with centralized reading centers, reducing travel burdens for elderly veterans.
Urban hubs, including New York, Chicago, and Boston, are home to specialty refractive and premium-IOL centers that serve cash-pay segments. These clinics invest in high-specification femtosecond lasers and digital microscopes to differentiate patient experience. Tariff-driven supply-chain adjustments are influencing procurement across all regions, with distributors securing alternative sources in Mexico and Vietnam to maintain instrument availability and cost stability.
Regulatory Landscape
Ophthalmic devices in the United States are regulated by the US Food and Drug Administration (FDA) under the medical device framework, with additional requirements for drug-device combination products governed by 21 CFR Part 4. For ophthalmic drug products packaged with dispensers and other combination configurations, manufacturers must implement quality and postmarket safety reporting systems that cover both the device constituent part and the drug constituent part, which affects design controls, complaint handling, and vigilance processes.
Two 2026 FDA actions materially shape compliance planning for ophthalmic device manufacturers. The Quality Management System Regulation (QMSR) aligning device CGMP requirements with international consensus standards became effective on February 2, 2026, which requires quality system updates across ophthalmic device categories and device constituent parts used in combination products. In addition, an FDA order classifying the digital therapy device for amblyopia became effective following publication on April 22, 2026, adding clarity to the regulatory pathway for software-enabled ophthalmic interventions.
Competitive Landscape
Market leadership remains moderately concentrated. Alcon embeds premium PanOptix Toric and Vivity IOLs within its Centurion ecosystem, locking ASCs in with service bundles. Bausch + Lomb targets cost-sensitive buyers with enVista Toric IOLs and the Stellaris Elite phaco platform. Carl Zeiss Meditec leads premium diagnostics through CIRRUS 6000 OCT and IOLMaster 700 biometry, both featuring AI analytics that reduce reliance on expert technicians.
Glaukos pioneers hybrid device-drug models such as the iDose TR implant that delivers sustained travoprost and potentially curtails daily drop dependence. Disruptors like Notal Vision and Eyenuk are expanding the home monitoring and autonomous screening niches. Vendors race to add cloud connectivity, predictive analytics, and remote interpretation capabilities to differentiate their offerings. Section 510(k) clearances remain the norm, yet breakthrough designations for innovations such as Home OCT accelerate approval cycles. Consolidated service networks become a competitive lever as high-volume ASCs demand near-zero equipment downtime.
United States Ophthalmic Devices Industry Leaders
Alcon Inc.
Bausch + Lomb Corp.
Ziemer Ophthalmic Systems AG
Carl Zeiss Meditec AG
Johnson & Johnson Vision Care Inc.
- *Disclaimer: Major Players sorted in no particular order

Market Opportunities and Future Outlook
Premium cataract surgery and presbyopia correction continue to create whitespace for differentiated IOL platforms, workflow integration, and financing models that align with ambulatory surgery center (ASC) procurement behavior. A concrete signal is the March 2026 FDA approval of Johnson & Johnson's TECNIS PureSee IOL, which adds momentum to extended depth-of-focus offerings and increases competition around premium lens portfolios paired with modern biometry and phaco ecosystems.
Adjustable, post-operative customizable optics are also a development pathway that can broaden the premium IOL value proposition and associated device pull-through (diagnostics, delivery systems, and follow-up tools). In July 2026, Alcon entered a USD 200 million non-exclusive collaboration with RxSight to develop and commercialize adjustable presbyopia-correcting IOLs, reflecting manufacturer investment in technologies that can be tuned after surgery. Beyond product innovation, reimbursement variability for emerging glaucoma drug-device combinations and autonomous AI diagnostics keeps attention on evidence generation, coding strategy, and total-cost-of-ownership offerings that reduce barriers for ASCs and primary-care screening sites.
Recent Industry Developments
- July 2026: Alcon entered a USD 200 million non-exclusive collaboration with RxSight to develop and commercialize adjustable presbyopia-correcting intraocular lenses. The deal highlights vendor focus on post-operative adjustability as a premium cataract differentiator and can increase demand for complementary diagnostics and follow-up workflows that support lens adjustment.
- March 2026: Johnson & Johnson announced US FDA approval of the TECNIS PureSee intraocular lens for the US cataract market. The approval expands the company's premium IOL lineup and raises competitive pressure on lens makers to pair advanced optics with turnkey surgical and measurement ecosystems for high-volume providers.
- October 2024: Alcon received US FDA 510(k) clearance for its UNITY VCS and UNITY CS surgical systems. The clearance strengthens Alcon's integrated platform approach for vitreoretinal and cataract procedures, supporting equipment standardization for facilities that prioritize procedural efficiency and service uptime.


Research Methodology Framework and Report Scope
Market Definition and Coverage
This market covers revenues earned in the United States from ophthalmic devices used to diagnose, monitor, treat, and correct eye conditions in clinical and consumer settings.
Scope exclusions: We exclude ophthalmology clinical services and professional fees, as well as non-device drug therapies and general retail eyewear sold purely as fashion items.
Segmentation Overview
- By Device Type
- Diagnostic & Monitoring Devices
- OCT Scanners
- Fundus & Retinal Cameras
- Autorefractors & Keratometers
- Corneal Topography Systems
- Ultrasound Imaging Systems
- Perimeters & Tonometers
- Other Diagnostic & Monitoring Devices
- Surgical Devices
- Cataract Surgical Devices
- Vitreoretinal Surgical Devices
- Refreactive Surgical Devices
- Glaucoma Surgical Devices
- Other Surgical Devices
- Vision Care Devices
- Spectacles Frames & Lenses
- Contact Lenses
- Diagnostic & Monitoring Devices
- By Disease Indication
- Cataract
- Glaucoma
- Diabetic Retinopathy
- Other Disease Indications
- By End-user
- Hospitals
- Specialty Ophthalmic Clinics
- Ambulatory Surgery Centers (ASCs)
- Other End-users
Data Sources, Market Sizing, and Validation
Desk Research
Desk research was used to set the factual base of the model and to keep assumptions realistic before any forecasting was applied. We relied on public health burden signals and procedure context from CDC data products, the National Eye Institute, and National Institutes of Health publications, and then cross-checked device related indicators through FDA device databases and recall notices.
For market structure and commercial context, we also referenced sources such as US Census and trade statistics for directional import and export movement, peer reviewed ophthalmology journals for technology adoption patterns, and company filings and investor presentations for product mix commentary. In a few places, a paid subscription for company financials and intelligence and a patent database were used to validate timelines and relative exposure by device category. These sources are only illustrative, and many other public materials were also reviewed to collect data, validate assumptions, and clarify unclear points.
Primary Interviews and Surveys
Primary conversations were run with a mix of device manufacturers, distributors, hospital buyers, and clinic level users, so that pricing logic and demand triggers could be checked from more than one angle. Across the United States, we focused on how procedure volumes are trending in cataract, glaucoma, and retina care, and how purchasing shifts between hospitals, ambulatory sites, and specialty clinics are impacting device demand and replacement cycles.
Distribution of primary research fieldwork respondents
| Company type | Respondent position |
|---|---|
| Top tier: 35% | CXOs: 13% |
| Mid tier: 50% | Functional/Unit leaders: 34% |
| Smaller Players: 15% | Managers: 53% |
Market-Sizing & Forecasting
The sizing model starts from a top-down build where procedure and patient flow signals are translated into device demand pools for the US care setting, and then the totals are reconciled with category level sales logic. To keep it grounded, we corroborated the result using selective bottom-up approximations, such as sampled average selling price ranges multiplied by estimated unit placements and replacement, followed by channel checks where data was thin.
Key inputs used to shape the curve included cataract surgery volumes and IOL mix, glaucoma monitoring frequency (including tonometry and visual field testing), retina imaging utilization (for example OCT use rates), replacement cycles for capital diagnostic equipment, and consumable attach rates for surgical and vision care products. Where smaller device categories had limited visibility, gaps were handled by using conservative adoption ranges from interviews and then stress testing the impact on the total market.
For forecasting, scenario analysis was applied so the baseline could reflect a realistic path between conservative and aggressive adoption views shared by practitioners and procurement teams. The final forecast was checked for consistency against macro indicators like aging population trends and the pace of outpatient shift in eye procedures, and then adjusted only when multiple signals pointed in the same direction.
Data Validation & Update Cycle
Validation was done through stepwise checks where outputs were compared against independent signals, and any sharp jumps were reviewed back to the assumption level. We also re-contacted selected respondents when the model showed price or volume movements that did not align with observed clinical practice or purchasing patterns.
Before sign-off, the work passes through multi-step internal reviews that focus on arithmetic accuracy, scope consistency, and whether drivers match the narrative. Reports are refreshed annually, and interim updates are made when material events occur that can shift demand, pricing, or adoption. Right before delivery, we run a final pass so clients receive the most current view supported by the latest available information.
Mordor Intelligence's USA Ophthalmic Devices Market Size Versus Other Published Estimates
Published market values for US ophthalmic devices often vary because the scope line is not the same, and because pricing and procedure assumptions are updated at different times. Differences also come from how researchers treat vision care products versus surgical and diagnostic equipment, and whether the estimate is anchored to procedure based demand or to broader commercial category revenues.
The main gap comes from whether vision care add-ons and wider eye care product baskets are counted, where Mordor Intelligence counts only ophthalmic devices tied to defined diagnostic, monitoring, surgical, and vision correction use cases, and keeps the base year pricing and mix aligned to the same period.
Benchmark comparison
| Source | Market Size | Gaps in Research Methodology |
|---|---|---|
| Mordor Intelligence | USD 16.65 B (2025) | |
| Industry Publisher A | USD 12.39 B (2024) | Uses a different base year and blends a broader eye care framing with device categories, which can shift what is included and how prices are averaged across products. |
| Research Publisher B | USD 14.56 B (2025) | Uses a longer forecast horizon and category definitions that may apply different assumptions for vision care and surgical accessory coverage, which can change the summed value even when the geography is the same. |
Overall, the spread is explained less by math and more by what is included, which year is used as the anchor, and how ASP and mix are progressed through time. By keeping inputs tied to observable procedure and utilization signals and then cross-checking with practical price and placement ranges, the resulting market size stays traceable and easier to replicate when assumptions are revisited.


Key Questions Answered in the Report
What is the current value of the United States ophthalmic devices market?
The United States ophthalmic devices market size stands at USD 16.65 billion in 2025 and is projected to reach USD 22.7 billion by 2030.
Which device category holds the largest share of revenue?
Surgical systems lead with 42.11% of United States ophthalmic devices market share in 2024, driven by cataract and glaucoma procedures.
How fast are ambulatory surgical centers expanding their device purchases?
Ambulatory surgical centers show a 5.23% CAGR through 2030 as outpatient models gain reimbursement support.
Which emerging technology is reshaping diagnostics?
AI-enhanced OCT and fundus-imaging platforms that predict visual acuity and automate referral decisions are revolutionizing clinic workflows.
How is the regulatory environment affecting laser-device innovation?
Extended FDA approval timelines add cost and slow product refresh, slightly tempering growth in refractive-laser sales.
Page last updated on:


 Your data is secure and never sold or shared.


