Market Overview
| Study Period | 2020 - 2031 |
|---|---|
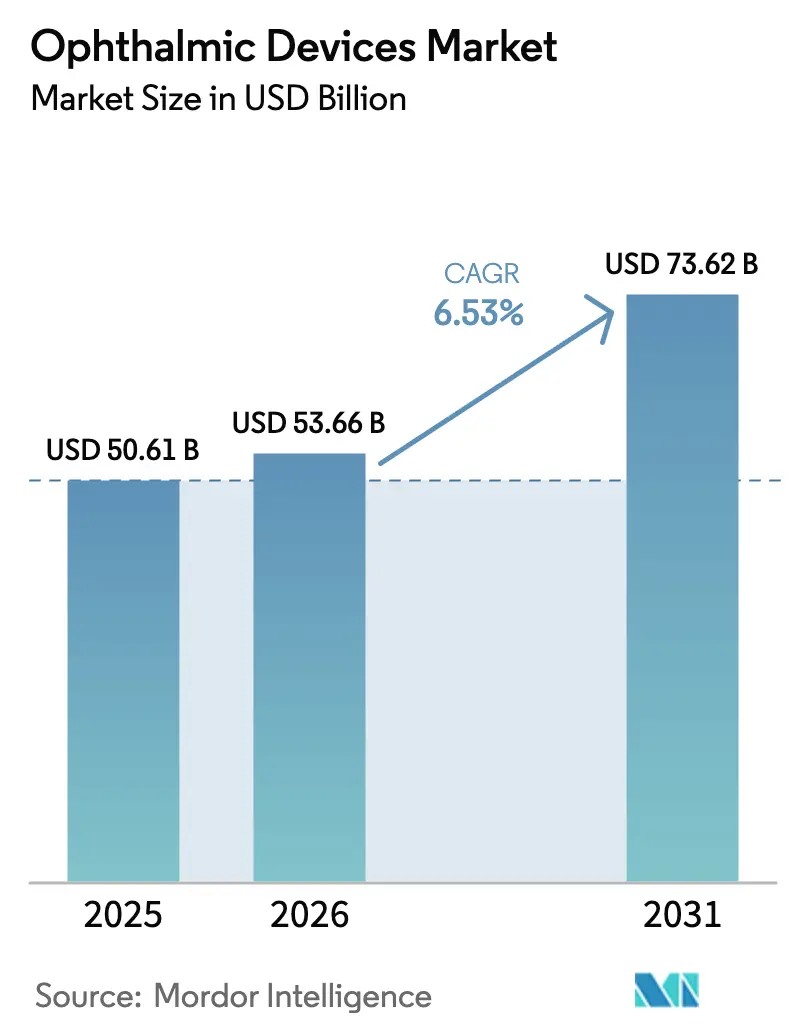
| Market Size (2026) | USD 53.66 Billion |
| Market Size (2031) | USD 73.62 Billion |
| Growth Rate (2026 - 2031) | 6.53% CAGR |
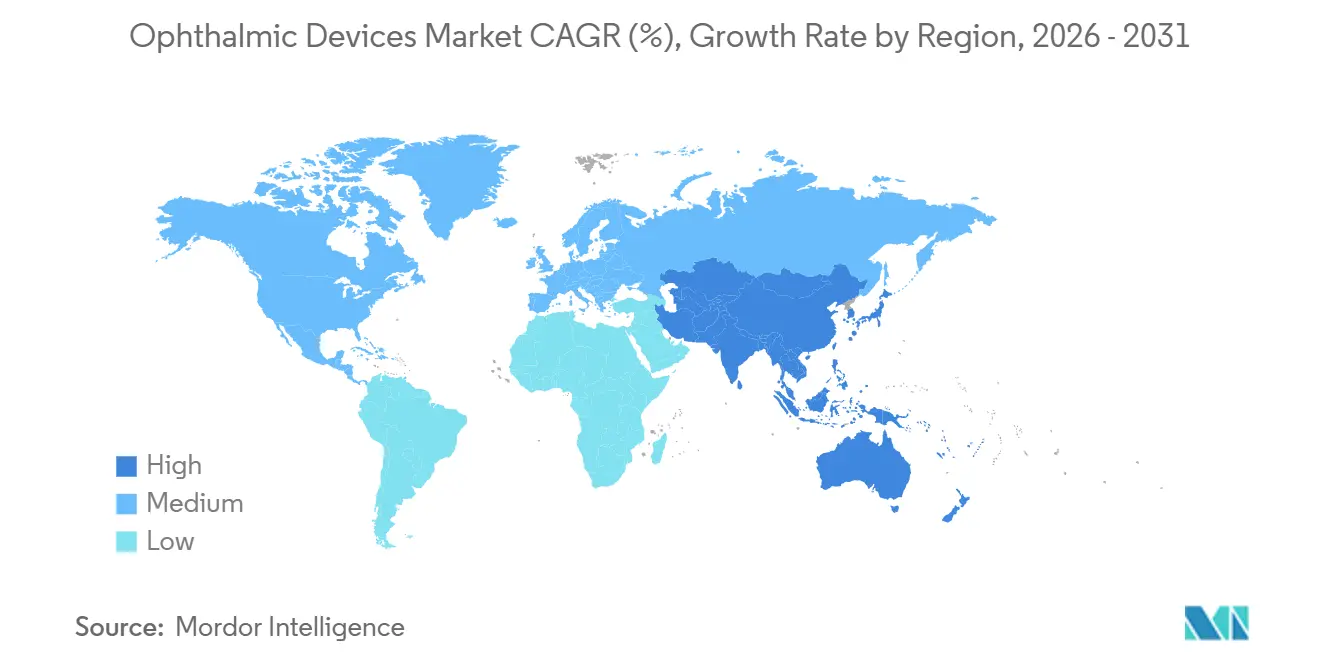
| Fastest Growing Market | Asia Pacific |
| Largest Market | North America |
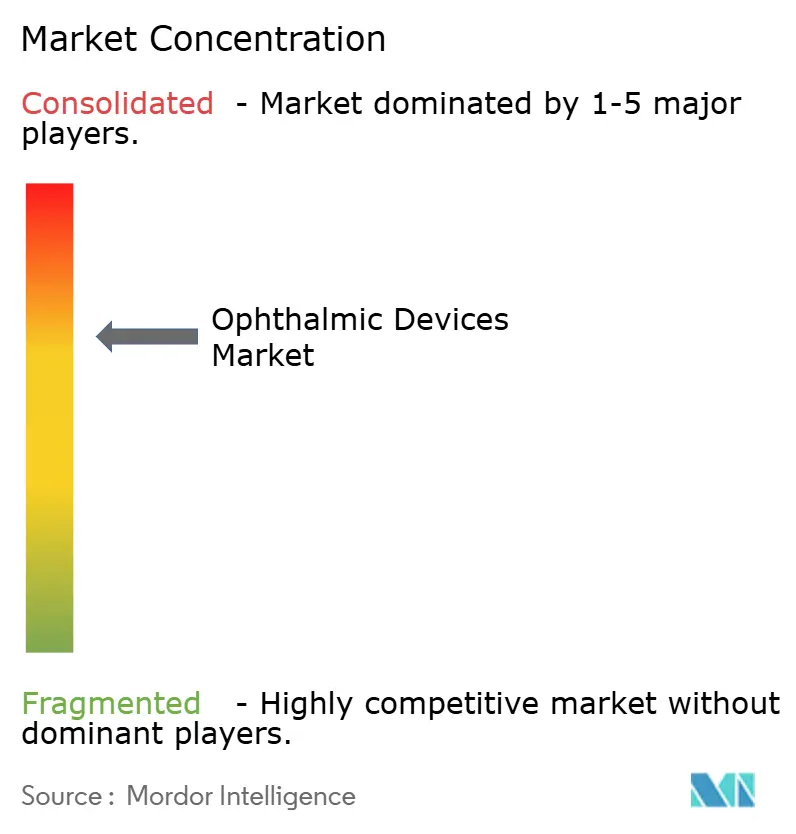
| Market Concentration | Medium |
Major Players *Disclaimer: Major Players sorted in no particular order Image © Mordor Intelligence. Reuse requires attribution under CC BY 4.0. | |
Ophthalmic Devices Market Analysis by Mordor Intelligence
The Ophthalmic Devices Market size is expected to grow from USD 50.61 billion in 2025 to USD 53.66 billion in 2026 and is forecast to reach USD 73.62 billion by 2031 at 6.53% CAGR over 2026-2031.
Demographic aging, surging diabetes incidence, and rapid commercialization of AI-enabled diagnostic imaging compress traditional screening cycles from weeks to minutes, catalyzing equipment replacement as health systems pivot toward preventive eye care. Vision care devices retained volume leadership, yet commoditization pressures on contact lenses and frames are redirecting capital toward diagnostics that generate recurring scan revenues under value-based reimbursement schemes. Hospitals remain the single largest spending venue, but payers are accelerating the shift to ambulatory surgery centers to shave facility fees by up to 40%, thereby bolstering demand for compact femtosecond lasers, MIGS micro-stents, and single-use instrument kits that support same-day discharge models. Competitive intensity is rising as vertically integrated majors bundle diagnostic hardware, surgical consumables, and data analytics into lock-in contracts. At the same time, cybersecurity mandates add development timelines that favor well-capitalized firms able to absorb compliance overhead.
Key Report Takeaways
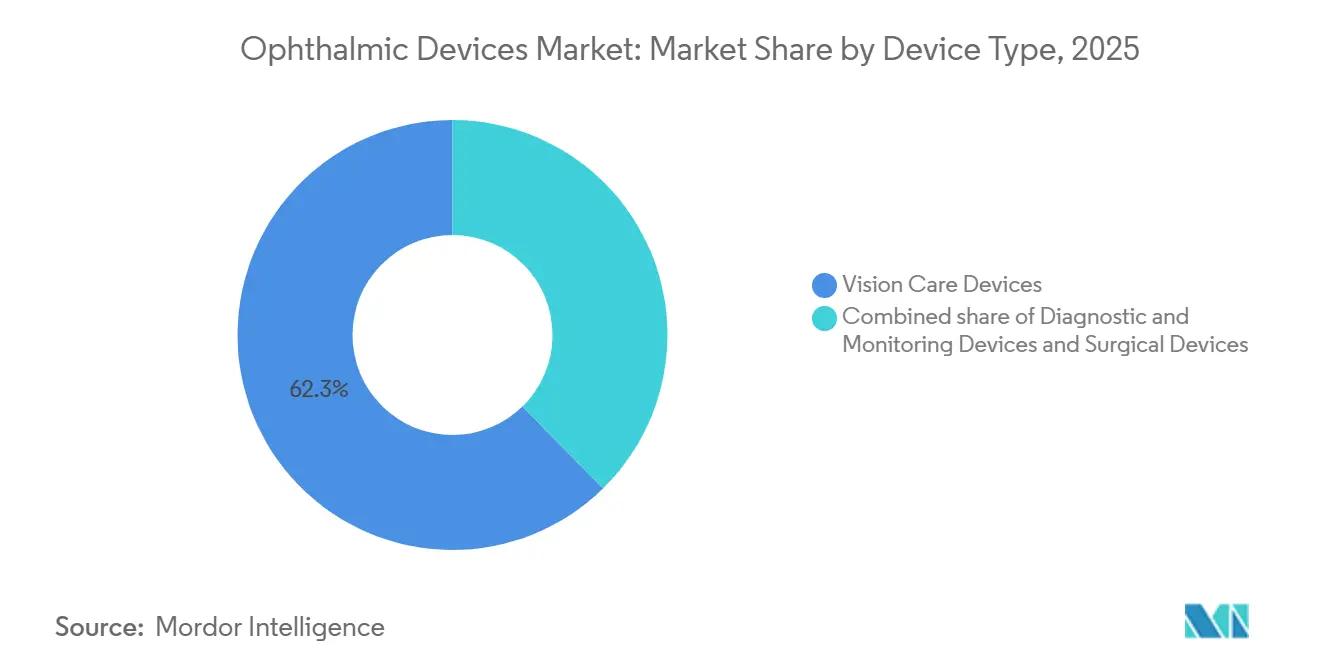
- By device type, Vision Care Devices led with 62.34% revenue share in 2025; Diagnostic & Monitoring Devices are projected to grow at an 8.65% CAGR through 2031.
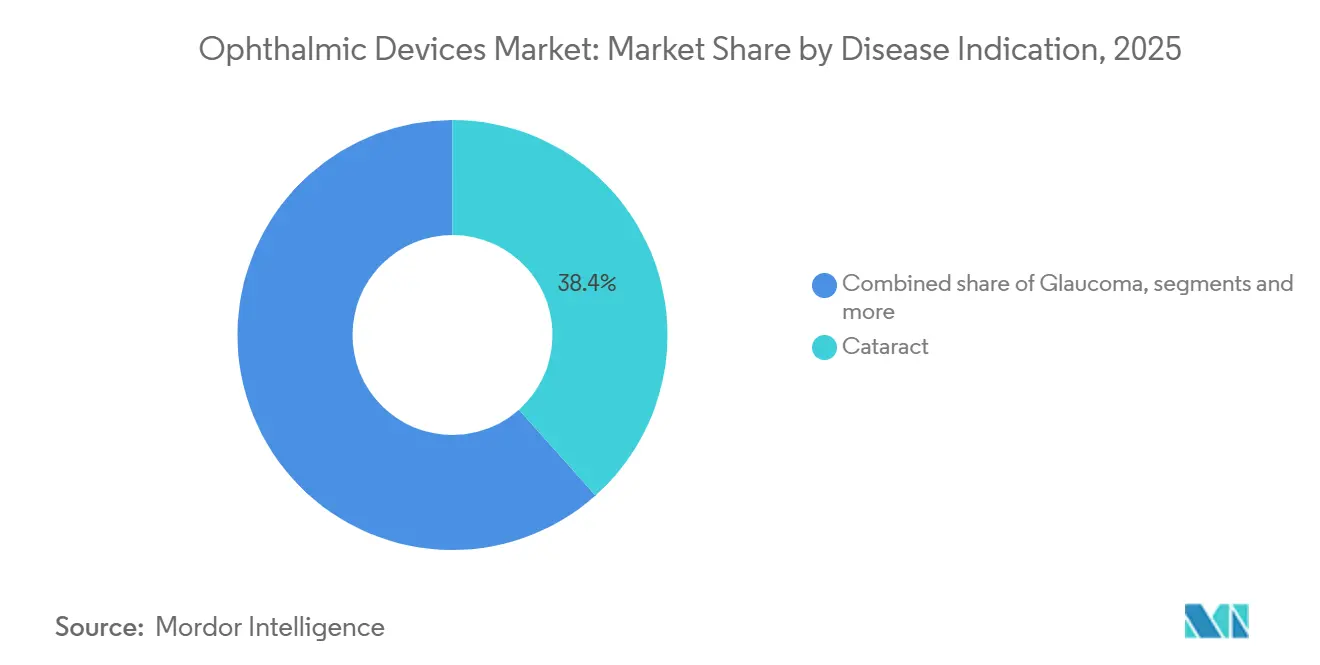
- By disease indication, cataract procedures accounted for 38.41% of spending in 2025, while diabetic retinopathy treatment is advancing at a 7.82% CAGR through 2031.
- By end-user, hospitals held 42.74% of the ophthalmic devices market share in 2025, whereas ambulatory surgery centers recorded the fastest trajectory at 7.67% CAGR to 2031.
- By geography, North America captured 39.94% of the 2025 revenue; the Asia Pacific is forecast to expand at a 7.12% annual rate through 2031.
Note: Market size and forecast figures in this report are generated using Mordor Intelligence’s proprietary estimation framework, updated with the latest available data and insights as of January 2026.
Global Ophthalmic Devices Market Trends and Insights
Drivers Impact Analysis*
| Driver | (~) % Impact on CAGR Forecast | Geographic Relevance | Impact Timeline |
|---|---|---|---|
| Expansion of Integrated Ophthalmology-Primary Care Clinics in Emerging Markets | +0.9% | APAC core (India, China, Indonesia), spill-over to Sub-Saharan Africa | Medium term (2-4 years) |
| Growing Adoption of AI-Enabled Diagnostic Imaging Systems | +1.2% | Global, with early penetration in North America & EU, rapid uptake in APAC urban centers | Short term (≤ 2 years) |
| Rising Prevalence of Vision Disorders in Aging Populations | +1.5% | Global, concentrated in North America, Europe, Japan, and China | Long term (≥ 4 years) |
| Surge in Employer-Funded Digital Eye-Health Wellness Programs | +0.6% | North America & EU corporate hubs, pilot programs in Singapore and UAE | Short term (≤ 2 years) |
| Technological Advancements in Minimally Invasive Ophthalmic Surgeries | +1.1% | Global, led by North America and Europe, accelerating adoption in Latin America and Middle East | Medium term (2-4 years) |
| Adoption of Sustainable, Single-Use Ophthalmic Instruments to Reduce Infection Risk | +0.7% | Global, with regulatory push in EU (MDR compliance) and North America (FDA guidance) | Short term (≤ 2 years) |
| Source: Mordor Intelligence | |||
Expansion of Integrated Ophthalmology-Primary Care Clinics in Emerging Markets
Integrated eye-care hubs across India, China, and Southeast Asia embed tonometry, fundus photography, and visual-acuity tests into routine wellness visits, shortening referral cycles from six weeks to two days. India’s National Programme for Control of Blindness established 1,200 vision centers in 2024, each linked via tele-ophthalmology to tertiary hospitals, enabling the early detection of glaucoma and retinopathy while boosting equipment utilization for portable slit lamps and autorefractors[1]Ministry of Health and Family Welfare, India, “National Programme for Control of Blindness,” mohfw.gov.in. China’s Healthy China 2030 blueprint mandates annual eye exams for citizens over 60, stimulating the purchase of compact OCTs and handheld tonometers in township clinics that previously lacked ophthalmic capital assets. Private chains, such as Aravind Eye Care, offer turnkey clinic franchises that bundle diagnostics, EMR platforms, and workforce training, thereby accelerating ophthalmic device market penetration across Tier-2 and Tier-3 cities. Earlier detection pulls surgical volume forward, lifting cataract and MIGS procedures while lowering lifetime treatment costs, giving policymakers fiscal incentives to expand the model.
Growing Adoption of AI-Enabled Diagnostic Imaging Systems
Autonomous AI algorithms for diabetic retinopathy and AMD have received FDA and CE clearances, empowering primary-care teams to execute point-of-care retinal scans with over 90% sensitivity in under 60 seconds, comparable to the performance of retina specialists. EyeArt deployments reached over 900 U.S. sites by mid-2025, resulting in a 40% increase in retinopathy detection compared to legacy referral pathways, as patients receive same-visit results and immediate care plans. Payers reimburse USD 50–75 per AI scan, compared to USD 150 for specialist consultations, catalyzing rapid uptake in cost-conscious systems and reinforcing preventive care contracts. The technology also addresses workforce deficits, with the American Academy of Ophthalmology forecasting a shortage of 4,000 retina specialists by 2030, allowing specialists to focus on managing complex therapeutics while AI screens routine cases[2]American Academy of Ophthalmology, “2025 Workforce Projections,” aao.org. Vendors now integrate AI modules directly into OCT and fundus platforms, converting hardware into software-upgradable assets and anchoring long-term service revenues.
Rising Prevalence of Vision Disorders in Aging Populations
Global citizens aged 60+ will climb to 1.4 billion by 2030, driving cataract prevalence past 32 million and glaucoma cases toward 112 million by 2031. Japan and South Korea already log more than 1.5 million cataract surgeries per year, sustaining premium IOL demand despite reimbursement headwinds. China’s seniors are projected to reach 400 million by 2035, triggering an exponential increase in purchases of phacoemulsification units and MIGS micro-stents, as domestic manufacturers capture a 20% share by offering price points 40% lower than those of their international counterparts. High-income nations face an escalation of AMD, which doubled between 2010 and 2025, fueling anti-VEGF injection kit volumes and the adoption of sustained-release implants. Aging demographics, therefore, guarantee procedure growth even when device ASPs moderate under competitive pressure, underpinning the long-run outlook for the ophthalmic devices market.
Surge in Employer-Funded Digital Eye-Health Wellness Programs
Corporations in North America and Europe embed smartphone-based vision tests into annual wellness checks, citing productivity gains once refractive errors are corrected. VSP Vision Care and EyeMed rolled out remote refraction apps in 2024, enabling employees to obtain prescriptions without in-person clinic visits and order lenses directly, thereby increasing the utilization of daily-disposable contacts. Johnson & Johnson Vision installed on-site screening kiosks at Fortune 500 campuses, identifying undiagnosed intraocular pressure spikes in 18% of the screened staff, catalyzing early glaucoma referrals. Employers report a 3:1 return on investment within 18 months owing to fewer visual-error-related mistakes and reduced absenteeism. Pilot programs have been implemented in Singapore and the UAE, signaling potential global expansion that will increase the ophthalmic devices market.
Restraints Impact Analysis*
| Restraint | (~) % Impact on CAGR Forecast | Geographic Relevance | Impact Timeline |
|---|---|---|---|
| High Capital Cost of Advanced Ophthalmic Equipment | -0.8% | Global, acute in emerging markets (India, Indonesia, Sub-Saharan Africa) and rural North America | Medium term (2-4 years) |
| Rising Cybersecurity Risks in Connected Diagnostic Devices | -0.5% | Global, heightened in North America & EU due to regulatory scrutiny | Short term (≤ 2 years) |
| Stringent and Divergent Global Regulatory Compliance Requirements | -0.6% | Global, with friction points between FDA, EU MDR, and China NMPA | Long term (≥ 4 years) |
| Supply Chain Vulnerabilities for Specialty Optical Components | -0.7% | Global, concentrated impact in North America and Europe due to reliance on Asian component suppliers | Medium term (2-4 years) |
| Source: Mordor Intelligence | |||
High Capital Cost of Advanced Ophthalmic Equipment
Femtosecond lasers listed above USD 500,000 and swept-source OCT systems run USD 120,000–150,000, pricing out independent practices that perform fewer than 200 cataract surgeries per year, despite leasing programs that still demand USD 8,000–12,000 monthly[3]American Society of Cataract and Refractive Surgery, “Capital Cost Survey 2025,” ascrs.org. Public hospitals in India and Indonesia allocate under USD 50,000 annually for ophthalmic capital expenditure, delaying upgrades by half a decade and concentrating technology in urban centers. Zeiss launched a USD 75,000 OCT variant in 2025, trading scan density for affordability, but image-quality compromises slow uptake among clinicians sensitive to diagnostic accuracy. Capital hurdles thus curb the penetration of next-generation devices and temper the growth of the ophthalmic devices market in price-constrained geographies.
Rising Cybersecurity Risks in Connected Diagnostic Devices
Fourteen ransomware incidents at U.S. eye-care networks in 2024 exposed vulnerabilities in networked OCT and fundus cameras, prompting the FDA to draft guidance mandating secure boot protocols and software bills of materials. Compliance extends clearance timelines by up to 18 months and adds USD 2–3 million per product line, favoring large OEMs with in-house security teams. Hospitals now require third-party penetration tests before procurement, which stretches sales cycles and increases working-capital demands on smaller vendors. Legacy devices, about 40% of installed fleets, cannot accept firmware patches, forcing practices to weigh replacement costs against operational continuity, a dilemma that restrains ophthalmic devices market refresh rates.
*Our forecasts treat driver/restraint impacts as directional, not additive. The impact forecasts reflect baseline growth, mix effects, and variable interactions.
Segment Analysis
By Device Type: Diagnostics Outpace Vision Care in Growth
Diagnostic & monitoring devices generated robust demand, advancing at an 8.65% CAGR from 2026 to 2031, significantly faster than overall ophthalmic devices market expansion. Swept-source OCT and widefield fundus cameras deliver tenfold faster scans than time-domain units, unlocking earlier choroidal neovascularization detection and guiding anti-VEGF therapy escalation. Hand-held tonometers priced below USD 5,000 extend glaucoma screening into pharmacies and primary-care clinics across the Asia Pacific, broadening the installed base underpinning the ophthalmic devices market size for diagnostics. In contrast, Vision Care Devices retained 62.34% of 2025 revenue but faces ASP erosion as direct-to-consumer disruptors cut spectacle and contact lens margins by 30–40%.
Vision care remains volume-dominant, buoyed by urban myopia prevalence exceeding 50% in China and South Korea; however, slower growth will gradually reduce its contribution to the ophthalmic devices market share over time. CooperVision’s MiSight lenses, which curb axial elongation by 50% over three years, generated USD 120 million in sales in 2025, illustrating a willingness to pay for clinically differentiated products despite price sensitivity. Smart contact lenses with embedded glucose and pressure sensors are slated for 2027 launches, promising new revenue streams but facing regulatory complexity that could temper the near-term growth of the ophthalmic devices market. Surgical devices are growing moderately as ASCs opt for refurbished machines bundled with consumables. This model locks practices into long-term contracts, thereby impeding the displacement of new entrants by incumbents.
By Disease Indication: Diabetic Retinopathy Gains Momentum
Cataract surgeries captured 38.41% of the 2025 disease-indication revenue, driven by aging demographics and widespread access to phacoemulsification. In contrast, diabetic retinopathy is expected to command the fastest expansion at a 7.82% CAGR through 2031. Autonomous AI screening slashes per-patient costs from USD 150 to USD 50, enabling payers to mandate annual retinal scans in diabetes care plans, which boosts the ophthalmic devices market size associated with fundus imaging and OCT. The rising prevalence of diabetes, projected to affect 643 million adults by 2030, escalates demand for OCT, injection kits, and sustained-release implants, such as Genentech’s Susvimo, which halves the injection frequency and improves compliance.
Glaucoma interventions via MIGS and laser trabeculoplasty are also advancing steadily, with Glaukos and Alcon securing a 60% U.S. share in 2025, owing to favorable Medicare codes that reimburse USD 1,200–1,500 per procedure. Anti-VEGF therapies for AMD generated USD 6 billion in device-linked revenue from injection systems in 2025, demonstrating sizable but mature spend patterns relative to faster-growing diabetic retinopathy. Large emerging markets, such as India and China, are expected to exceed 15 million cataract procedures annually by 2030, supporting the uptake of premium IOLs and femtosecond lasers, albeit at ASPs 40% below Western pricing due to domestic competition. This will expand the ophthalmic devices market size, albeit at the expense of diluting the gains for multinationals.
By End-User: ASCs Capture Share from Hospitals
Hospitals accounted for 42.74% of 2025 revenue, reflecting complex cases that require overnight monitoring, but ambulatory surgery centers are rising at a 7.67% CAGR to 2031 as Medicare’s site-neutral payments erase historical hospital premiums and accelerate ophthalmic devices market migration. ASCs conduct 15-minute cataract procedures versus 45-minute hospital sessions, thereby elevating daily case counts and boosting the return on capital for femtosecond lasers, which are priced at USD 500,000.
Specialty ophthalmic clinics capture a 30% share in 2025 by focusing on refractive and cosmetic surgeries, which are often financed out-of-pocket, thereby insulating revenue from payer cuts and fostering the rapid adoption of high-margin femtosecond lasers and premium IOLs. Optical retail chains integrate autorefractors and tele-optometry links to deliver prescriptions within 20 minutes, siphoning routine eye-exam traffic away from clinics and widening the ophthalmic devices market as chains expand internationally. Hospitals retain dominance in complex pediatric and vitreoretinal surgery; however, routine diagnostics and cataract workflows continue to shift toward ASCs and clinics, redistributing the ophthalmic devices market share across care settings.
Geography Analysis
North America accounted for 39.94% of 2025 revenue, driven by Medicare funding for advanced imaging and MIGS devices. However, saturation limits growth to mid-single digits, as cataract penetration surpasses 90% of eligible patients. Autonomous AI screening approvals and 18 ophthalmic device clearances in 2024 sustain innovation, but the adoption of refurbished equipment and bundled contracts exerts pricing pressure on OEMs. Canada’s single-payer model constrains capital budgets for premium OCT and femtosecond lasers, shifting upgrade demand to private clinics serving self-pay patients willing to fund rapid access to advanced procedures.
The Asia Pacific is the fastest-growing region, with a 7.12% CAGR through 2031, driven by China’s Healthy China 2030 annual examination mandate and India’s rollout of 1,200 vision screening centers, which together add millions of diagnostic encounters each year. Japan and South Korea perform more than 1.5 million cataract surgeries annually, maintaining a high consumable pull-through for premium IOLs despite moderating device ASPs. Domestic manufacturers such as MOPTIM and Suowei captured 20% of China’s phacoemulsification systems market in 2025 by offering units at USD 30,000, a 50% discount to Western brands, and exporting to Southeast Asia, thereby expanding the regional ophthalmic devices market size. Rising medical tourism in Thailand and Singapore further scales the volume of refractive surgery, bundling LASIK with hospitality packages that attract regional patients and bolster sales of femtosecond lasers.
Europe generated 25% of global revenue in 2025; however, EU MDR compliance delayed 30% of planned product launches, temporarily constricting replenishment cycles and increasing refurbishment demand. NHS cataract wait times exceeding 18 months prompted private-sector chains, such as Optegra, to charge GBP 2,500 (USD 3,200) per eye for expedited surgery, stimulating demand for premium lenses and reinforcing the ophthalmic devices market in the UK . The Middle East & Africa and South America remain underpenetrated, with a 5% CAGR, as public systems focus on basic cataract interventions. However, mobile eye clinics and tele-diagnostics are expanding their reach into rural areas, setting the stage for the future growth of portable devices priced under USD 10,000.
Competitive Landscape
The ophthalmic devices market concentration is moderate, with Alcon, Bausch + Lomb, Johnson & Johnson Vision, and Zeiss capturing approximately 45% of the 2025 revenue by bundling diagnostic platforms, surgical consumables, and analytics services into multi-year contracts that raise switching costs for hospitals and ASCs. These majors leverage extensive installed bases of phaco and OCT systems to lock customers into proprietary consumable ecosystems, stabilizing recurring revenue even as hardware ASPs deflate. Glaukos, STAAR Surgical, and Heidelberg Engineering exploit subspecialty niches—MIGS implants, implantable collamer lenses, ultra-widefield imaging—where targeted clinical superiority commands premium pricing and circumvents broad incumbent dominance.
Direct-to-consumer disruptors such as Warby Parker and Lenskart capture eyewear sales by integrating in-store autorefractors with remote prescription verification, seizing 12% of U.S. eyewear revenue by 2025 and pressuring traditional optical chains to digitize their dispensing workflows. Chinese OEMs EYEGOOD and Suowei underprice Western phaco systems by 50% while meeting NMPA standards, mirroring their playbook in orthopedics and cardiovascular devices and threatening global incumbents in price-sensitive markets. Cybersecurity and EU MDR compliance pose barriers that smaller firms struggle to overcome without partnerships or acquisitions, foreshadowing further consolidation as capital-intensive regulatory demands reshape the competitive dynamics in the ophthalmic devices market.
Ophthalmic Devices Industry Leaders
Alcon Inc.
Johnson & Johnson Vision Care
Lumibird Medical
Bausch + Lomb
ZEISS Group
- *Disclaimer: Major Players sorted in no particular order


Recent Industry Developments
- September 2025: Canadian company MacuMira Medical Devices launched its first Health Canada-approved device for treating dry age-related macular degeneration (AMD). The MacuMira system uses low-dose microcurrents through closed eyelids to stimulate retinal cells in 32-minute sessions. This new non-invasive technology is now available in over 150 clinics across Canada, offering hope for improved vision in AMD patients.
- October 2025: Y.ora Vision was launched through a licensing agreement between SERI and Eyexora Global. The new company focuses on developing minimally invasive surgical devices for treating open-angle glaucoma. This collaboration aims to advance glaucoma treatment options globally.
- October 2024: ZEISS announced the expansion of its ophthalmic product portfolio, focusing on enhancing patient care through new digital AI tools. The company introduced revolutionary surgical solutions designed to improve outcomes and efficiency in eye surgeries. This move aims to leverage advanced technology to advance ophthalmic diagnostics and treatment.


Research Methodology Framework and Report Scope
Market Definitions and Key Coverage
Our study defines the ophthalmic devices market as the global sales of diagnostic and monitoring equipment, surgical systems, and vision-care products that clinicians and consumers use to detect, treat, or correct eye disorders such as cataract, glaucoma, diabetic retinopathy, and refractive error. According to Mordor Intelligence, revenue reflects factory-shipped hardware and vision-care consumables sold through retail and clinical channels in more than 30 countries across five regions.
Scope exclusion: software-only imaging platforms and standalone pharmaceuticals are not counted.
Segmentation Overview
- By Device Type
- Diagnostic & Monitoring Devices
- OCT Scanners
- Fundus & Retinal Cameras
- Autorefractors & Keratometers
- Corneal Topography Systems
- Ultrasound Imaging Systems
- Perimeters & Tonometers
- Other Diagnostic & Monitoring Devices
- Surgical Devices
- Cataract Surgical Devices
- Vitreoretinal Surgical Devices
- Refractive Surgical Devices
- Glaucoma Surgical Devices
- Other Surgical Devices
- Vision Care Devices
- Spectacle Frames & Lenses
- Contact Lenses
- Diagnostic & Monitoring Devices
- By Disease Indication
- Cataract
- Glaucoma
- Diabetic Retinopathy
- Other Disease Indications
- By End-User
- Hospitals
- Specialty Ophthalmic Clinics
- Ambulatory Surgery Centers (ASCs)
- Other End-Users
- Geography
- North America
- United States
- Canada
- Mexico
- Europe
- Germany
- United Kingdom
- France
- Italy
- Spain
- Rest of Europe
- Asia-Pacific
- China
- Japan
- India
- Australia
- South Korea
- Rest of Asia-Pacific
- Middle East & Africa
- GCC
- South Africa
- Rest of Middle East & Africa
- South America
- Brazil
- Argentina
- Rest of South America
- North America
Detailed Research Methodology and Data Validation
Primary Research
Mordor analysts interviewed ophthalmic surgeons, optometrists, procurement heads at hospital groups, and executives from regional distributor networks across North America, Europe, Asia-Pacific, and Latin America. These conversations confirmed current pricing bands, typical replacement cycles, and early adoption rates for premium lenses and AI-enabled diagnostics, filling gaps that desk research left open.
Desk Research
We began with open datasets from agencies such as the WHO, OECD Health Statistics, the United Nations Population Division, and trade groups like the International Agency for the Prevention of Blindness, which quantify disease prevalence, procedure volumes, and spectacle penetration. Company 10-Ks, FDA 510(k) clearances, patent filings accessed through Questel, and shipment records from Volza complemented the public trove. Press releases, peer-reviewed clinical journals, and regional customs data then helped us benchmark average selling prices. The sources named here illustrate the breadth of material consulted; many other reputable references guided day-to-day validation.
Market-Sizing & Forecasting
A top-down model starts with procedure, prescription, and retail demand pools rebuilt from cataract surgery counts, contact-lens wearers, and diagnostic unit installations. Results are cross-checked with selective bottom-up roll-ups of tier-one manufacturer revenues and channel checks. Key variables like geriatric population growth, diabetes incidence, ophthalmologist density, average surgical conversion rate, and lens renewal frequency drive our multivariate regression forecast through 2030. Where supplier data were incomplete, we interpolated volumes using regional ASP spreads validated by primary interviews.
Data Validation & Update Cycle
Our outputs move through anomaly checks, senior analyst review, and year-over-year variance tracking. Models refresh annually, and interim updates trigger when regulatory approvals, large recalls, or macro shocks alter underlying demand.
Why Mordor's Ophthalmic Devices Baseline Commands Reliability
Published estimates often diverge because firms apply distinct product scopes, pricing ladders, and refresh cadences.
Readers need clarity on why numbers differ before they choose a baseline for planning.
Benchmark comparison
| Market Size | Anonymized source | Primary gap driver |
|---|---|---|
| USD 50.35 B | Mordor Intelligence | - |
| USD 50.2 B | Global Consultancy A | Excludes emerging-market retail lens sales, understating Asia demand |
| USD 48.36 B | Industry Association B | Uses hospital purchase prices only, omitting consumer vision-care channels |
| USD 76.9 B (2024) | Trade Journal C | Combines ophthalmic drugs with devices, inflating base value |
In sum, by anchoring our model to transparent device definitions, current ASP audits, and annual refresh cycles, Mordor Intelligence delivers a balanced, reproducible baseline that decision-makers can trust.


Key Questions Answered in the Report
What is the projected value of the ophthalmic devices market by 2031?
The market is forecast to reach USD 73.62 billion by 2031, expanding at a 6.53% CAGR.
Which device category is growing fastest in ophthalmology?
Diagnostic & Monitoring devices are advancing at 8.65% CAGR as AI imaging and point-of-care OCT gain traction.
Why are ambulatory surgery centers gaining share in eye-care procedures?
Payers favor ASCs because same-day cataract and MIGS cases cut facility fees by up to 40% compared to hospital settings.
How is AI influencing diabetic retinopathy screening?
FDA-cleared autonomous AI systems halve per-scan costs and raise detection rates 40%, integrating screening into routine primary-care visits.
What are the key restraints on advanced ophthalmic equipment uptake?
High capital costs, divergent global regulations, and cybersecurity requirements slow adoption, especially in emerging and rural markets.
Page last updated on:


