Bottle Blowing Machine Market Size and Share
Market Overview
| Study Period | 2020 - 2031 |
|---|---|
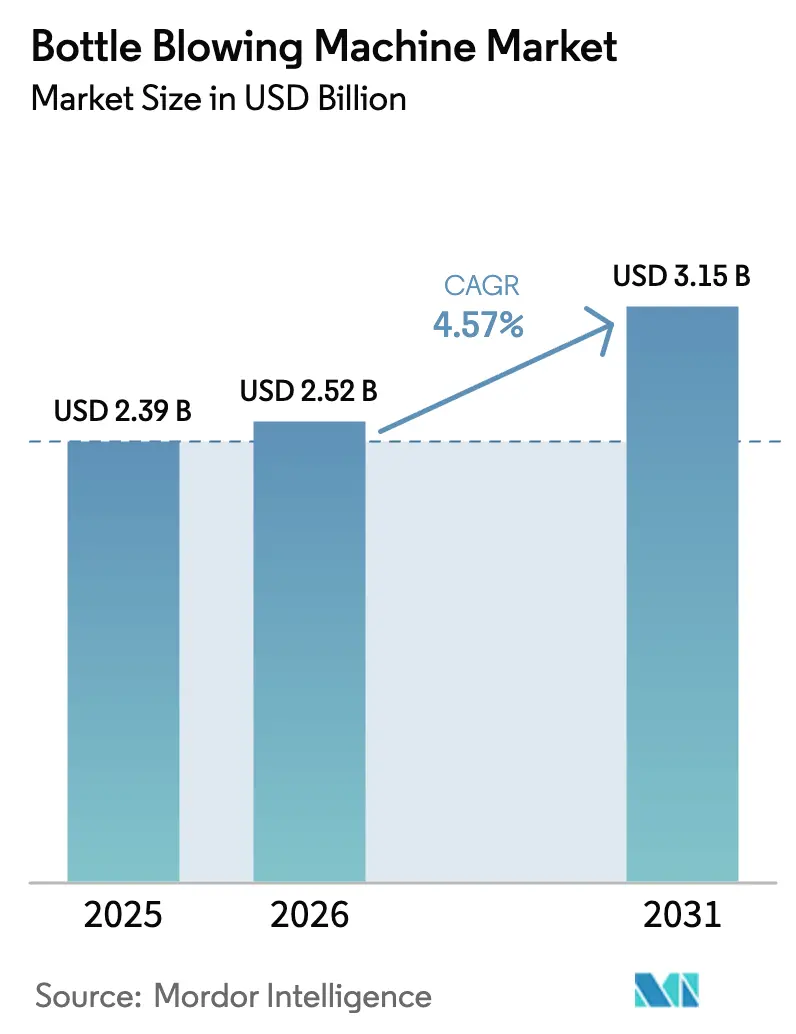
| Market Size (2026) | USD 2.52 Billion |
| Market Size (2031) | USD 3.15 Billion |
| Growth Rate (2026 - 2031) | 4.57% CAGR |
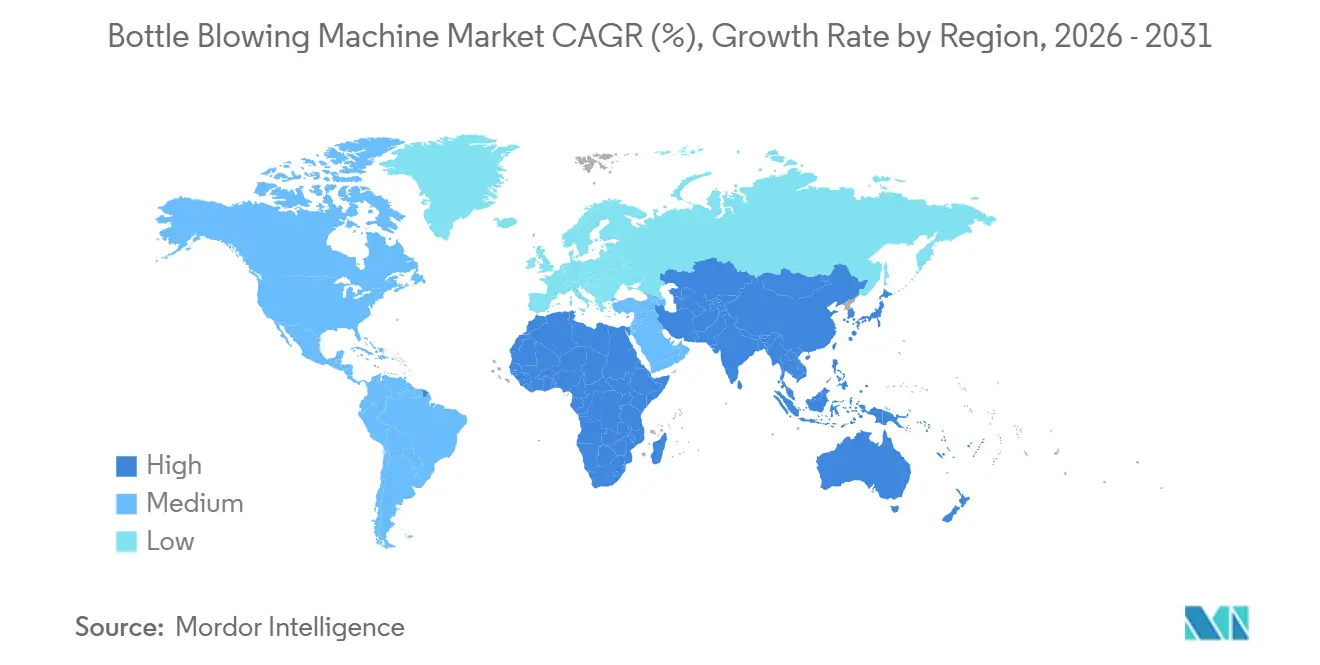
| Fastest Growing Market | Middle East |
| Largest Market | Asia Pacific |
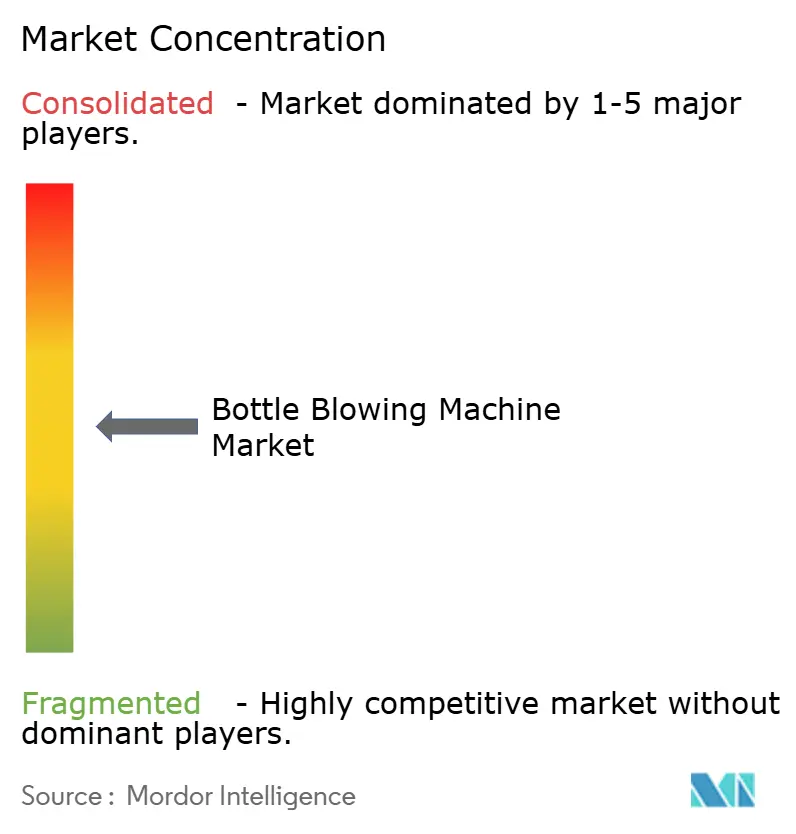
| Market Concentration | Medium |
Major Players *Disclaimer: Major Players sorted in no particular order Image © Mordor Intelligence. Reuse requires attribution under CC BY 4.0. | |
Bottle Blowing Machine Market Analysis by Mordor Intelligence
The bottle blowing machine market size is expected to grow from USD 2.39 billion in 2025 to USD 2.52 billion in 2026 and is forecast to reach USD 3.15 billion by 2031 at 4.57% CAGR over 2026-2031. The rising replacement of hydraulic lines with fully electric platforms to capture 40-60% in energy savings, coupled with sub-10-second changeovers, is steering new-build and retrofit investments. Beverage and pharmaceutical converters are aligning capital projects with these efficiency dividends, even as resin price swings and technician shortages add friction. Leading OEMs are bundling blow-fill-cap functionality to lock in after-sales revenue, while converters evaluate machine choices through the twin lenses of Scope 3 emission cuts and digital-twin-enabled uptime. Stretch blow molding retained its numerical lead in 2025, yet faster growth is evident in injection blow molding for sterile vials, where contamination risk trumps cost economics. Regionally, Asia-Pacific dominates installed capacity, and the Middle East is scaling fastest on water-security mandates that localize bottle production.
Key Report Takeaways
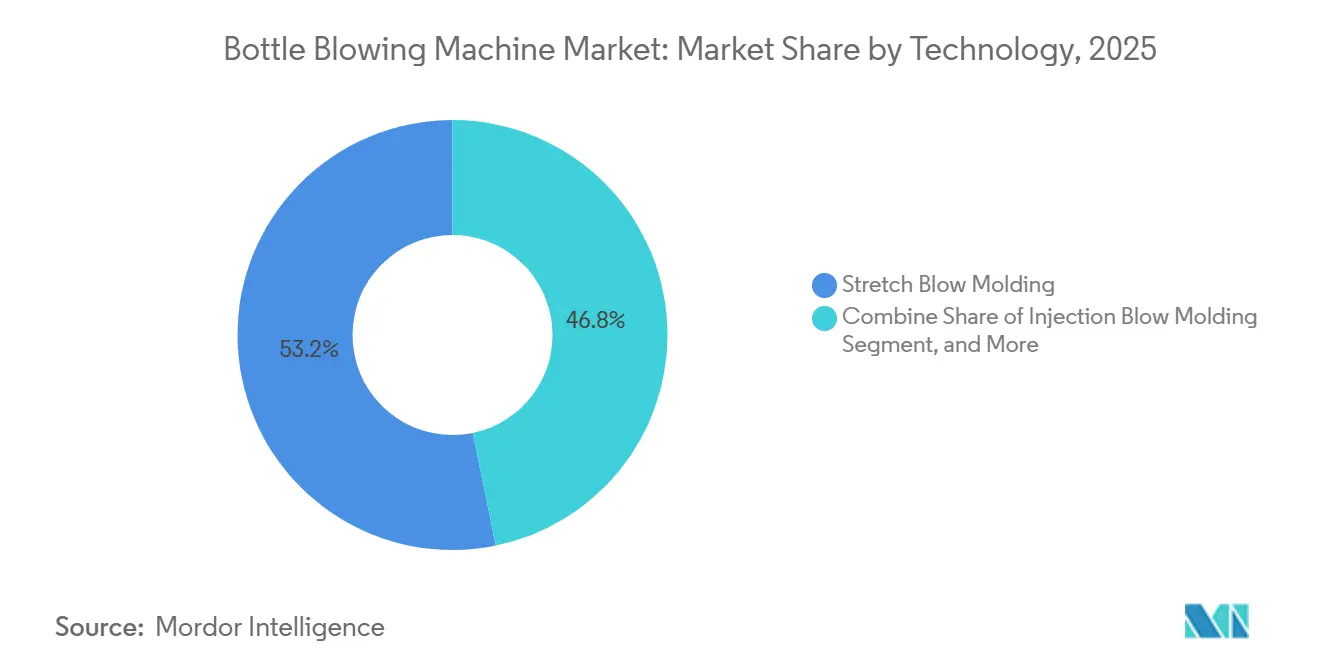
- By technology, stretch blow molding led with 53.23% of the bottle blowing machine market share in 2025, whereas injection blow molding is advancing at a 5.71% CAGR through 2031.
- By machine type, automatic platforms accounted for 64.18% of 2025 installations, and fully automatic variants are projected to expand at a 4.94% CAGR through 2031.
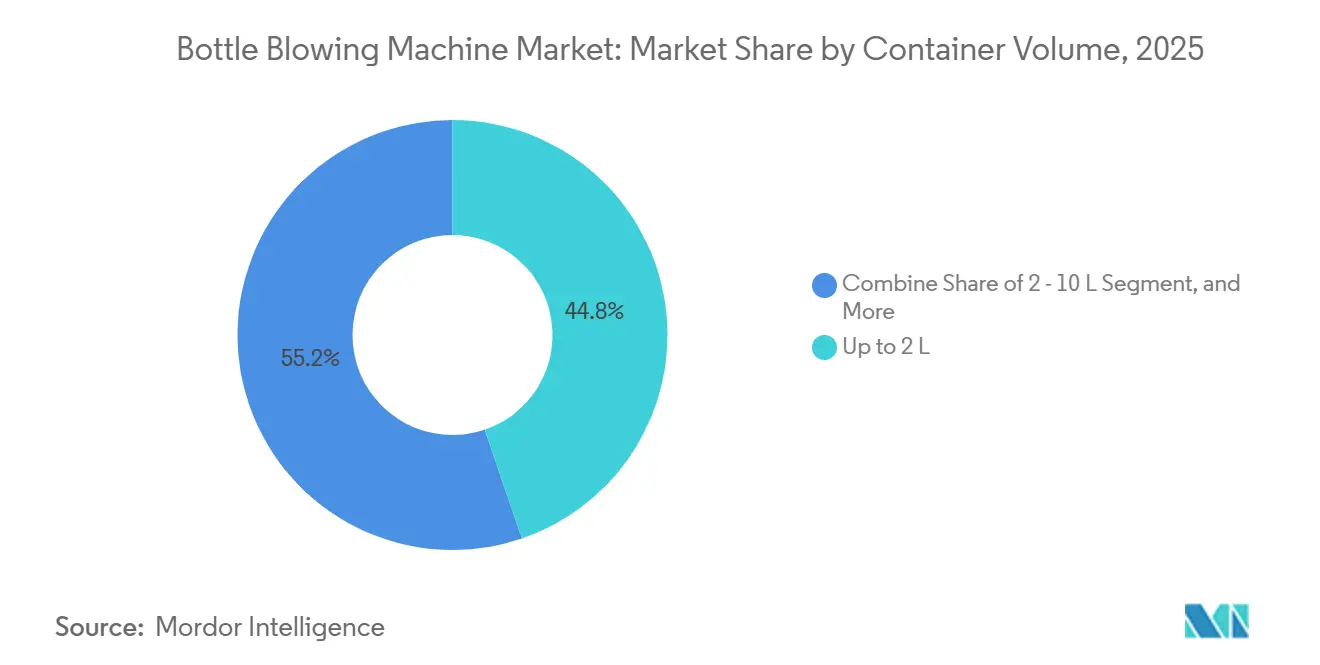
- By container volume, formats up to 2 liters captured 44.76% of 2025 demand, while the 2-10 liter segment is the fastest riser, with a 5.12% CAGR through 2031.
- By end-user industry, beverages accounted for 59.12% of 2025 revenue, yet pharmaceuticals are growing at a leading 5.71% CAGR to 2031.
- By geography, Asia-Pacific accounted for 44.63% of 2025 revenue, and the Middle East is the fastest-growing region, with a 5.52% CAGR through 2031.
Note: Market size and forecast figures in this report are generated using Mordor Intelligence’s proprietary estimation framework, updated with the latest available data and insights as of 2026.
Global Bottle Blowing Machine Market Trends and Insights
Drivers Impact Analysis*
| Driver | (~) % Impact on CAGR Forecast | Geographic Relevance | Impact Timeline |
|---|---|---|---|
| Surging demand for lightweight PET bottles in carbonated soft drinks | +1.2% | Global, concentrated in North America, Europe, Asia-Pacific | Medium term (2-4 years) |
| Growing uptake of single-serve pharmaceutical bottles | +1.0% | North America, Europe, emerging Asia-Pacific | Long term (≥ 4 years) |
| Shift toward fully-electric, energy-efficient machines | +0.9% | Europe and North America early, scaling Asia-Pacific | Medium term (2-4 years) |
| Recycled-PET preforms optimized for low IV scatter | +0.7% | Europe, North America, expanding Asia-Pacific | Long term (≥ 4 years) |
| On-site container manufacturing at beverage micro-factories | +0.5% | North America and Europe, pilots in Asia-Pacific | Long term (≥ 4 years) |
| Tax incentives for digital-twin-enabled rapid changeovers | +0.4% | Europe, North America, South Korea, Japan | Medium term (2-4 years) |
| Source: Mordor Intelligence | |||
Surging Demand for Lightweight PET Bottles in Carbonated Soft Drinks
Brand owners are setting new benchmarks in material thrift, with 500 milliliter bottles now weighing 18.5 grams or less, aided by advanced stretch-rod kinematics and adaptive oven control.[1]SIPA S.p.A., “SIPA Piuma Bottle Launch,” Sipa.it These designs trim resin bills and freight loads, directly lowering Scope 3 emissions while preserving carbonation retention. Equipment suppliers respond by updating infrared heating matrices and closed-loop temperature feedback that prevent thin-wall blowouts.[2]KHS GmbH, “KHS DoGa Heating System Deployment,” Khs.com Lightweighting, therefore, acts as both a sustainability mandate and a technical moat that advantages premium machinery capable of micron-level wall-thickness consistency.
Growing Uptake of Single-Serve Pharmaceutical Bottles
Regulatory momentum behind tamper-evident, serialized packaging for biologics is steering pharma packagers toward small PET formats filled aseptically on blow-fill-seal cells. Cycle times of 10-18 seconds per unit have crossed the economic threshold for high-volume drugs, and integrated vision plus rejection stations satisfy FDA and EMA data-integrity rules. The bottle blowing machine market therefore benefits from equipment that can switch from 180 milliliter to 1 liter formats without compromising sterility, a capability that legacy hydraulic lines lack.
Shift Toward Fully-Electric, Energy-Efficient Machines
Electric drives replace power-hungry hydraulic pumps, delivering 40-60% lower kWh consumption and notably quieter operation, a factor in urban plants with stricter noise ordinances.[3]ABB, “ABB SynRM Motor Retrofit for Blow Molding,” Abb.com Real-time servo profiling slashes idle energy and augments repeatability, reducing scrap rates for converters chasing zero-defect quotas. Carbon-pricing in the EU and peak-tariff regimes in China accelerate payback, typically under 24 months, making full-electric lines de-facto specifications in new tenders.
Recycled-PET Preforms Optimized for Low IV Scatter
Mandatory rPET content is cresting at 100% in several EU member states, yet recycled feedstock exhibits higher IV variability that complicates stretch ratios. Converters therefore invest in machines with enhanced preform temperature sensing, multi-zone oven zoning, and algorithmic feedback that evens out wall distribution despite resin heterogeneity. Equipment with these adaptive controls commands premium margins, reinforcing a virtuous cycle in which recycling regulations directly enlarge the bottle blowing machine market value pool.
Restraints Impact Analysis*
| Restraint | (~) % Impact on CAGR Forecast | Geographic Relevance | Impact Timeline |
|---|---|---|---|
| High CAPEX for large-scale stretch blow molders | -0.8% | Emerging Asia-Pacific, Middle East, Africa | Short term (≤ 2 years) |
| Volatility in PET resin prices | -0.6% | Global, tariff-driven spikes in Asia-Pacific and North America | Short term (≤ 2 years) |
| Shortage of servo-hydraulic calibration technicians | -0.3% | North America, Europe, emerging Asia-Pacific | Medium term (2-4 years) |
| EU chemical-recycling policy uncertainty | -0.2% | Europe, ripple effect on global rPET flows | Medium term (2-4 years) |
| Source: Mordor Intelligence | |||
High CAPEX for Large-Scale Stretch Blow Molders
Lines rated above 40,000 bottles per hour require USD 2-5 million outlays, a financial hurdle that exceeds the operating cash flow of many mid-tier converters in frontier markets. Local lenders often lack packaging-equipment appraisal expertise, raising interest spreads and elongating payback beyond strategic comfort. Consequently, converters defer upgrades unless OEMs offer cavity-scalable modules or lease-to-own terms, limiting unit shipments in cost-sensitive geographies and slowing adoption of energy-efficient technology.
Volatility in PET Resin Prices
Tariff flare-ups, crude price oscillations, and occasional force-majeure events at upstream PTA plants inject unpredictability into resin costs.[4]Reuters, “PET Resin Tariff Impacts 2025,” Reuters.com Converters with razor-thin margins hesitate to commit to long-life assets when feedstock pricing can erode returns almost overnight. This uncertainty pushes procurement cycles out by several quarters, directly cutting into forecast equipment orders and tempering the otherwise robust trajectory of the bottle blowing machine market.
*Our forecasts treat driver/restraint impacts as directional, not additive. The impact forecasts reflect baseline growth, mix effects, and variable interactions.
Segment Analysis
By Technology: Injection Blow Molding Gains in Pharma Despite Stretch Dominance
Stretch blow molding commanded 53.23% of the bottle blowing machine market in 2025 and continues to anchor high-volume beverage packs, leveraging biaxial orientation for strength at sub-20-gram weights. Extrusion blow molding, though niche, retains loyalty for monolayer HDPE and complex handle designs, particularly in household chemicals. Injection blow molding is advancing at a 5.71% CAGR, riding the pharmaceutical shift toward single-serve doses that demand microgram dimensional accuracy and integrated closure formation.
Second-generation single-stage machines demonstrated at K-2025 integrate preform injection, conditioning, and blowing under one roof, enabling four-minute changeovers suitable for clinical-trial lots. Stretch blow platforms serving 2-10-liter water bottles are adding reinforcement ribs and the capacity to insert handles, underscoring the trend toward household hydration formats in water-stressed markets.


By Machine Type: Fully Automatic Systems Driven by Labor Costs and Digitalization
Automatic machines represented 64.18% of 2025 shipments, and within that cohort, fully automatic lines are projected to climb at 4.94% CAGR as converters self-insure against labor scarcity and rising wages in Asia-Pacific. Embedded IoT sensors now stream blow-by-blow cavity data to cloud dashboards, where predictive algorithms flag drift before scrap manifests, boosting uptime by double digits.
Converters replacing three semi-automatic units with one high-speed cell liberate floor space and cut compressed-air demand, reducing utility bills by thousands of USD per month. Tier-two Chinese OEMs are bridging the affordability gap with modular machines whose infeed and discharge conveyors bolt on as volume scales, courting SMEs that previously relied on manual loading.
By Container Volume: Mid-Size Formats Capture Household Water and Bulk Pharma
Containers up to 2 liters secured 44.76% of volume in 2025, anchored by single-serve beverages sold through modern retail and convenience channels. The 2-10 liter cohort is expanding at 5.12% CAGR, propelled by household water demand in the Middle East and North Africa, where municipal supply is intermittent.
Containers above 10 liters remain largely the domain of extrusion blow molding, a process well-suited for producing durable, large-format packaging. However, this segment is increasingly challenged by alternatives such as bag-in-box systems and intermediate bulk containers (IBCs), which offer superior logistics efficiency, reduced storage footprints, and easier handling in distribution chains. At the same time, the smaller-volume category, particularly reusable PET bottles in the 0.25 to 2.5 liter range, is undergoing a transformation. These designs rely on heavier preforms and demand tighter wall uniformity to withstand 15 to 25 wash cycles without compromising performance.
By End-User Industry: Pharmaceuticals Outpace Beverage Growth on Regulatory Tailwinds
Beverages generated 59.12% of 2025 revenue and will remain the anchor tenant of the bottle blowing machine market, yet volume growth is moderating as sugar taxes and refill incentives influence consumer behavior. Pharma is gaining momentum at 5.71% CAGR, as blow-fill-seal aseptic lines replace glass for ophthalmic and biologic therapies, minimizing breakage and cold-chain weight.
Dairy drink producers in Asia-Pacific adopting aseptic PET lines illustrate cross-segment technology migration: what began in beverages now permeates food and pharma for shelf-life and lightweighting advantages. Regulatory crackdowns on counterfeit drugs in Latin America and Africa will further necessitate serialization-ready blow-mold-fill solutions, generating a fresh wave of capex among contract packagers.
Geography Analysis
Asia-Pacific anchored 44.63% of global revenue in 2025, reflecting its concentration of PET preform output, beverage bottling hubs, and export-oriented machinery factories. Domestic Chinese OEMs leverage cost advantages to serve tier-two converters, while European suppliers sell premium, high-speed lines to multinational brands operating in the region. India is transitioning from water-only bottling toward aseptic dairy and juice facilities, illustrated by recent 48,000-bottle-per-hour installations near Lucknow and Pune.
The Middle East registers the fastest trajectory at 5.52% CAGR, underwritten by desalination-linked water projects and localization mandates embedded in Saudi Vision 2030 and UAE industrial strategies. New greenfield plants in Riyadh and Dubai routinely specify integrated blow-fill-cap blocks to minimize footprint and contamination risk, adding high-value orders to the bottle blowing machine market. Energy subsidies and tax holidays further sweeten project economics, compressing paybacks despite high ambient temperatures that raise compressor loads.
North America and Europe form a large installed base with steady but modest line replacements aimed at lowering energy intensity and meeting ESG commitments. Here, the bottle blowing machine market share for fully electric systems is rising fastest, helped by carbon-pricing and environmental disclosure frameworks that translate kilowatt savings into finance-approved ROI. South America and Africa lag on capex availability, yet multilateral financing for recycling plants in Indonesia, Kenya, and Brazil is expected to drive incremental demand for rPET-capable lines over the medium term.

Competitive Landscape
Five OEMs, Krones, Sidel, KHS, Sacmi, and SIPA, capture roughly 55-60% of revenue, situating the bottle blowing machine market in a moderately concentrated band. European incumbents pursue vertical integration, bundling blow molding with downstream filling, labeling, and palletizing under proprietary control suites that raise customer switching costs. Sidel’s 2024 purchases of Gebo Cermex and Matrix Applied Technologies extend its end-of-line and coding reach, matching Krones’ ErgoBloc proposition.
Chinese players such as Tech-Long and Zhejiang Tonva grow faster in unit terms by pricing 20-30% below European rivals and offering localized service through joint ventures in Southeast Asia and Africa. Their newer models incorporate servo ovens and IIoT dashboards, narrowing the historical technology gap. Japanese specialists Nissei ASB and Aoki focus on single-stage precision systems for cosmetics and pharma niches, safeguarding margins via patent portfolios on mold-clamp geometries.
Strategic whitespace is opening in reusable PET, on-site micro-factories, and serialization-ready pharma lines. OEMs delivering digital-twin toolchains can simulate preform heating curves, enabling converters to validate new SKUs virtually and shrink time-to-market. Converters, in turn, are shifting procurement criteria from lowest capex to total lifecycle cost, favoring suppliers that bundle energy analytics, predictive maintenance, and rapid spare-parts fulfillment.
Bottle Blowing Machine Industry Leaders
Krones AG
Sidel Group (Tetra Laval International S.A.)
KHS GmbH
Sacmi Imola S.C.
AOKI Technical Laboratory, Inc.
- *Disclaimer: Major Players sorted in no particular order

Recent Industry Developments
- February 2026: Sidel commissioned an aseptic PET bottling line for Britannia Industries in India, integrating preform sterilization, blow molding, filling, and capping at 24,000 bottles per hour for dairy drinks.
- December 2025: Mai Dubai activated a 100,000-bottle-per-hour water line, underscoring Middle East water-security projects.
- November 2025: KHS installed a 48,000-bottle-per-hour TriBlock at SLMG in India, trimming floor space by 30%.
- September 2025: Naqi Water awarded a contract for integrated blow-fill-cap equipment to expand UAE capacity.


Global Bottle Blowing Machine Market Report Scope
The Bottle Blowing Machine Market Report is Segmented by Technology (Stretch Blow Molding, Extrusion Blow Molding, Injection Blow Molding), Machine Type (Automatic, Semi-automatic), Container Volume (Up to 2 L, 2-10 L, Above 10 L), End-user Industry (Beverage, Food, Pharmaceuticals, Personal Care and Cosmetics, Household Chemicals, Other End-user Industry), and Geography (North America, Europe, Asia-Pacific, Middle East, Africa, South America). Market Forecasts are Provided in Terms of Value (USD).
| Stretch Blow Molding |
| Extrusion Blow Molding |
| Injection Blow Molding |
| Automatic |
| Semi-automatic |
| Up to 2 L |
| 2 - 10 L |
| Above 10 L |
| Beverage |
| Food |
| Pharmaceuticals |
| Personal Care and Cosmetics |
| Household Chemicals |
| Other End-user Industry |
| North America | United States |
| Canada | |
| Mexico | |
| Europe | Germany |
| United Kingdom | |
| France | |
| Italy | |
| Spain | |
| Netherlands | |
| Russia | |
| Rest of Europe | |
| Asia-Pacific | China |
| Japan | |
| India | |
| South Korea | |
| Australia and New Zealand | |
| ASEAN | |
| Rest of Asia-Pacific | |
| Middle East | Saudi Arabia |
| United Arab Emirates | |
| Turkey | |
| Rest of Middle East | |
| Africa | South Africa |
| Nigeria | |
| Egypt | |
| Rest of Africa | |
| South America | Brazil |
| Argentina | |
| Rest of South America |
| By Technology | Stretch Blow Molding | |
| Extrusion Blow Molding | ||
| Injection Blow Molding | ||
| By Machine Type | Automatic | |
| Semi-automatic | ||
| By Container Volume | Up to 2 L | |
| 2 - 10 L | ||
| Above 10 L | ||
| By End-user Industry | Beverage | |
| Food | ||
| Pharmaceuticals | ||
| Personal Care and Cosmetics | ||
| Household Chemicals | ||
| Other End-user Industry | ||
| By Geography | North America | United States |
| Canada | ||
| Mexico | ||
| Europe | Germany | |
| United Kingdom | ||
| France | ||
| Italy | ||
| Spain | ||
| Netherlands | ||
| Russia | ||
| Rest of Europe | ||
| Asia-Pacific | China | |
| Japan | ||
| India | ||
| South Korea | ||
| Australia and New Zealand | ||
| ASEAN | ||
| Rest of Asia-Pacific | ||
| Middle East | Saudi Arabia | |
| United Arab Emirates | ||
| Turkey | ||
| Rest of Middle East | ||
| Africa | South Africa | |
| Nigeria | ||
| Egypt | ||
| Rest of Africa | ||
| South America | Brazil | |
| Argentina | ||
| Rest of South America | ||


Key Questions Answered in the Report
What is the projected value of the bottle blowing machine market by 2031?
The sector is forecast to reach USD 3.15 billion by 2031, growing at 4.57% CAGR from 2026.
Which technology segment is growing fastest within bottle production equipment?
Injection blow molding is advancing at 5.71% CAGR, powered by demand for sterile pharmaceutical vials.
Why are fully electric machines gaining traction among converters?
They cut energy use by 40-60% versus hydraulic systems, offer quieter operation, and meet tightening carbon-pricing regimes, yielding paybacks under two years in many regions.
Which region currently commands the largest share of installations?
Asia-Pacific leads with 44.63% of 2025 revenue, reflecting its dominance in PET preform and beverage bottling capacity.
What is driving demand for 2-10 liter bottle formats?
Household water storage in water-stressed areas and bulk pharmaceutical liquids are pushing the 2-10 liter segment to a 5.12% CAGR through 2031.
How concentrated is supplier power in the bottle blowing machine space?
The market earns a concentration score of 6, as the top five OEMs hold roughly 55-60% of revenue while numerous regional players serve niche and cost-sensitive buyers.
Page last updated on:


