Market Overview
| Study Period | 2020 - 2031 |
|---|---|
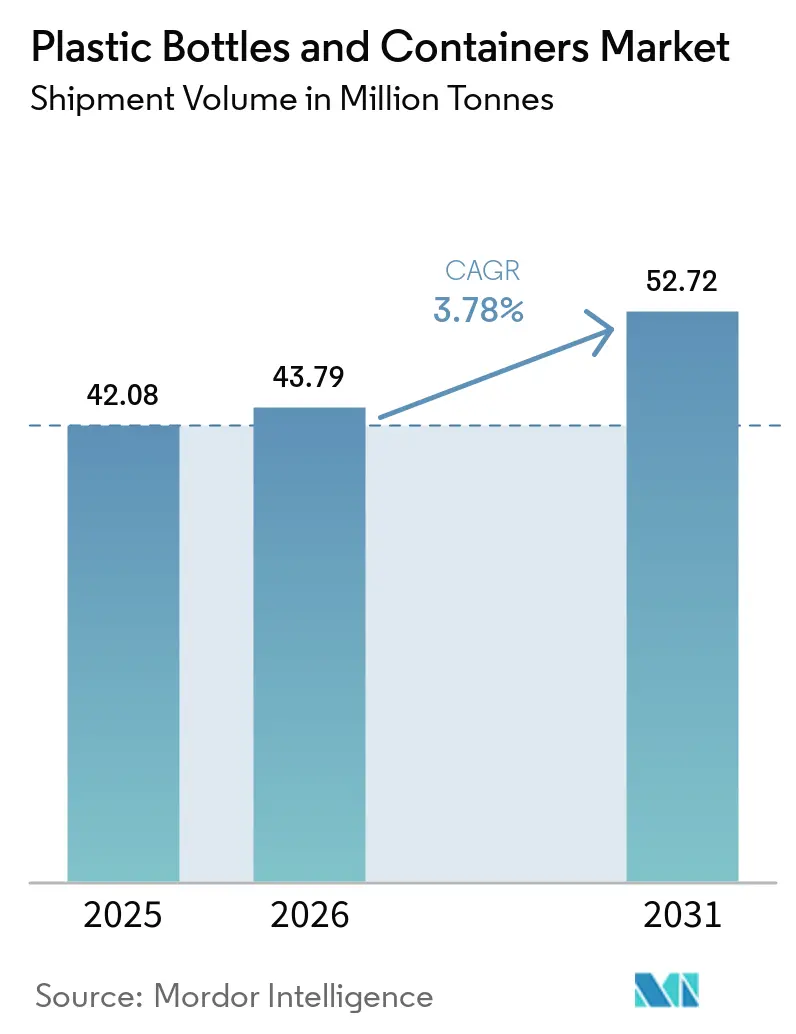
| Market Volume (2026) | 43.79 Million tonnes |
| Market Volume (2031) | 52.72 Million tonnes |
| Growth Rate (2026 - 2031) | 3.78% CAGR |
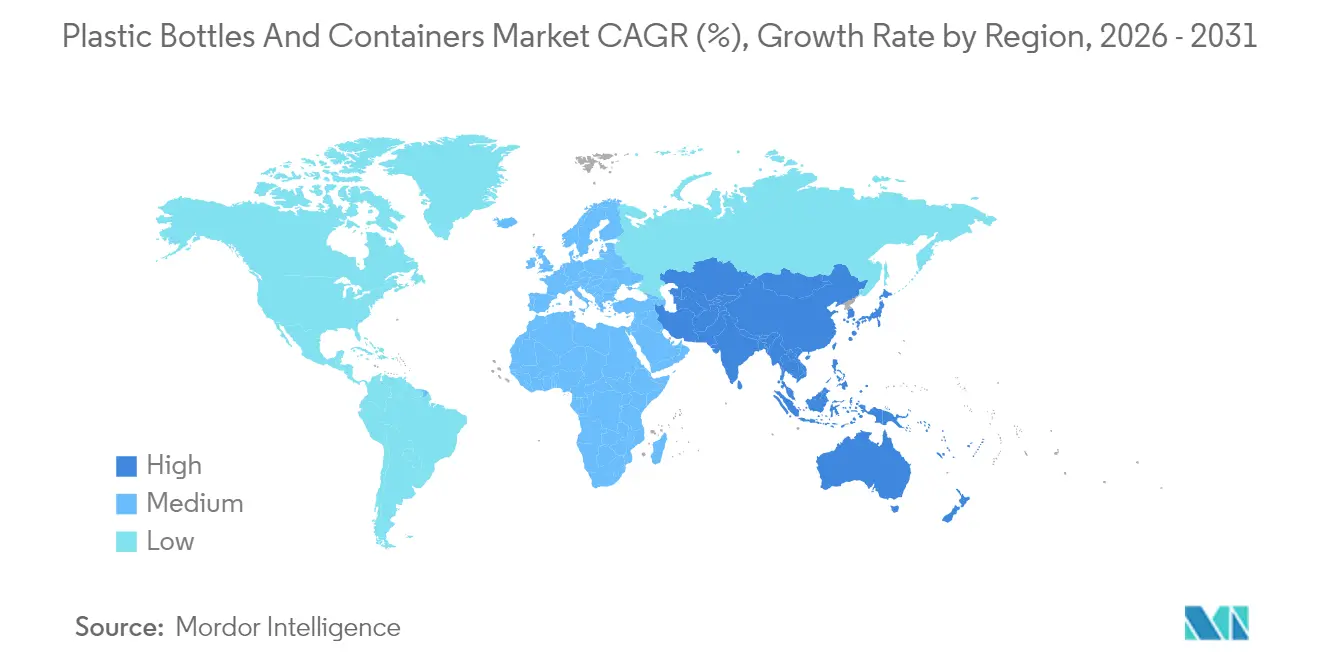
| Fastest Growing Market | Africa |
| Largest Market | Asia Pacific |
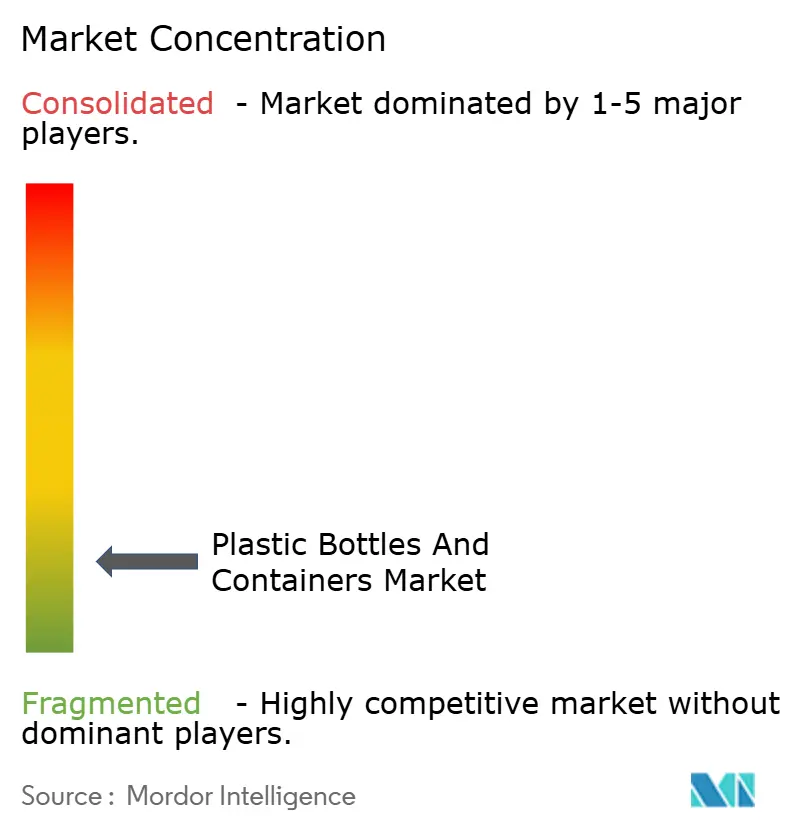
| Market Concentration | Low |
Major Players *Disclaimer: Major Players sorted in no particular order Image © Mordor Intelligence. Reuse requires attribution under CC BY 4.0. | |
Plastic Bottles and Containers Market Analysis by Mordor Intelligence
The Plastic Bottles And Containers Market size in terms of shipment volume is expected to increase from 42.08 Million tonnes in 2025 to 43.79 Million tonnes in 2026 and reach 52.72 Million tonnes by 2031, growing at a CAGR of 3.78% over 2026-2031.
Brand owners continue to pivot toward value-chain resilience, blending lightweighting with recycled-content mandates, while converters balance regulatory costs against throughput efficiency. Polyethylene terephthalate remains the volume anchor, yet bio-based polymers advance on the back of early commercial runs of polyhydroxyalkanoate and polylactic acid formats. Injection-blow capacity ramps up for precision pharmaceutical dosing, and beverage fillers speed redesign work that keeps caps tethered under European Union law. Regionally, Africa’s fast lift in local preform capability narrows historic dependence on imports, whereas Europe contends with rising extended producer responsibility fees that shave margins for non-integrated players.
Key Report Takeaways
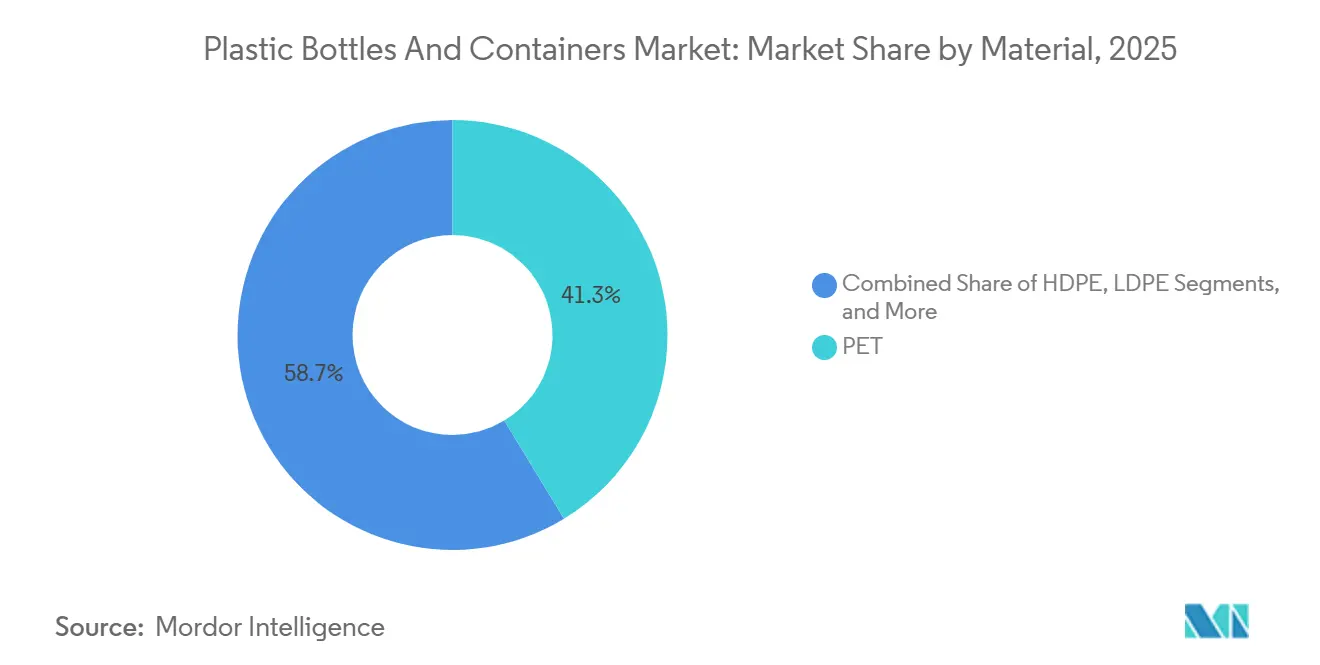
- By material, PET held 41.32% of the plastic bottles and containers market share in 2025. Bio-based and compostable plastics are forecast to record the fastest segment CAGR at 4.96% through 2031.
- By process, stretch blow molding led with 56.73% revenue share in 2025, while injection blow molding is projected to expand at a 4.63% CAGR to 2031.
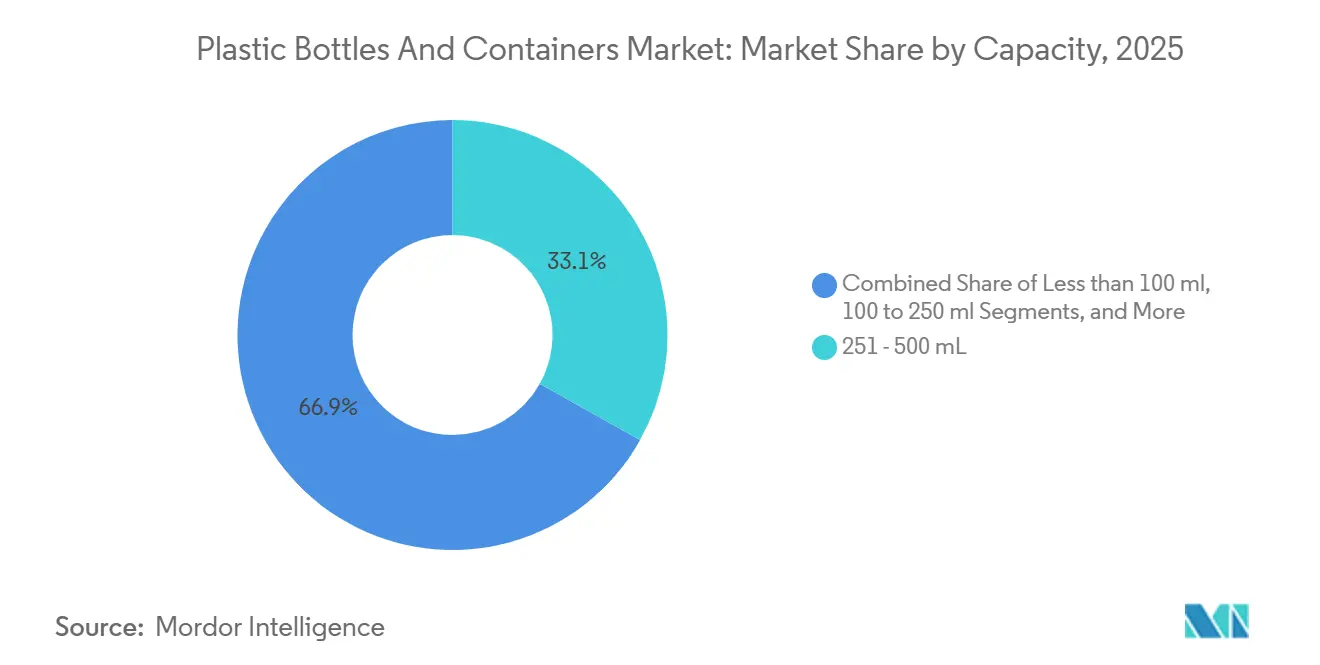
- By capacity range, the 251 to 500 milliliter bracket held 33.12% of 2025 volume, while containers larger than 1,000 milliliters are projected to advance at a 4.74% CAGR between 2026 and 2031
- By end-user, beverages commanded 38.53% of the 2025 volume base, whereas pharmaceuticals are expected to advance at a 5.01% CAGR through 2031.
- By geography, Asia-Pacific retained a 37.65% share of the plastic bottles and containers market in 2025, and Africa is forecast to post the steepest regional CAGR at 4.73% to 2031.
Note: Market size and forecast figures in this report are generated using Mordor Intelligence’s proprietary estimation framework, updated with the latest available data and insights as of 2026.
Global Plastic Bottles and Containers Market Trends and Insights
Drivers Impact Analysis*
| Driver | (~) % Impact on CAGR Forecast | Geographic Relevance | Impact Timeline |
|---|---|---|---|
| Lightweight, Shatter-Resistant Packaging | +0.9% | Global with Peak Adoption in North America and Europe | Medium Term (2–4 Years) |
| Cost Advantage and Scalability of PET and HDPE | +0.7% | Global, Strongest in Asia-Pacific and South America | Long Term (≥4 Years) |
| Surge in E-Commerce Logistics | +0.6% | North America, Europe and Urban Asia-Pacific Hubs | Short Term (≤2 Years) |
| Brand Circularity Push for rPET | +0.8% | Europe and North America with Spillover to Asia-Pacific | Medium Term (2–4 Years) |
| EU Tethered-Cap Regulation-Driven Volumes | +0.3% | European Union Member States | Short Term (≤2 Years) |
| Aseptic Cold-Fill for Dairy Alternatives | +0.4% | North America and Europe, Emerging in Urban Asia-Pacific | Medium Term (2–4 Years) |
| Source: Mordor Intelligence | |||


Lightweight, Shatter-Resistant Packaging
E-commerce channels set a damage-free delivery threshold below 0.5%, a level that 15 to 20-gram PET bottles consistently surpass. Precision-engineered resins launched in 2024 enable further wall-thickness cuts of 10 to 15% while holding top-load strength above 200 newtons, allowing palletized loads to travel through tropical supply chains without distortion.[1]Dow Inc., “INNATE Precision Packaging Resins,” dow.com Beverage producers in India and Brazil trimmed freight spend by up to 7% after shifting to these thinner containers, and lighter bottles defer mold-replacement capital for converters, keeping line speeds intact. The driver lifts adoption across beverages, cosmetics, and household liquids and, in turn, elevates demand for stretch-blow equipment upgrades that produce high-output lightweight formats.
Cost Advantage and Scalability of PET and HDPE
Virgin PET resin traded at USD 1,200 to USD 1,350 per tonne in 2025, roughly half the landed cost of aluminum on an equivalent-package basis, a gap that sustains PET’s economic edge in mass-market beverages and household care. HDPE blow-molding lines achieve 6,000 to 8,000 bottles per hour, doubling the throughput of comparable injection-stretch lines and cutting per-unit energy use.[2]Capital costs remain manageable because a single 16-cavity HDPE mold amortizes over 30 to 40 million cycles, keeping tooling costs below USD 0.004 per bottle. Integrated producers in the Middle East that run 500,000-tonne trains supply converters at double-digit discounts against European spot resin, reinforcing the scale story across price-sensitive categories.
Surge in E-Commerce Logistics
Online grocery and personal-care orders climbed at double-digit rates in 2024 and 2025, and automated sortation centers now require uniform neck finishes that mate with vision-guided grippers. PET’s dimension stability from –10 °C to +40 °C avoids thermal-shock failures common with glass during extreme cold or heat, and third-party logistics providers report 60 to 70% fewer damage claims after switching from glass to PET for 750 milliliter beverages. Consistent bottle geometry also reduces pick-and-place jams, yielding throughput gains and labor savings at high-volume hubs in Germany and the United Kingdom.
Brand Circularity Push for rPET
Global consumer-goods companies pledged steep recycled-content targets, stimulating 300,000 to 400,000 tonnes of new mechanical rPET capacity in 2024 and 2025.[3]Coca-Cola HBC AG, “2024 Integrated Annual Report,” coca-colahellenic.com Extended producer responsibility fees of EUR 100 to EUR 400 per tonne (USD 113 to USD 452) on non-recycled plastic in leading European markets further nudge brands toward rPET, even when premiums over virgin resin stretch to 15%. Investments in chemical recycling pilot plants add supply depth by turning mixed-color feedstock into food-grade monomers, a path that widens material availability once cost gaps narrow.
Restraints Impact Analysis*
| Restraint | (~) % Impact on CAGR Forecast | Geographic Relevance | Impact Timeline |
|---|---|---|---|
| Single-Use-Plastic Bans and Taxes | -0.5% | Europe, North America and Selected Asia-Pacific Markets | Short Term (≤2 Years) |
| Shift to Aluminum and Paper Alternatives | -0.4% | North America and Europe, Urban Asia-Pacific | Medium Term (2–4 Years) |
| Volatile PCR Resin Supply | -0.3% | Global with Acute Pressure in Europe and North America | Short Term (≤2 Years) |
| Lightweight Glass Technology Eroding Weight Edge | -0.2% | Europe and North America Premium Segments | Long Term (≥4 Years) |
| Source: Mordor Intelligence | |||
Single-Use-Plastic Bans and Taxes
Vietnam banned single-use bottles below 500 milliliters from January 2026, eliminating nearly 1.2 billion units per year from plastic pipelines. California’s SB 54 requires a 25% cut in single-use packaging by 2032, prompting soft-drink fillers to trial paper and aluminum lines at 50-80 million-unit scale.[4]California Legislature, “Senate Bill 54 - Plastic Pollution Producer Responsibility Act,” leginfo.legislature.ca.go Deposit-return schemes in Canada push refund rates to 75 to 80%, yet add USD 0.06 to USD 0.09 per bottle in reverse-logistics cost. Extended producer responsibility surcharges in Europe reach EUR 400 per tonne (USD 452), straining small converters that lack fiscal room to absorb fees. Collectively, these policies remove low-margin volumes and accelerate the search for circular or alternative substrates.
Shift to Aluminum and Paper Alternatives
Major beverage companies in India and the United States invested nine figures in aluminum can capacity between 2024 and 2025. Metal’s infinite recyclability narrative resonates with consumers, allowing price premiums of USD 0.05 to USD 0.08 per 16-ounce unit over PET. Paper-based bottles reached 15 million units in 2025 during consortium trials, but remain twice as expensive as comparable plastic bottles, limiting penetration to premium spirits and limited-release soft drinks. While cost keeps adoption moderate today, rising regulatory pressure and marketing initiatives give alternative formats room to chip away at PET’s share in carbonated drinks and ready-to-drink coffee.
*Our forecasts treat driver/restraint impacts as directional, not additive. The impact forecasts reflect baseline growth, mix effects, and variable interactions.
Segment Analysis
By Material: PET Dominance Faces Bio-Based Disruption
PET held a commanding 41.32% volume share in 2025 owing to its clarity, carbonation tolerance and compatibility with high-speed stretch-blow platforms, yet bio-based resins represent the fastest-expanding frontier. Avantium opened a 5,000-tonne polyethylene furanoate plant in 2024, and early runs deliver an oxygen barrier 30% higher than PET, extending shelf life for oxygen-sensitive beverages. Meanwhile, Danone deployed PHA in pilot Evian bottles that biodegrade in marine conditions within 18 months. High-density polyethylene retains loyalty among household cleaners and pharmaceuticals, where opacity and caustic resistance outweigh clarity. Low-density polyethylene and polypropylene stay entrenched in squeezables and hot-fill juice, while ultra-premium cosmetics explore polycarbonate and polyethylene naphthalate for UV and dimensional stability.
Regulators tip the balance toward recyclable streams, with the European Union pressing for 25% recycled content by 2030, a threshold that mechanically recyclable PET and HDPE can meet sooner than compostable grades lacking collection systems. Branded initiatives boost demand for rPET, while chemical recycling pilots address the color and viscosity limitations of mechanical recycling loops. The interplay of performance, cost, and compliance ensures PET remains the scale backbone, yet niche premium slots open for PEF, PHA, and PLA as their cost curves slide on new capacity.


By Manufacturing Process: Injection Blow Molding Gains in Pharma
Stretch blow molding accounted for 56.73% of 2025 output, driven by 40,000- to 60,000-bottle-per-hour lines that meet carbonated soft-drink pressure thresholds. Injection blow molding, however, is projected to log a 4.63% CAGR to 2031 as drug makers demand neck-finish tolerances of ±0.1 millimeter for sterile, tamper-evident closures. Gerresheimer’s EUR 50 million (USD 56.5 million) Indian facility opened in 2025 to serve antibiotic suspensions from 10 to 100 milliliters. The single-stage process shaves 15 to 20% of energy relative to two-stage stretch lines and uses 6 to 8-second spin cycles for small bottles.
Extrusion blow molding keeps a foothold in 2-liter to 5-liter detergent and motor oil jugs, where integrated handles matter more than clarity. Servo-driven stretch lines from Sidel now lower preform weight by 15% while maintaining a 200 newton top load, saving converters up to USD 20 million annually on resin. Clean-room standards such as ISO 15378 raise process-control expectations, and traceability logs are mandatory for high-value biologics, driving capital toward precision equipment and automated vision inspection.
By Capacity Range: Large Formats Lead Pharma Growth
The 251 milliliter to 500 milliliter band owned 33.12% of 2025 volume for single-serve beverages, yet containers above 1,000 milliliters are advancing at a 4.74% CAGR as intravenous solutions, bulk cleaners, and family-size cooking oils migrate into plastic. Baxter and Fresenius shifted IV fluids to semi-rigid PET, eliminating DEHP concerns tied to PVC bags and trimming costs by up to 40%. In consumer packaged goods, 4-liter concentrated laundry detergents introduced by Unilever cut per-wash packaging by 60% and integrated dosing caps for convenience.
Small formats under 100 milliliters thrive in travel cosmetics and single-dose antibiotics, relying on injection blow molding for dimensional precision. Mid-range 100- to 250-milliliter energy drinks and oral rehydration therapies trade on portion control. Caps tether mandated across the European Union since July 2024 add USD 0.02 per unit to tooling costs yet curb litter rates, a design overhaul that spans every capacity bracket. Converters that retrofit early gain market access, while late movers face customer defection to compliant suppliers.
By End-User Vertical: Pharmaceuticals Outpace Beverages
Beverages remained the largest end-user at 38.53% in 2025, but pharmaceutical demand grows the quickest, clocking a 5.01% CAGR to 2031 as biologics, gene therapies, and chronic-disease treatments proliferate. Amgen and Gilead moved from glass to amber PET for oral oncology tablets, avoiding shatter incidents that earlier cost USD 200 to USD 300 per breakage. Household care relies on HDPE’s chemical resistance for bleach and surfactant exposure, while personal-care brands exploit PET-G for a luxury look and feel.
Food companies continue to adopt squeezable HDPE and PP in sauces and condiments, aided by high-recycled-content mandates in leading retailers’ scorecards. Automotive and agrochemical users need UN-certified closures and tactile warnings, and strict child-resistant features raise specifications. Demographic aging fuels demand for 30-day and 90-day pill formats, and the World Health Organization projects a population of 2.1 billion aged 60 and above by 2050, setting a durable volume tailwind. Beverage growth moderates but remains resilient, leveraging premiumization in Asia, where aspirational consumers trade up to larger PET bottles that convey status.
Geography Analysis
Asia-Pacific represented 37.65% of 2025 consumption, anchored by China’s 18 million-tonne PET bottle output and India’s 6 million tonnes. Domestic collection rates under China’s National Sword policy reached 32% in 2025 and continue to edge higher as Shanghai, Beijing, and Shenzhen enforce mandatory sortation. Rising beverage and pharmaceutical demand is accelerating growth in the India Plastic Bottles across multiple packaging applications. Local resin producers benefit from large-scale plants in Saudi Arabia and the United Arab Emirates, exporting PET to converters in Southeast and South Asia at prices 10 to 15% lower than European spot. Brands in Japan and South Korea are accelerating the adoption of tethered caps ahead of export-market compliance deadlines, further driving mold investments across the region.
Africa, though starting from a smaller base, posts the fastest 4.73% CAGR to 2031 as Nigeria, South Africa and Kenya deepen injection-molding capability. Indorama’s 60,000-tonne compounding site in Lagos plus 200 million preforms per year slashes lead times from eight weeks to two and shields bottlers from currency swings. Nampak’s debt reduction freed cash for PET bottle lines supplying Coca-Cola Beverages Africa, and local fillers value just-in-time access over imported preforms that previously clogged congested ports. East African Community states draft harmonized packaging rules that mirror European recycling targets, a step that should unify resin specifications and accelerate rPET infrastructure.
Europe and North America collectively hold about 45% share but face the heaviest regulatory cost stack. Extended producer responsibility charges raise delivered bottle cost by EUR 0.08 to EUR 0.12 (USD 0.09 to USD 0.14) in Germany, while deposit-return schemes expand across U.S. states after successful pilots in Oregon and Michigan. South America builds capacity around Brazilian and Argentine beverage hubs, with Ambev and Coca-Cola FEMSA commissioning plants that feed two-liter carbonated soft drinks popular with value-seeking shoppers. The Middle East leverages integrated petrochemical economics to export preforms into North Africa and Southern Europe, sustaining a cost-advantage position and widening regional trade flows.

Competitive Landscape
The plastic bottles and containers market is moderately fragmented. The top five converters, namely Amcor, ALPLA, Silgan, Graham Packaging, and Berry Global, prior to its sale, hold 35 to 40% of global installed capacity. Amcor’s USD 8.43 billion acquisition of Berry Global, slated to close by March 2026 after conditional antitrust clearance, will create a USD 24 billion revenue entity with more than 400 plants. Expected synergies of USD 650 million by 2028 stem from unified resin tenders, shared research pipelines, and optimized footprints.
ALPLA invested EUR 50 million (USD 56.5 million) in recycling plants across Poland, Mexico, and Thailand in 2024 and 2025, securing 100,000 tonnes of food-grade rPET supply. Silgan is expanding injection-blow capacity in Missouri to add 200 million pharmaceutical units annually, while Gerresheimer’s clean-room push underpins its leadership in certified drug-delivery formats. Equipment suppliers, including Sidel, KHS, and Husky, drive lightweighting through servo-driven blow-molding, enabling 15% resin savings without compromising top-load.
Mid-tier specialists such as Resilux, Retal, and Greiner build regional strength through quick-turn design services and niche materials. Blockchain-enabled track-and-trace pilots by Plastipak and Resilux assign unique QR codes to each unit, raising deposit-return collection from 65% to 78% in German trials and signaling a digital pivot across supply chains. Intellectual-property owners Avantium and Danimer Scientific license PEF and PHA technology with royalty models that forgo capital-heavy polymerization, earning 3 to 5% of material value and focusing on R&D. Patent filings at the European Patent Office surged in 2024 and 2025 around mono-material barrier coatings and hinged-cap designs that meet EU recyclability grades A and B.
Plastic Bottles and Containers Industry Leaders
Amcor plc
ALPLA Group
Graham Packaging Company
Silgan Holdings Inc.
Gerresheimer AG
- *Disclaimer: Major Players sorted in no particular order

Recent Industry Developments
- February 2026: Amcor plc received conditional approval from the United States Federal Trade Commission for its USD 8.43 billion acquisition of Berry Global Group, with closure expected by Mar 2026 pending European Commission clearance. The company targets USD 650 million annual synergies by 2028.
- January 2026: Indorama Ventures completed its purchase of Invictus Pet Care’s Nigerian assets, adding 60,000 tonnes of PET compounding and 200 million preforms a year, cutting Lagos lead times from eight weeks to two.
- December 2025: ALPLA Group inaugurated a EUR 30 million (USD 33.9 million) recycling plant in Austria that produces 35,000 tonnes of food-grade rPET annually.
- November 2025: Silgan Holdings announced a USD 120 million expansion in Missouri to add 200 million injection-blow pharmaceutical bottles per year, completion slated for Q3 2026.
- October 2025: Gerresheimer commissioned a EUR 50 million (USD 56.5 million) plant in Kosamba, India with 12 injection-blow lines capable of 500 million bottles annually


Global Plastic Bottles and Containers Market Report Scope
The Plastic Bottles and Containers Market Report is Segmented by Material (PET, HDPE, LDPE, PP, Bio-Based and Compostable Plastics, Other Materials), Manufacturing Process (Extrusion Blow Molding, Injection Blow Molding, Stretch Blow Molding, Other Processes), Capacity Range (Less Than 100 mL, 100-250 mL, 251-500 mL, 501-1,000 mL, More Than 1,000 mL), End-User Vertical (Beverages, Food, Cosmetics and Personal Care, Pharmaceuticals, Household Care, Other Verticals), and Geography (North America, South America, Europe, Asia-Pacific, Middle East, Africa). The Market Forecasts are Provided in Terms of Volume (Million Tonnes).
By Material
| Polyethylene Terephthalate (PET) |
| High-Density Polyethylene (HDPE) |
| Low-Density Polyethylene (LDPE) |
| Polypropylene (PP) |
| Bio-Based and Compostable Plastics |
| Other Materials |
By Manufacturing Process
| Extrusion Blow Molding |
| Injection Blow Molding |
| Stretch Blow Molding |
| Other Manufacturing Processes |
By Capacity Range
| Less Than 100 mL |
| 100 to 250 mL |
| 251 to 500 mL |
| 501 to 1,000 mL |
| More Than 1,000 mL |
By End-User Vertical
| Beverages |
| Food |
| Cosmetics and Personal Care |
| Pharmaceuticals |
| Household Care |
| Other End-User Verticals |
By Geography
| North America | United States |
| Canada | |
| Mexico | |
| South America | Brazil |
| Argentina | |
| Chile | |
| Rest of South America | |
| Europe | United Kingdom |
| Germany | |
| France | |
| Italy | |
| Spain | |
| Russia | |
| Rest of Europe | |
| Asia-Pacific | China |
| India | |
| Japan | |
| South Korea | |
| Australia | |
| Malaysia | |
| Rest of Asia-Pacific | |
| Middle East | Saudi Arabia |
| United Arab Emirates | |
| Turkey | |
| Rest of Middle East | |
| Africa | South Africa |
| Nigeria | |
| Rest of Africa |
| By Material | Polyethylene Terephthalate (PET) | |
| High-Density Polyethylene (HDPE) | ||
| Low-Density Polyethylene (LDPE) | ||
| Polypropylene (PP) | ||
| Bio-Based and Compostable Plastics | ||
| Other Materials | ||
| By Manufacturing Process | Extrusion Blow Molding | |
| Injection Blow Molding | ||
| Stretch Blow Molding | ||
| Other Manufacturing Processes | ||
| By Capacity Range | Less Than 100 mL | |
| 100 to 250 mL | ||
| 251 to 500 mL | ||
| 501 to 1,000 mL | ||
| More Than 1,000 mL | ||
| By End-User Vertical | Beverages | |
| Food | ||
| Cosmetics and Personal Care | ||
| Pharmaceuticals | ||
| Household Care | ||
| Other End-User Verticals | ||
| By Geography | North America | United States |
| Canada | ||
| Mexico | ||
| South America | Brazil | |
| Argentina | ||
| Chile | ||
| Rest of South America | ||
| Europe | United Kingdom | |
| Germany | ||
| France | ||
| Italy | ||
| Spain | ||
| Russia | ||
| Rest of Europe | ||
| Asia-Pacific | China | |
| India | ||
| Japan | ||
| South Korea | ||
| Australia | ||
| Malaysia | ||
| Rest of Asia-Pacific | ||
| Middle East | Saudi Arabia | |
| United Arab Emirates | ||
| Turkey | ||
| Rest of Middle East | ||
| Africa | South Africa | |
| Nigeria | ||
| Rest of Africa | ||


Key Questions Answered in the Report
What CAGR is expected for volumes shipped between 2026 and 2031?
Mordor Intelligence projects a 3.78% CAGR for global shipments over the period.
Which polymer currently has the largest share of global bottle tonnage?
PET accounted for 41.32% of 2025 volume owing to its clarity and carbonation resistance.
Which end-use sector is forecast to grow the fastest?
Pharmaceuticals lead with an expected 5.01% CAGR through 2031 as biologic and chronic-care therapies scale.
Why are converters expanding injection-blow capacity?
Drug makers require ±0.1 millimeter neck-finish precision and ISO 15378 traceability, benefits inherent to injection blow molding.
Which region will see the quickest capacity growth?
Africa is projected to register the highest regional CAGR at 4.73% as Nigeria, South Africa and Kenya localize preform output.
Page last updated on:


