Market Overview
| Study Period | 2020 - 2031 |
|---|---|
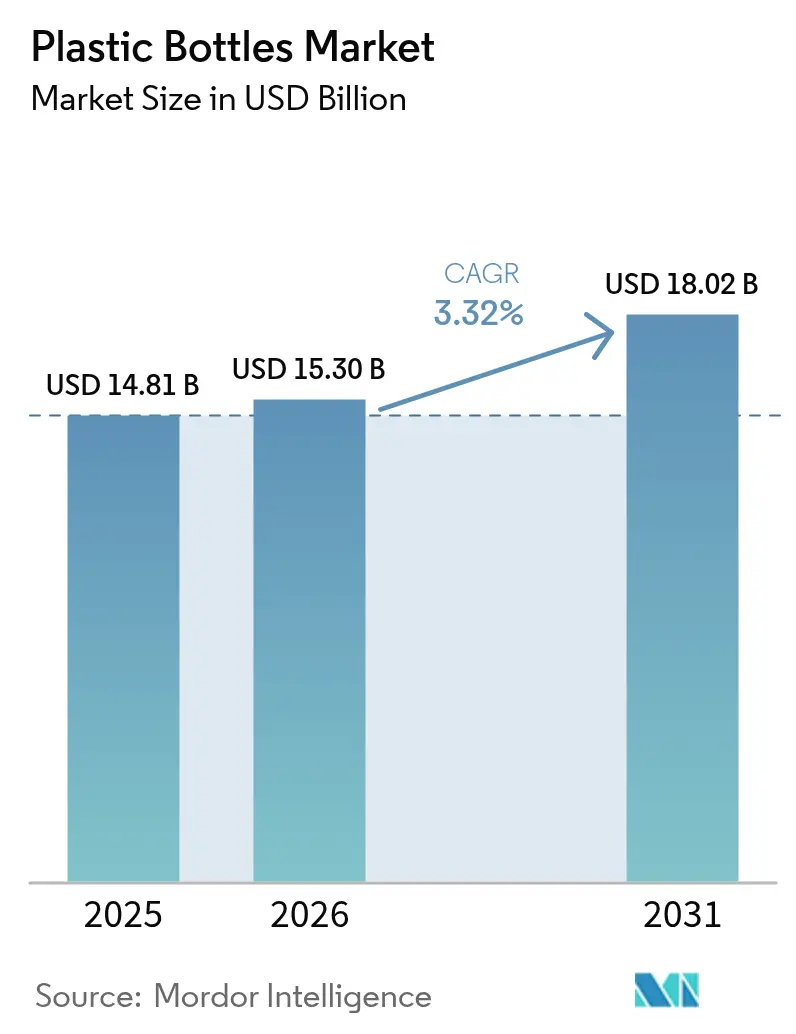
| Market Size (2026) | USD 15.3 Billion |
| Market Size (2031) | USD 18.02 Billion |
| Growth Rate (2026 - 2031) | 3.32% CAGR |
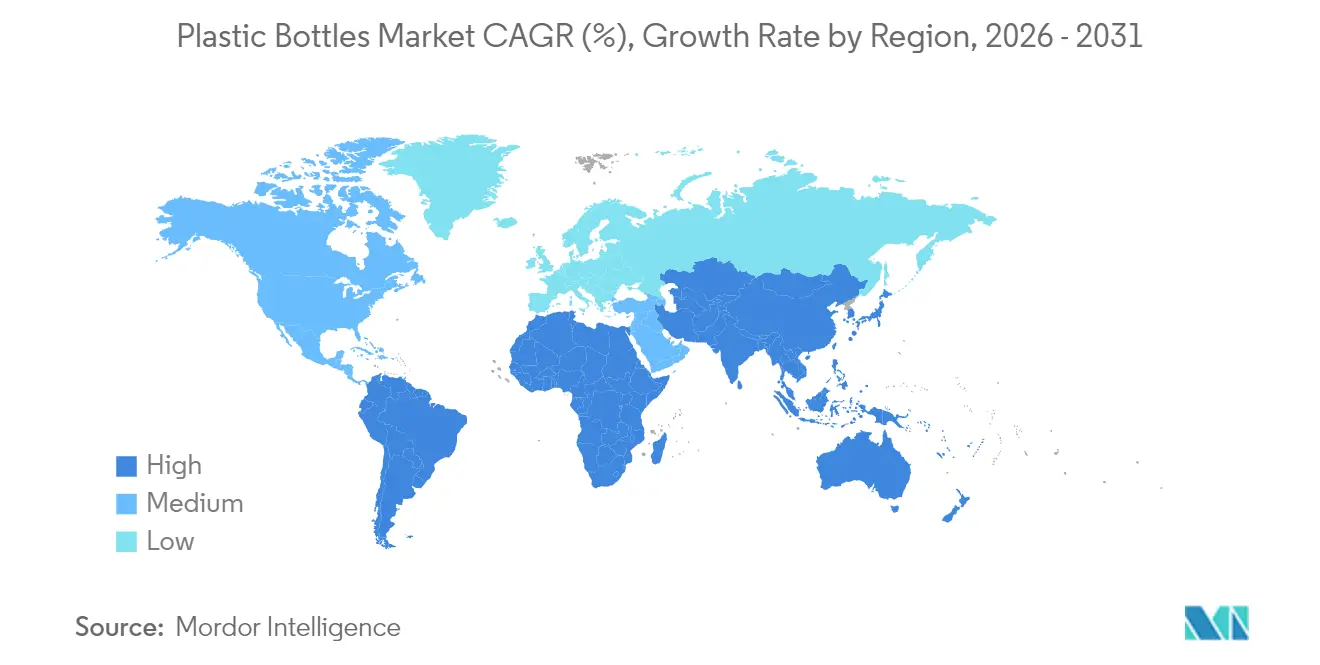
| Fastest Growing Market | Asia Pacific |
| Largest Market | Asia Pacific |
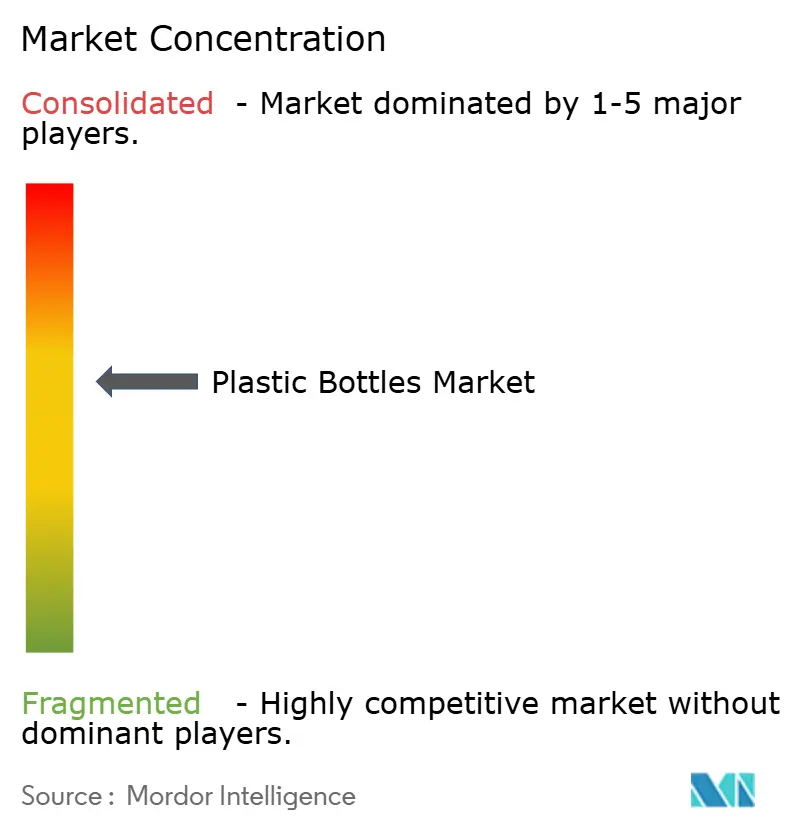
| Market Concentration | Medium |
Major Players *Disclaimer: Major Players sorted in no particular order Image © Mordor Intelligence. Reuse requires attribution under CC BY 4.0. | |
Plastic Bottles Market Analysis by Mordor Intelligence
plastic bottles market size in 2026 is estimated at USD 15.3 billion, growing from 2025 value of USD 14.81 billion with 2031 projections showing USD 18.02 billion, growing at 3.32% CAGR over 2026-2031. Momentum persists because manufacturers continue to leverage lightweight designs, cost efficiency, and global supply chain scalability, even as regulatory and sustainability pressures mount. Demand escalates in beverage, pharmaceutical, and personal-care categories where shatter resistance, barrier performance, and portability remain core purchase drivers. A parallel wave of regulatory action, most notably single-use plastic taxes and tethered-cap mandates, accelerates investment in recycled PET (rPET) and advanced lightweighting technologies.[1]European Commission, “Single-Use Plastics Directive Implementation Report 2024,” ec.europa.eu Competitive intensity is shaped by brand commitments to circularity, surging e-commerce logistics needs, and steady capital inflows that fund capacity upgrades and acquisitions. Continuous process automation, real-time quality monitoring, and high-speed molding lines enable leading converters to protect their margins despite volatile resin prices and the rising costs of extended producer responsibility programs.
Key Report Takeaways
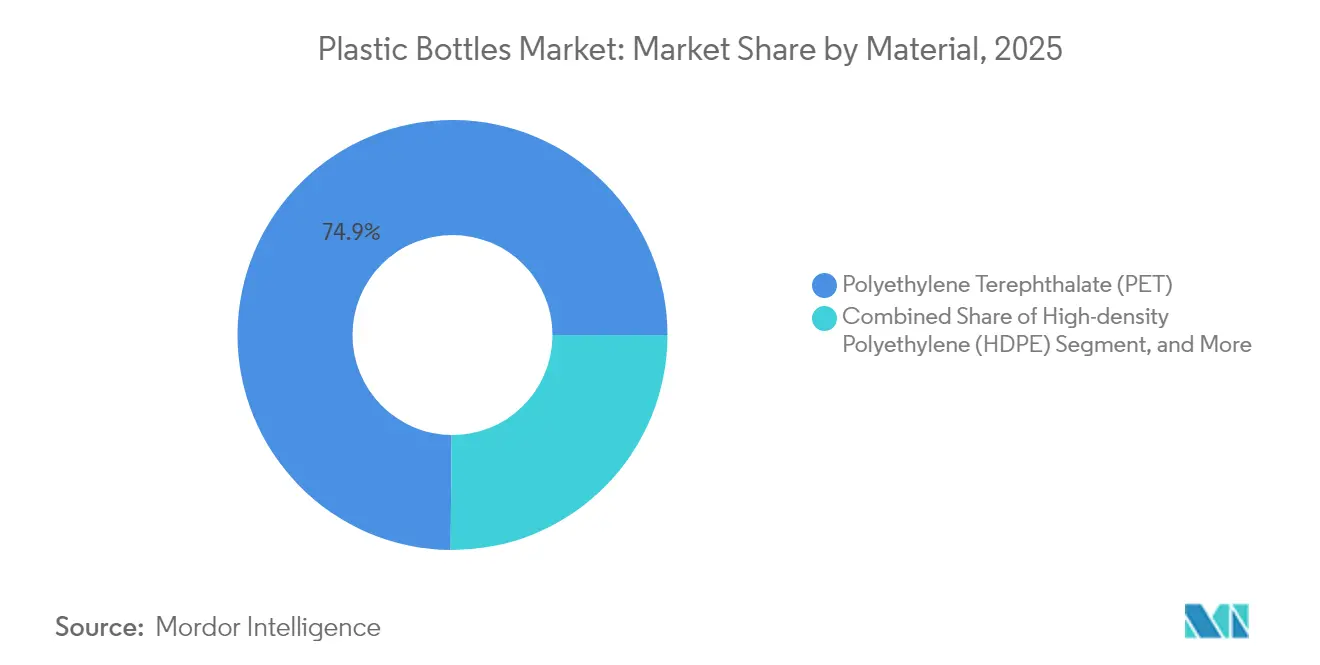
- By material, PET accounted for 74.86% of the plastic bottle market share in 2025, while bio-based PET posted the fastest expansion at a 4.03% CAGR through 2031.
- By manufacturing process, injection blow molding accounted for 47.55% of the plastic bottles market size in 2025, whereas extrusion blow molding recorded the highest growth at a 4.45% CAGR from 2025 to 2031.
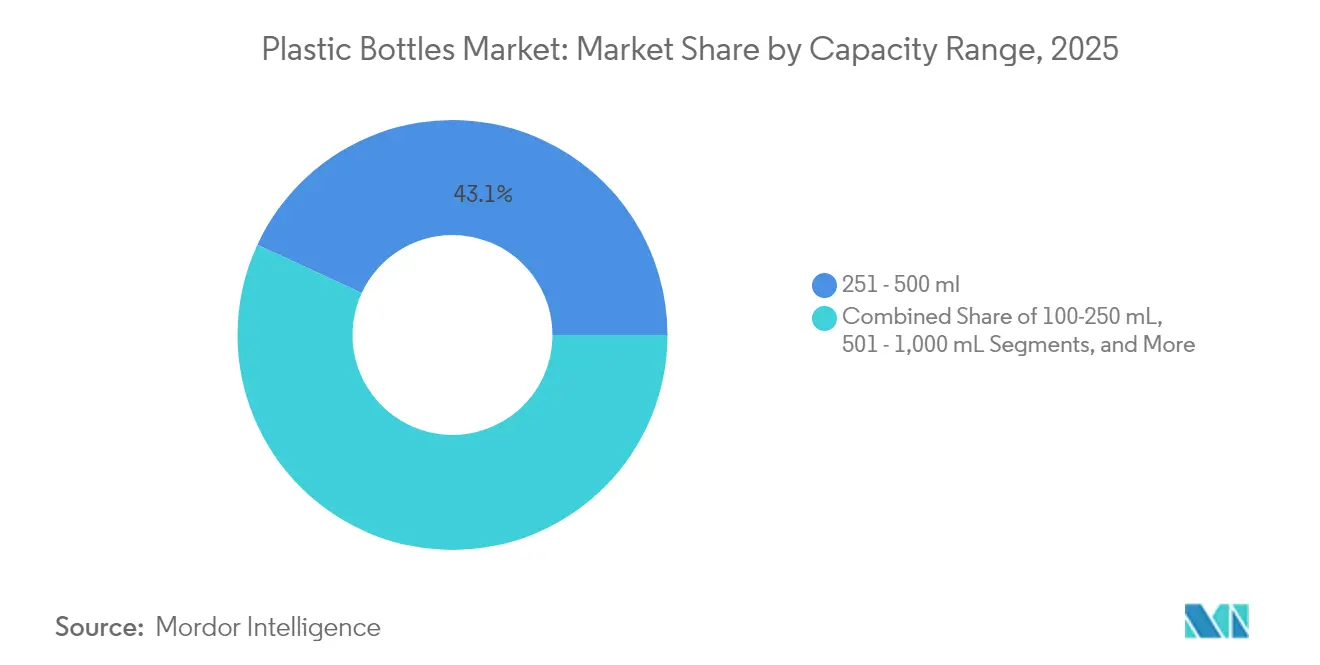
- By capacity, the 251-500 mL segment captured 43.10% share of the plastic bottles market size in 2025, and the 100-250 mL category is projected to advance at a 4.29% CAGR during the forecast period.
- By end-user, beverages led with 55.02% revenue share in 2025, while pharmaceuticals are forecast to expand at 4.11% CAGR through 2031.
- By geography, the Asia Pacific accounted for 45.92% of the plastic bottles market share in 2025 and remains the fastest-growing region, with a 4.36% CAGR to 2031.
Note: Market size and forecast figures in this report are generated using Mordor Intelligence’s proprietary estimation framework, updated with the latest available data and insights as of 2026.
Global Plastic Bottles Market Trends and Insights
Drivers Impact Analysis*
| Driver | (~) % Impact on CAGR Forecast | Geographic Relevance | Impact Timeline |
|---|---|---|---|
| Rising demand for lightweight, shatter-resistant packaging | +0.8% | Global with stronger impact in Asia Pacific and North America | Medium term (2–4 years) |
| Cost advantage and scalability of PET/HDPE | +0.6% | Global, significant in price-sensitive markets | Long term (≥ 4 years) |
| Surge in e-commerce logistics | +0.5% | North America and Europe leading, Asia-Pacific catching up rapidly | Short term (≤ 2 years) |
| Brand circularity push for rPET | +0.4% | Europe and North America core, expanding to Asia Pacific | Medium term (2–4 years) |
| EU tethered-cap regulation-driven volumes | +0.3% | Europe primary, spillover globally | Short term (≤ 2 years) |
| Aseptic cold-fill for dairy alternatives | +0.2% | Global, early adoption in developed markets | Medium term (2–4 years) |
| Source: Mordor Intelligence | |||
Rising Demand for Lightweight, Shatter-Resistant Packaging
Weight-optimized PET bottles now come in 30% lighter than earlier versions yet maintain structural integrity, letting brand owners cut transport costs by as much as 15% per unit shipped. E-commerce amplifies the benefit because each gram saved lowers dimensional-weight charges and carbon footprints over long, parcel-based distribution routes. Continuous resin engineering enables thinner wall sections without compromising top-load strength, allowing for high-speed filling and reducing pallet weight in bulk channels. PlantBottle technology, which blends PET with 30% plant-derived content, illustrates how weight reduction and renewable feedstocks can coexist for mainstream beverage formats. Collectively, these advances keep the plastic bottles market competitive against glass and aluminum in logistics-intensive supply chains.
Cost Advantage and Scalability of PET/HDPE
Production economics remain compelling: PET and HDPE bottles cost 40-60% less per liter of capacity than aluminum and 70-80% less than glass. During the 2024 supply-chain disruptions, plastic converters restored normal output 3 times faster than glass producers, thanks to shorter furnace downtime and more flexible labor needs. New high-speed injection systems deliver 25% productivity gains and 15% lower kilowatt-hour consumption per bottle, easing operating-expense pressure even when crude-derived resin prices fluctuate. Scalable line changeovers allow contract packers to adjust quickly to SKU rotations tied to seasonal promotions, thereby reinforcing the dominance of the plastic bottles market across mass-volume consumer categories.
Surge in E-Commerce Logistics
Online retail triggers packaging redesign to survive multiple handoffs and automated fulfillment centers. Digital platforms report 40% lower breakage for plastic compared with glass containers over equivalent shipping distances. Consequently, brands reformulate packaging specifications to prioritize drop-test performance, side-wall crush resistance, and stack-height metrics over shelf-display aesthetics. The transition is especially intense in emerging economies where e-commerce infrastructure scales faster than brick-and-mortar retail. Amazon’s Frustration-Free Packaging certification incorporates performance criteria that favor PET and HDPE bottles, influencing upstream mold designs and resin choices among suppliers in the plastic bottle market.
Brand Circularity Push for rPET
Major beverage and personal-care companies have pledged to achieve 25-50% recycled content by 2030. Coca-Cola aims for 50% globally, and Danone has sold 100% rPET Evian bottles in several European countries.[2]Coca-Cola Company, “2024 Sustainability Report: Packaging Innovation and Circular Economy Progress,” thecoca-colacompany.com Recycled resin fetches a 10-15% premium over virgin feedstock; yet, brands absorb the surcharge for marketing benefits and regulatory compliance under extended producer responsibility rules. Stable demand signals unlock capital investment in advanced recycling, enabling the chemically depolymerization of PET for a near-virgin quality resin supply. Securing a rPET supply thus becomes a strategic imperative, driving joint ventures, long-term offtake contracts, and technology licensing in the plastic bottles market.
Restraints Impact Analysis*
| Restraint | (~) % Impact on CAGR Forecast | Geographic Relevance | Impact Timeline |
|---|---|---|---|
| Single-use-plastic bans and taxes | -0.7% | Europe leading, expanding globally | Short term (≤ 2 years) |
| Shift to aluminum and paper alternatives | -0.5% | North America and Europe primary | Medium term (2-4 years) |
| Volatile PCR resin supply | -0.3% | Global, acute in mandate regions | Short term (≤ 2 years) |
| Lightweight glass tech eroding weight edge | -0.2% | Premium segments in developed markets | Long term (≥ 4 years) |
| Source: Mordor Intelligence | |||
Single-Use-Plastic Bans and Taxes
The European Union’s directive removed 2.3 billion bottles from circulation in 2024, while Germany’s 0.49 USD per kg plastic tax increased compliance costs and accelerated the adoption of recycled content. Canada and multiple U.S. states drafted comparable measures, complicating global SKU management and labeling requirements. Smaller converters feel disproportionate margin pressure because they lack the capital to retrofit lines or diversify into alternative substrates. Although phased timelines soften the short-term shock, the cumulative impact clips volume growth inside the plastic bottles market.
Shift to Aluminum and Paper Alternatives
Aluminum bottle volumes climbed 15% in 2024, piggybacking on premium energy-drink and water brands that target sustainability-minded consumers. Paper-bottle pilots from Paboco transitioned from the lab to a limited shelf rollout with Carlsberg and L’Oréal, demonstrating consumer acceptance in niche segments. A stark 2-3 times unit-cost gap versus plastic still constrains mass adoption; yet, lifestyle branding and deposit-return incentives keep migration options on the brand manager's agenda. The resulting substrate diversification siphons incremental demand away from the plastic bottles market in high-margin categories.
*Our forecasts treat driver/restraint impacts as directional, not additive. The impact forecasts reflect baseline growth, mix effects, and variable interactions.
Segment Analysis
By Material: PET Dominance Drives Recycling Innovation
PET accounted for 74.86% of the plastic bottles market size in 2025, reflecting its performance balance of clarity, strength, and recyclability. HDPE is used for chemical-resistant household and pharma products, while LDPE serves squeezable formats and PP supports hot-fill needs. Bio-based resins such as PLA and PHA command premium pricing but gain traction under Europe’s renewable-content targets. Between 2026 and 2031, PET is projected to retain its leadership position, while bio-based blends are expected to log the highest CAGR, as brand owners pilot compostable solutions for niche use cases.
R&D collaborations proliferate: Danimer and PepsiCo advance PHA commercialization, and NatureWorks doubles PLA output to 150,000 tpa in its Thailand expansion. These moves expand material options, stimulate barrier-coating innovation, and reshape procurement strategies across the plastic bottles market.


By Manufacturing Process: Injection Molding Leads Despite Extrusion Growth
Injection blow molding captured 47.55 of % plastic bottles market share in 2025, owing to precision tolerance and surface-finish uniformity critical for pharma and cosmetics lines. Stretch-blow systems dominate the production of high-clarity beverage bottles, while extrusion blow molding, although only the second most popular by volume, is projected to grow at a 4.45% CAGR to 2031 due to its tooling flexibility and tolerance for recycled materials.
Industry 4.0 upgrades layer vision systems and predictive maintenance onto extrusion lines, minimizing downtime and scrap. Hybrid machines capable of both extrusion and injection operations facilitate shorter product-development cycles, supporting the agile SKU refreshes demanded by private-label retailers in the plastic bottles market.
By Capacity Range: Mid-Range Bottles Capture Consumer Preferences
The 251-500 mL bracket accounted for 43.10% of the plastic bottle market size in 2025, striking a balance between grab-and-go convenience and value. The 100-250 mL mini format exhibits a 4.29% CAGR, as on-the-go nutrition shakes and functional beverages continue to proliferate. Premium branding banks on smaller footprints to justify higher per-ounce pricing while reducing waste from unfinished servings.
Conversely, 501-1,000 mL SKUs support family consumption, and packs above 1 L remain crucial in institutional catering. Portfolio analytics are increasingly factoring in carbon impact per liquid ounce, prompting some brands to recalibrate their size mixes to optimize both consumer experience and sustainability KPIs within the plastic bottles market.
By End-User Vertical: Beverage Sector Leadership Amid Diversification
Beverages represented 55.02% of the plastic bottle market share in 2025, as carbonated soft drinks, bottled water, and RTD teas rely on PET for their shelf appeal and CO₂ retention. Pharmaceutical bottles, although smaller in volume, are expected to register a 4.11% CAGR due to the increasing demand for liquid-drug formulations, pediatric suspensions, and syrups that require barrier-enhanced PET.
Personal-care packaging features sophisticated shapes, tactile finishes, and post-consumer resin blends to reinforce brand storytelling centered on wellness. Meanwhile, food sauces and dressings are migrating to squeezable multilayer bottles that extend shelf life without the need for preservatives, thereby diversifying volume streams within the plastic bottles market.
Geography Analysis
The Asia Pacific held a 45.92% market share of the plastic bottles market in 2025 and is projected to grow at a 4.36% CAGR through 2031. China, accounting for more than half of the regional volume, leverages an integrated PET resin supply and cost-competitive labor to meet both domestic and export demand. India’s rapid adoption of e-commerce, combined with stricter food packaging laws, fuels double-digit unit growth, while Indonesia, Malaysia, and Thailand emerge as contract manufacturing nodes for multinational brand owners. Nations across the region are rolling out deposit-return schemes that stimulate post-consumer collection, yet they still lag behind European recovery rates.
North America displays maturity, but not as much innovation depth. The United States hosts advanced chemical recycling pilots and brand-led post-consumer resin offtake contracts that secure rPET feedstock. Canada’s federal single-use plastic ban accelerates substrate and design shifts, and Mexico leverages cost-advantaged conversion capacity that serves both domestic and export-oriented filling plants. Sustainability labeling and California’s 2024 minimum-recycled-content law compel supply-chain transparency and elevate recycled-resin pricing across the plastic bottles market.
Europe remains regulation-driven. Germany’s deposit system recovers more than 90% of PET, and tethered-cap rules drive mold and hardware upgrades. France intensifies PCR mandates, while Italy focuses on biodegradable products. The United Kingdom, post-Brexit, establishes parallel but divergent EPR fees that spur localized design tweaks. Central and Eastern Europe see capacity investment as converters chase lower utilities and labor expenses. Elsewhere, South America expands its penetration of packaged goods, while the Middle East and Africa markets anchor long-term prospects as urbanization and cold-chain infrastructure mature.

Competitive Landscape
The plastic bottles market is moderately fragmented, with the top five converters controlling about 45% of global volume. Amcor, ALPLA, and Graham Packaging combine worldwide footprints, proprietary lightweighting tech, and multi-year supply contracts with the largest FMCG firms. Amcor’s USD 8.43 billion acquisition of Berry Global’s rigid unit in October 2024 adds North American closures, boosting vertical integration and customer wallet share.
ALPLA’s USD 49 million Vietnam plant brings 1.2 billion bottles of annual capacity online, exemplifying the direction of capex toward Asia Pacific end-markets.[3]ALPLA Group, “Vietnam Manufacturing Facility Expansion Project,” alpla.com Graham Packaging’s pharma barrier PET breakthrough triples oxygen-shelf-life performance, safeguarding high-value liquid drugs and reinforcing premiumization. Private-equity ownership of medium-sized converters, such as Silgan’s acquisition of Weener Plastics for EUR 270 million (USD 293 million), underscores sustained deal appetite and the search for closures and dispensing.
Strategic themes center on weight reduction, scaling of recycled content, and digital traceability. Proprietary resin blends and design-for-recycling guidelines align with brand owner scorecards. Emerging disruptors invest in smart bottles that embed QR codes and NFC chips for authentication and refill programs. Combined, these vectors influence price realization, customer lock-in, and margin resilience across the plastic bottles market.
Plastic Bottles Industry Leaders
Gerresheimer AG
Amcor plc
ALPLA Werke Alwin Lehner GmbH & Co KG
Grief, Inc.
Silgan Holdings Inc.
- *Disclaimer: Major Players sorted in no particular order

Recent Industry Developments
- October 2024: Amcor announced the acquisition of Berry Global’s rigid packaging business for USD 8.43 billion, creating the world’s largest rigid packaging company with expanded bottle and container capabilities.
- September 2024: ALPLA Group has completed construction of its new USD 45 million PET facility in Vietnam, adding 1.2 billion bottles to its annual output and meeting Southeast Asian demand.
- August 2024: Graham Packaging launched a barrier-enhanced PET bottle for pharmaceuticals that improves oxygen protection by 50% at cost parity with conventional materials.
- July 2024: Silgan Holdings bought Weener Plastics Group for EUR 270 million (USD 293 million), strengthening its European presence and dispensing-systems portfolio.


Global Plastic Bottles Market Report Scope
Plastic bottles generally include single-use and recyclable bottles made of plastic resins, such as PET, PP, and PE. These bottles are used by a comprehensive end-user industry, including food, beverage, and personal care. The plastic bottles market report offers an up-to-date analysis of the current market scenario, the latest trends and drivers, and the overall market environment. The study also identifies the continuous development of new products as a prime reason driving the plastic bottle market's growth during the next few years.
The plastic bottles market is segmented by resins (polyethylene (PE), polyethylene terephthalate (PET), polypropylene (PP), and other resins), end-user industry (food, beverage [bottled water, carbonated soft drinks, alcoholic beverages, juices and energy drinks, and other beverages], pharmaceutical, personal care and toiletries, industrial and household chemicals, paints and coatings, and other end-user industries), and geography (North America [United States and Canada], Europe [United Kingdom, Germany, France, Italy, Spain, Poland, Nordic, and the rest of Europe], Asia-Pacific [China, India, Japan, Thailand, Indonesia, Vietnam, Australia and New Zealand, and rest of Asia-Pacific], Latin America [Brazil, Colombia, Mexico, and rest of Latin America], and Middle East and Africa [Saudi Arabia, United Arab Emirates, Egypt, South Africa, Nigeria, Morocco, and rest of the Middle East and Africa]. The report offers market forecasts and size in volume (tonnes) and value (USD) for all the above segments.
By Material
| Polyethylene Terephthalate (PET) |
| High-density Polyethylene (HDPE) |
| Low-density Polyethylene (LDPE) |
| Polypropylene (PP) |
| Bio-based and Compostable Plastics |
| Other Materials |
By Manufacturing Process
| Extrusion Blow Molding |
| Injection Blow Molding |
| Stretch Blow Molding |
| Other Manufacturing Processes |
By Capacity Range
| Less than 100 mL |
| 100 - 250 mL |
| 251 - 500 mL |
| 501 - 1,000 mL |
| More than 1,000 mL |
By End-user Vertical
| Beverages |
| Food |
| Cosmetics and Personal Care |
| Pharmaceuticals |
| Household Care |
| Other End-user Verticals |
By Geography
| North America | United States | |
| Canada | ||
| Mexico | ||
| South America | Brazil | |
| Argentina | ||
| Chile | ||
| Rest of South America | ||
| Europe | United Kingdom | |
| Germany | ||
| France | ||
| Italy | ||
| Spain | ||
| Rest of Europe | ||
| Asia Pacific | China | |
| India | ||
| Japan | ||
| South Korea | ||
| Australia | ||
| Malaysia | ||
| Rest of Asia Pacific | ||
| Middle East and Africa | Middle East | Saudi Arabia |
| United Arab Emirates | ||
| Turkey | ||
| Rest of Middle East | ||
| Africa | South Africa | |
| Nigeria | ||
| Rest of Africa | ||
| By Material | Polyethylene Terephthalate (PET) | ||
| High-density Polyethylene (HDPE) | |||
| Low-density Polyethylene (LDPE) | |||
| Polypropylene (PP) | |||
| Bio-based and Compostable Plastics | |||
| Other Materials | |||
| By Manufacturing Process | Extrusion Blow Molding | ||
| Injection Blow Molding | |||
| Stretch Blow Molding | |||
| Other Manufacturing Processes | |||
| By Capacity Range | Less than 100 mL | ||
| 100 - 250 mL | |||
| 251 - 500 mL | |||
| 501 - 1,000 mL | |||
| More than 1,000 mL | |||
| By End-user Vertical | Beverages | ||
| Food | |||
| Cosmetics and Personal Care | |||
| Pharmaceuticals | |||
| Household Care | |||
| Other End-user Verticals | |||
| By Geography | North America | United States | |
| Canada | |||
| Mexico | |||
| South America | Brazil | ||
| Argentina | |||
| Chile | |||
| Rest of South America | |||
| Europe | United Kingdom | ||
| Germany | |||
| France | |||
| Italy | |||
| Spain | |||
| Rest of Europe | |||
| Asia Pacific | China | ||
| India | |||
| Japan | |||
| South Korea | |||
| Australia | |||
| Malaysia | |||
| Rest of Asia Pacific | |||
| Middle East and Africa | Middle East | Saudi Arabia | |
| United Arab Emirates | |||
| Turkey | |||
| Rest of Middle East | |||
| Africa | South Africa | ||
| Nigeria | |||
| Rest of Africa | |||


Key Questions Answered in the Report
What is the current value of the plastic bottles market?
The plastic bottles market size reached USD 15.3 billion in 2026.
How fast is demand for rPET bottles growing?
Recycled-content bottles benefit from brand commitments that push rPET volumes at a 4.03% compound rate through 2031.
Which region leads the consumption of plastic bottles?
Asia Pacific holds 45.92% of global volume and remains the fastest expanding geography.
Which capacity range sells the most units?
Bottles between 251-500 mL account for 43.10% of global demand due to a preference for portion control.
How are regulations shaping material choices?
Single-use plastic taxes and tethered-cap mandates in Europe and North America accelerate the adoption of lightweight and recycled PET formats.
Who are the top companies?
Amcor, ALPLA, and Graham Packaging lead in scale, technology, and global customer relationships within the plastic bottles market.
Page last updated on:


