Bond Market Size and Share
Market Overview
| Study Period | 2020 - 2031 |
|---|---|
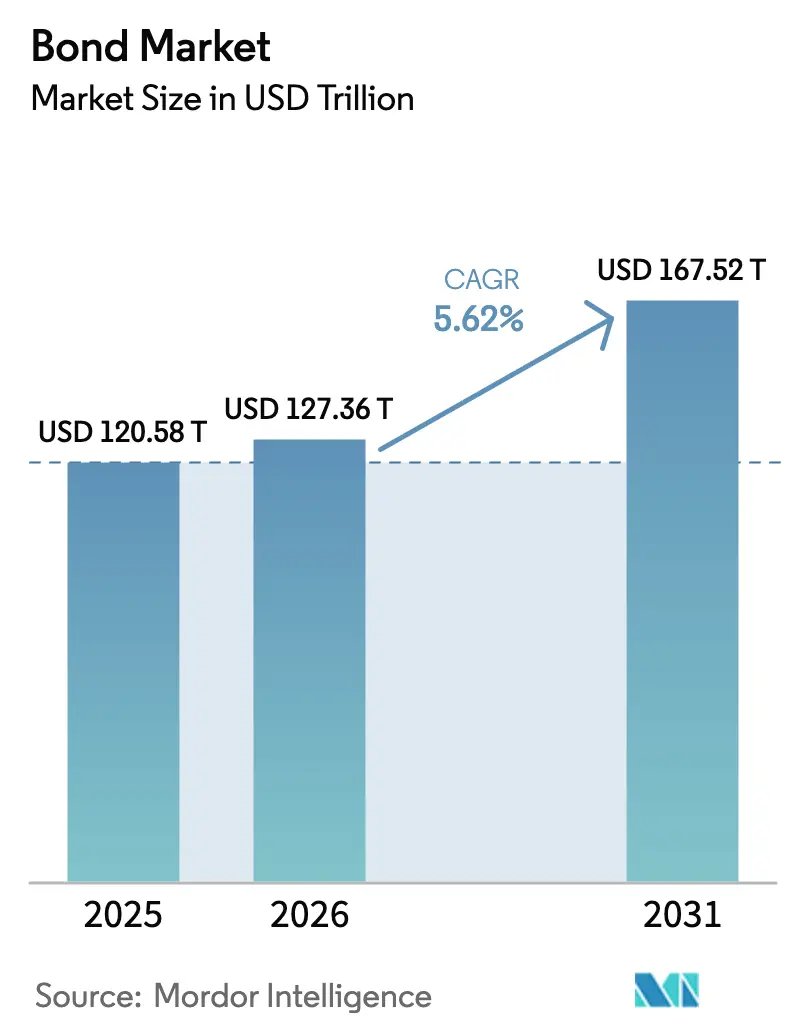
| Market Size (2026) | USD 127.36 Trillion |
| Market Size (2031) | USD 167.52 Trillion |
| Growth Rate (2026 - 2031) | 5.62% CAGR |
| Fastest Growing Market | Asia Pacific |
| Largest Market | North America |
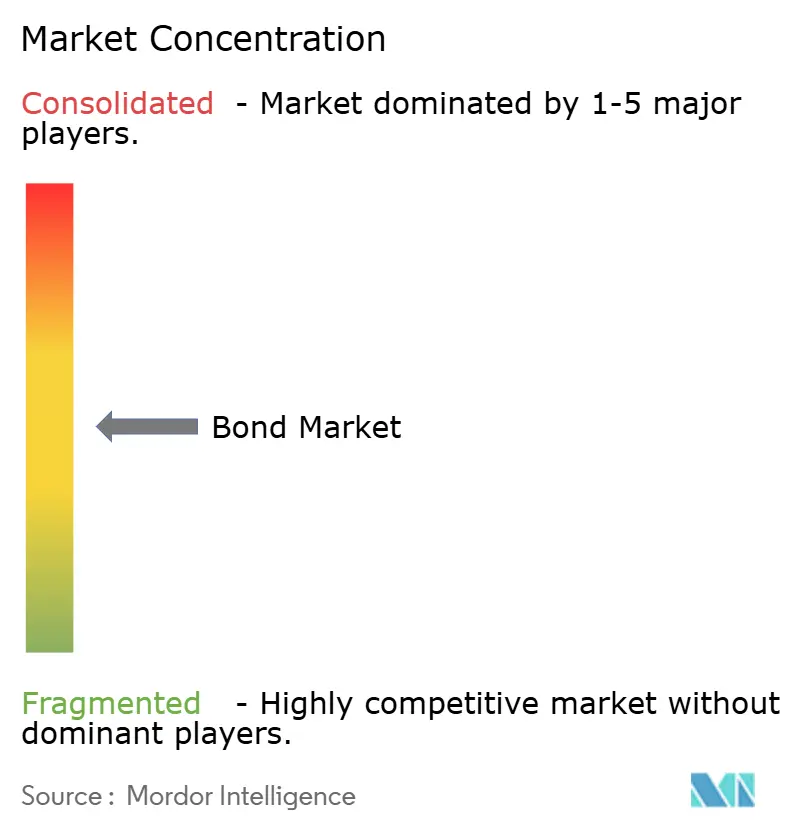
| Market Concentration | Medium |
Major Players *Disclaimer: Major Players sorted in no particular order Image © Mordor Intelligence. Reuse requires attribution under CC BY 4.0. | |
Bond Market Analysis by Mordor Intelligence
The global bond market size was valued at USD 120.58 trillion in 2025 and estimated to grow from USD 127.36 trillion in 2026 to reach USD 167.52 trillion by 2031, at a CAGR of 5.62% during the forecast period (2026-2031). The expanding global bond market is benefiting from real-time settlement pilots using central-bank digital currencies, a rising pipeline of tokenized issuance, and a synchronized monetary-easing cycle that is lowering policy rates in a number of central-bank jurisdictions. At the same time, stabilizing inflation expectations are reviving strategic fixed-income allocations, while institutional investors are rotating from short-term cash equivalents into longer-dated securities to match liabilities and lock in higher coupons. Tokenized bond pilots completed by the European Central Bank and Clearstream illustrate how distributed-ledger infrastructure can reduce post-trade frictions and manual processing costs, encouraging further innovation. High-yield issuance and private-sector funding needs are accelerating, yet sovereign instruments continue to anchor overall market liquidity as they serve as benchmark curves for pricing credit risk.
Key Report Takeaways
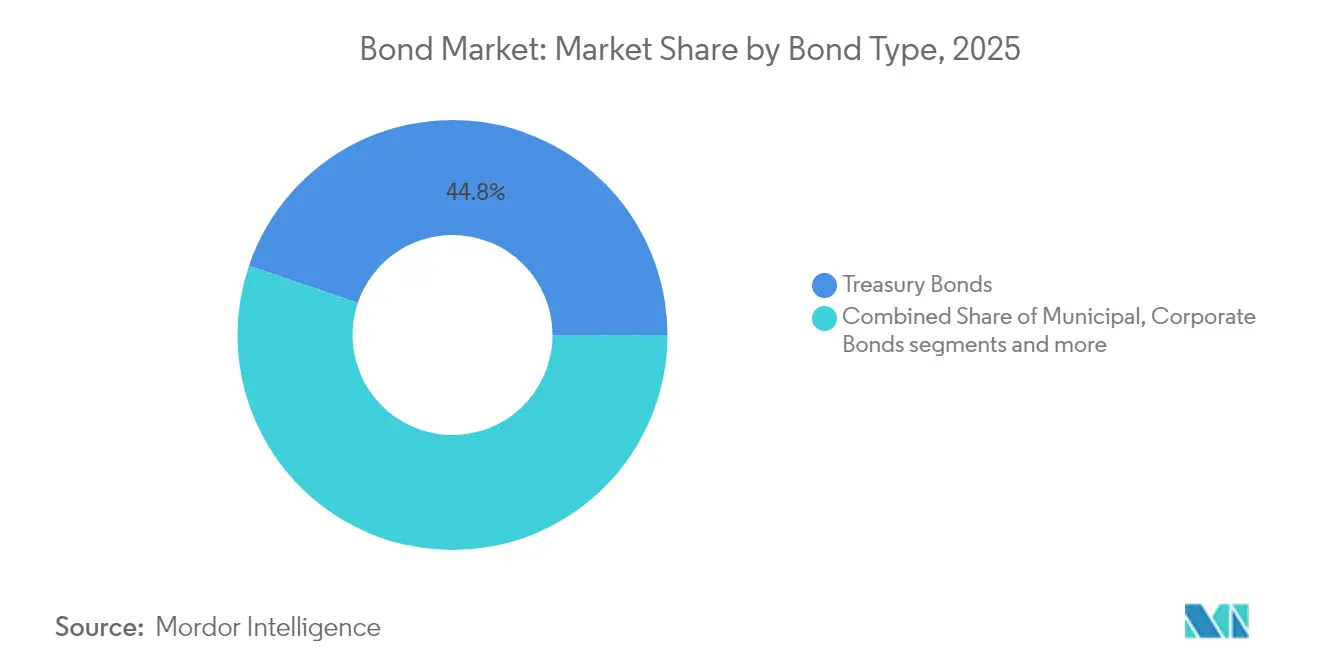
- By type, treasury bonds held 44.78% of the global bond market share in 2025, whereas high-yield bonds are advancing at an 8.12% CAGR through 2031.
- By issuer, the public sector controlled 49.62% of issuance in 2025, while private-sector issuance is projected to climb at a 7.51% CAGR to 2031.
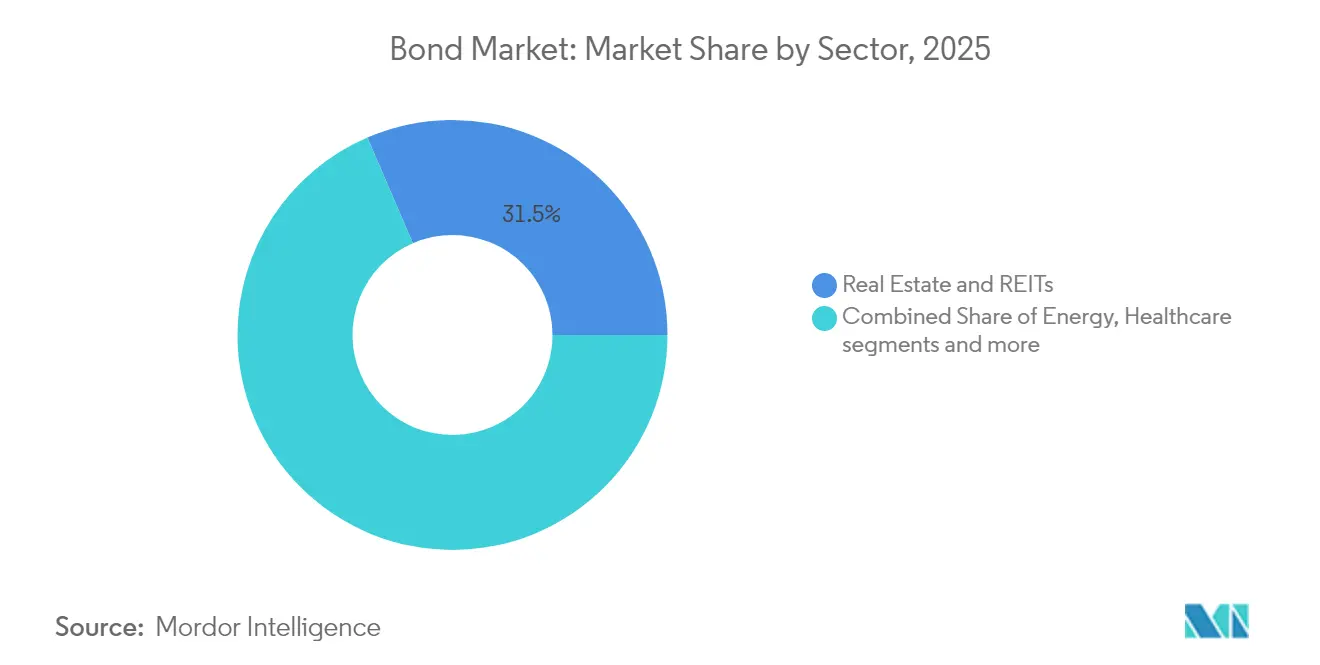
- By sector, real estate & REITs captured 31.48% revenue share in 2025; technology, media & telecom (TMT) is forecast to expand at a 6.39% CAGR through 2031.
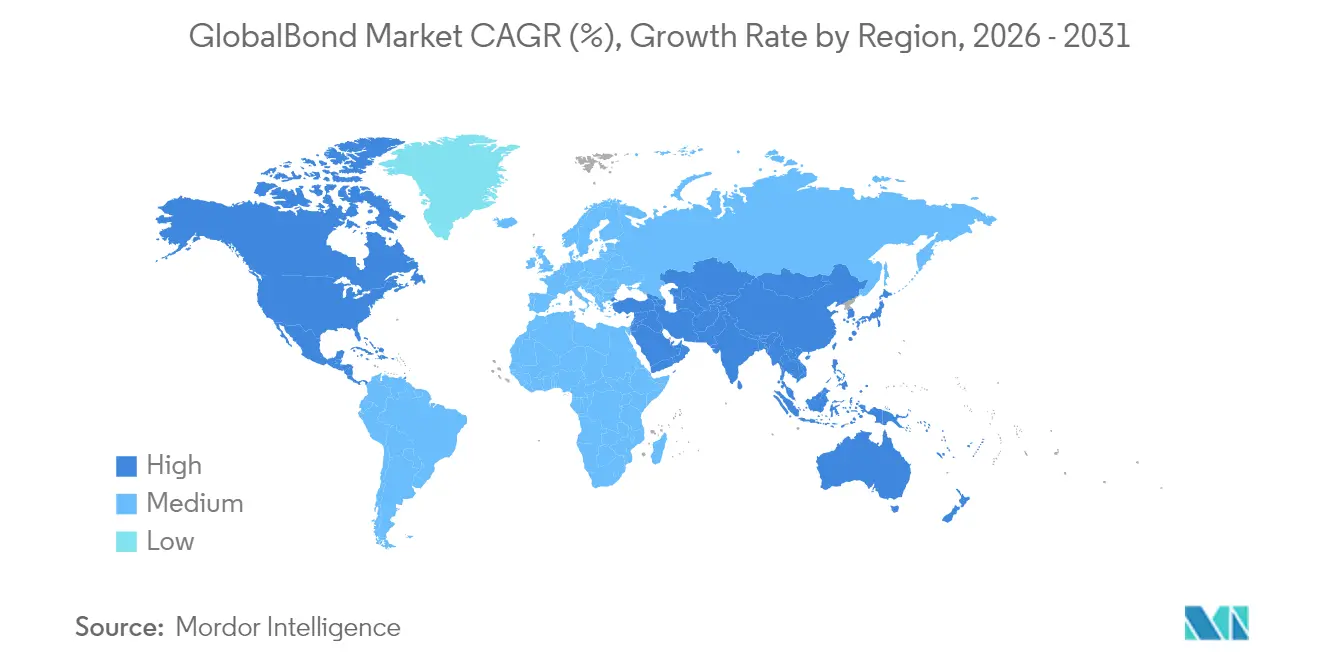
- By geography, North America commanded 39.02% of the global bond market size in 2025; Asia-Pacific is poised for the fastest regional growth at a 6.65% CAGR to 2031.
Note: Market size and forecast figures in this report are generated using Mordor Intelligence’s proprietary estimation framework, updated with the latest available data and insights as of 2026.
Global Bond Market Trends and Insights
Drivers Impact Analysis*
| Driver | ( ~ ) % Impact on CAGR Forecast | Geographic Relevance | Impact Timeline |
|---|---|---|---|
| Stabilizing global inflation expectations support fixed-income allocations | +1.2% | Global, strongest in North America & Europe | Medium term (2–4 years) |
| Institutional asset rebalancing toward liability-matching assets | +0.8% | Developed markets, especially North America & Europe | Long term (≥ 4 years) |
| Emerging-market local-currency bond inclusion in global indices | +0.6% | Asia-Pacific core; Latin-America spill-over | Medium term (2–4 years) |
| Growing adoption of ESG-labelled bonds | +0.4% | Europe leading; North America & Asia-Pacific following | Long term (≥ 4 years) |
| Tokenized bond issuance on distributed-ledger platforms | +0.3% | Europe pioneering; gradual global rollout | Long term (≥ 4 years) |
| Central-bank digital-currency pilots enabling real-time settlement | +0.2% | Asia-Pacific leading; selective developed-market trials | Long term (≥ 4 years) |
| Source: Mordor Intelligence | |||
Stabilizing global inflation expectations support fixed-income allocations
Central banks have begun a coordinated easing cycle after headline inflation retreated from pandemic highs. The Federal Reserve’s deliberate pace of rate cuts is keeping nominal yields wide enough to attract investors seeking positive real returns, while the European Central Bank has trimmed its policy rate from 4.00% to 3.25% and signalled further reductions[1]AEW, “ECB Rate-Cut Implications for Euro Bonds,” aew.com . Portfolio managers are therefore lengthening duration, replacing cash that now yields less than 4.3% with intermediate and long-dated investment-grade bonds that still offer coupon premia. A CPR Asset Management review calculates that developed-market policymakers have so far reversed just 20% of their pandemic-era hikes, implying additional room for curves to bull-flatten as easing progresses [2]CPR Asset Management, “Monetary-Easing Cycle Review,” cpr-am.com. As money-market yields descend, bonds regain their structural role in balanced portfolios, underpinning demand growth across the Global bond market.
Institutional asset rebalancing toward liability-matching assets
Pension schemes and insurers are moving decisively into longer-tenor securities to align cashflows with liabilities that extend over multiple decades. Positive real yields in core sovereign and high-grade corporate curves are restoring bonds’ income-generation appeal, reducing the need to pursue riskier alternatives. Under Solvency II, European insurers also gain capital relief by holding duration-matched assets, reinforcing predictable bid support for long bonds. J.P. Morgan strategists estimate that every 25 basis-point rise in real yields incentivises approximately USD 180 billion of incremental institutional demand. The trend is likely to persist through the forecast horizon as ageing demographics intensify the search for stable income, thereby deepening liquidity in the Global bond market.
Emerging-market local-currency bond inclusion in global indices
India’s admission to the JPMorgan Government Bond Index is expected to channel USD 100 billion of passive inflows, while enhancing secondary-market liquidity and tightening bid-ask spreads. Similar index-eligibility efforts by Indonesia and Vietnam are accelerating local market reforms, with authorities upgrading settlement infrastructure to satisfy clearing and custody standards. In April 2025, Asian local-currency bonds recorded their strongest foreign inflow in eight months, signalling durable diversification demand. As index consortiums widen coverage, more emerging issuers will gain lower funding costs, supporting overall issuance growth within the Global bond market.
Growing adoption of ESG-labelled bonds
Although 2025 primary volumes are down 15% year on year amid geopolitical uncertainty, the medium-term pipeline remains robust. Green bonds represent 58% of all sustainable issuance, backed by the European Union’s Green Bond Standard that provides taxonomy clarity. AllianceBernstein analysis suggests the ESG-labelled universe could approach USD 6 trillion by decade-end once robust impact-measurement protocols mitigate greenwashing concerns[3]Environmental Finance, “ESG-Labelled Bond Market Trends 2025,” environmental-finance.com. Emerging-market sovereigns and corporates are exploring sustainability-linked structures to finance climate-transition projects, further enlarging the Global bond market.
Restraints Impact Analysis*
| Restraint | (~) % Impact on CAGR Forecast | Geographic Relevance | Impact Timeline |
|---|---|---|---|
| Duration-extension risk from steepening yield curves | -0.9% | Global, most acute in North America | Short term (≤ 2 years) |
| Sovereign-debt sustainability concerns in frontier economies | -0.7% | Sub-Saharan Africa & Latin America | Medium term (2–4 years) |
| Higher capital-adequacy charges for banks’ trading books (Basel IV) | -0.5% | Europe & North America | Medium term (2–4 years) |
| Scarcity of long-dated hedging instruments in developing markets | -0.3% | Asia-Pacific & Latin America | Long term (≥ 4 years) |
| Source: Mordor Intelligence | |||
Duration-extension risk from steepening yield curves
The Federal Reserve’s 2023 Treasury-market episode illustrated how a re-pricing of term premiums can shock long-duration portfolios even when policy-rate expectations remain unchanged. As quantitative-tightening persists, the absence of the Fed as a large buyer amplifies supply-driven curve steepening, exposing investors to mark-to-market losses that may exceed coupon income. Commercial real-estate debt totalling USD 1.5 trillion matures by end-2025, raising default risks if refinancing costs spike. These factors could temporarily dampen appetite for the long-end and moderate near-term growth in the Global bond market.
Sovereign-debt sustainability concerns in frontier economies
Frontier sovereigns collectively carry USD 29 trillion in obligations, and elevated global real rates raise rollover risk. The sovereign-bank nexus heightens systemic pressures because domestic banks often hold a concentrated share of government paper. Recent protests in Kenya and Argentina underscore the social instability that can emerge when debt costs surge. Heightened risk premia may deter capital flows to lower-rated borrowers and weigh on the global bond market’s expansion pace. In some regions, fiscal tightening in response to debt distress could constrain public investment and social spending, deepening economic fragility. Additionally, credit rating downgrades may further elevate borrowing costs, creating a feedback loop that hinders market access and economic recovery.
*Our forecasts treat driver/restraint impacts as directional, not additive. The impact forecasts reflect baseline growth, mix effects, and variable interactions.
Segment Analysis
By Type: Treasury Bonds Anchor Stability Amid High-Yield Surge
Treasury securities comprised 44.78% of the outstanding value in 2025, making them the primary reference curve for pricing credit spreads across the Global bond market. Investors continue to use Treasuries for liquidity management, collateral, and risk-free hedging, particularly during bouts of macro uncertainty. At the other end of the spectrum, high-yield volumes increased 52.4% in the United States and 85.9% in Europe during 2024, as borrowers front-loaded refinancing ahead of an expected maturity wall. This activity lifted the high-yield segment’s 8.12% CAGR outlook. Corporate bond issuance topped USD 1 trillion in 2024, and floating-rate note demand rose sharply after the World Bank priced a USD 1.25 billion SOFR-linked bond that drew oversubscription from central-bank reserve managers. Mortgage-backed securities retained steady bid support, with Ginnie Mae printing more than USD 40 billion of gross supply in August 2024.
Momentum across these categories highlights a bifurcated landscape: safe-haven flows anchor Treasury demand while yield-seeking investors chase high-spread names. White & Case projects USD 160 billion of speculative-grade maturities over the next two years, implying sustained primary-market activity. Treasuries should nevertheless preserve their dominance because macro hedging demand remains structural. In addition, the United States faces persistent fiscal deficits that translate into regular Treasury auctions, reinforcing depth in the Global bond market. Mortgage-backed supply is likely to moderate as housing turnover slows, yet government-sponsored enterprise support keeps spreads contained. Overall, the type segmentation shows that flight-to-quality and yield-enhancement motives will coexist, underpinning aggregate growth.


By Issuer: Private-Sector Acceleration Outpaces Public Dominance
Public-sector instruments accounted for 49.62% of issuance in 2025, reflecting large sovereign funding programs and ongoing quantitative-easing reinvestments by major central banks. Governments continue to rely on domestic and international markets to finance infrastructure, healthcare and energy-transition spending. Nonetheless, the private sector’s 7.51% projected CAGR points to faster proportional growth as corporates lock in favorable long-term coupons. Goldman Sachs estimates USD 1.5 trillion of US corporate issuance in 2025, with utility operators and technology firms leading the calendar. The Federal Reserve’s pivot to rate cuts encourages issuers to term-out short-dated revolvers into multi-year notes.
Higher-quality names were able to rush USD 29 billion into the market during the opening week of 2024, signaling healthy investor appetite for spread products. European utilities and automakers are using proceeds to fund grid modernization and electric-vehicle platforms, contributing to a projected 8% uptick in investment-grade supply, according to Natixis. On the sovereign side, emerging-market funding costs have begun to ease after India’s index inclusion, but frontier names still face strained fiscal positions. Consequently, private-sector issuance will likely shoulder a larger share of incremental growth in the Global bond market, as corporates diversify funding bases and respond to capex commitments tied to digitalization and energy transition.
By Sector: Real-estate dominance challenged by TMT innovation
Real estate & REITs held 31.48% of outstandings in 2025, but rising cap rates and office-price declines of up to 50% are eroding collateral valuations. In contrast, technology, media & telecom names are growing at a 6.39% CAGR, fueled by AI data-centre financings that blur real-estate and tech categories. Utilities are seeing 18% higher issuance to fund renewable-energy commitments. Healthcare remains a defensive stalwart, while consumer-discretionary faces margin compression. TMT’s momentum indicates that digital infrastructure bonds will progressively substitute for traditional property assets in diversified portfolios. If cap-ex heavy cloud and semiconductor firms continue tapping structured-bond vehicles, the global bond market size linked to technology segments could exceed USD 3.08 trillion by decade-end, challenging real estate’s preeminence.
Geography Analysis
North America retained 39.02% of the global bond market in 2025. Deep Treasury and agency markets provide ready collateral, and the US dollar’s reserve-currency role secures cross-border liquidity. Canada supplies resource-linked credits, while Mexico’s Comisión Federal de Electricidad issued USD 1.5 billion of sustainable notes, reflecting green-bond adoption within the region. Despite potential trade-policy headwinds, the Federal Reserve’s glide path toward lower rates supports coupon capture and prospective price appreciation.
Asia-Pacific’s 6.65% CAGR to 2031 positions it as the primary growth engine. India’s full inclusion in the JPMorgan GBI-EM index is pulling USD 100 billion of fresh flows, deepening depth, and compressing bid-ask spreads. China remains resilient as foreign investors migrate from equities into onshore bonds amid relative-yield appeal. The Bank of Japan’s exit from negative rates adds incremental domestic demand for higher-yielding Japanese Government Bonds, while Australia debuted its first sovereign green bond in June 2024. IMF forecasts of 5.0% GDP growth across Emerging and Developing Asia underpin issuance expansion.
Europe faces record-high 2025 sovereign-funding calendars that risk widening spreads, but the ECB’s cumulative 75 basis-points of cuts since mid-2024 have steadied secondary-market valuations. Ten-year benchmark yields are projected to tighten toward 3.0% by 2029. Nordic and BENELUX credits benefit from high ESG adoption, while Southern European issuers rely on EU budget backstops. AllianceBernstein identifies elevated coupons as cushions against macro shocks, even as total debt funding gaps narrow to EUR 86 billion for 2025-27.
South America leverages commodity-price upswings to issue infrastructure bonds, though fiscal fragility in Argentina and Colombia constrains tenors. Middle East & Africa show bifurcation: Gulf Cooperation Council members exploit hydrocarbons cashflows to place sukuk, whereas several sub-Saharan states face sovereign-restructuring scenarios that curtail market access. Scarcity of long-dated hedging instruments continues to suppress liquidity in the region, tempering its contribution to overall global bond market growth.

Competitive Landscape
The global bond market remains moderately fragmented, yet market-making is concentrating around electronic dealers such as Citadel Securities and Jane Street. Basel IV capital charges on trading books raise balance-sheet costs for traditional banks, encouraging a shift toward algorithmic platforms that can warehouse risk with lower leverage. Tokenization is emerging as a strategic differentiator: the ECB pilot exhibited real-time settlement and balance-sheet compression, and McKinsey estimates tokenized bonds could exceed USD 1 trillion in outstandings by 2030.
Sovereign issuers are exploring blockchain rails to diversify investor bases and cut post-trade costs; KfW’s USD 4.32 billion digital bond illustrated scale feasibility. Corporations are adopting sustainability-linked structures, with utilities leading as they finance energy-transition capital expenditure. White-space opportunities also exist in AI data-center securitizations, where credit structures bridge technology and real-estate funding gaps.
Regulatory arbitrage is intensifying: European banks are trimming bond inventories to free capital, while U.S. primary dealers benefit from the Supplemental Liquidity Ratio exemption on Treasuries. Non-bank financial institutions continue capturing secondary-market share, although clearinghouse membership rules may shape liquidity resilience.
Bond Industry Leaders
Microsoft Corporation
AT&T Inc.
Verizon Communications
United States Treasury (sovereign)
Government of Japan
- *Disclaimer: Major Players sorted in no particular order

Recent Industry Developments
- June 2025: ECB and Clearstream settled EUR 5 million of tokenized bonds against real central-bank money, marking Germany’s first institutional-grade distributed-ledger settlement.
- February 2025: India completed full inclusion in the JPMorgan GBI-EM index, triggering passive inflows and setting a template for other emerging-market reforms.
- December 2024: World Bank issued USD 1.25 billion SOFR-linked floating-rate sustainable-development bond, oversubscribed by reserve managers.
- November 2024: Ginnie Mae posted USD 40 billion of mortgage-backed securities issuance in August 2024, topping Fannie Mae and Freddie Mac volumes.


Global Bond Market Report Scope
A bond is an official document issued by a government or corporation, indicating that you have lent them money, which they promise to repay with interest at a specified rate. This report provides a comprehensive analysis of the bond market. It explores market dynamics, underscores emerging trends across various segments and regions, and offers insights into various product and application types. Furthermore, the report examines key players and the competitive landscape. The bond market is segmented by type including treasury bonds, municipal bonds, corporate bonds, high-yield bonds, mortgage-backed securities, and others such as floating rate bonds, zero-coupon bonds, callable bonds; by issuers including public sector issuers and private sector issuers; by sectors including government-backed entities, financial corporations, non-financial corporations, others such as development banks, and local government; and by geography including North America, South America, Europe, Asia-Pacific, and Middle-East & Africa. The report offers market size and forecasts for the bond market in value (USD) for all the above segments.
| Treasury Bonds |
| Municipal Bonds |
| Corporate Bonds |
| High-Yield Bonds |
| Mortgage-Backed Securities |
| Others (Floating Rate Bonds, Zero-Coupon Bonds, Callable Bonds) |
| Public Sector |
| Private Sector |
| Energy & Utilities |
| Technology, Media & Telecom |
| Healthcare & Pharmaceuticals |
| Consumer (Staples & Discretionary) |
| Industrials |
| Real Estate & REITs |
| Others |
| North America | United States |
| Canada | |
| Mexico | |
| South America | Brazil |
| Peru | |
| Chile | |
| Argentina | |
| Rest of South America | |
| Europe | Germany |
| United Kingdom | |
| France | |
| Italy | |
| Spain | |
| BENELUX (Belgium, Netherlands, and Luxembourg) | |
| Nordics (Sweden, Norway, Denmark, Finland) | |
| Rest of Europe | |
| Asia-Pacific | China |
| India | |
| Japan | |
| South Korea | |
| Australia | |
| South East Asia | |
| Indonesia | |
| Rest of Asia-Pacific | |
| Middle East and Africa | United Arab Emirates |
| Saudi Arabia | |
| South Africa | |
| Nigeria | |
| Rest of Middle East and Africa |
| By Type | Treasury Bonds | |
| Municipal Bonds | ||
| Corporate Bonds | ||
| High-Yield Bonds | ||
| Mortgage-Backed Securities | ||
| Others (Floating Rate Bonds, Zero-Coupon Bonds, Callable Bonds) | ||
| By Issuer | Public Sector | |
| Private Sector | ||
| By Sector | Energy & Utilities | |
| Technology, Media & Telecom | ||
| Healthcare & Pharmaceuticals | ||
| Consumer (Staples & Discretionary) | ||
| Industrials | ||
| Real Estate & REITs | ||
| Others | ||
| By Geography | North America | United States |
| Canada | ||
| Mexico | ||
| South America | Brazil | |
| Peru | ||
| Chile | ||
| Argentina | ||
| Rest of South America | ||
| Europe | Germany | |
| United Kingdom | ||
| France | ||
| Italy | ||
| Spain | ||
| BENELUX (Belgium, Netherlands, and Luxembourg) | ||
| Nordics (Sweden, Norway, Denmark, Finland) | ||
| Rest of Europe | ||
| Asia-Pacific | China | |
| India | ||
| Japan | ||
| South Korea | ||
| Australia | ||
| South East Asia | ||
| Indonesia | ||
| Rest of Asia-Pacific | ||
| Middle East and Africa | United Arab Emirates | |
| Saudi Arabia | ||
| South Africa | ||
| Nigeria | ||
| Rest of Middle East and Africa | ||


Key Questions Answered in the Report
What is the current size of the global bond market?
The global bond market is valued at USD 127.36 trillion in 2026 and is forecast to expand to USD 167.52 trillion by 2031.
Why are high-yield bonds growing faster than Treasuries?
Corporate refinancing needs and investor appetite for yield premiums in a falling-rate environment are pushing high-yield volumes, resulting in an 8.12% CAGR, versus steady but slower Treasury growth.
How will tokenization affect bond-market operations?
Tokenized issuance shortens settlement cycles to near real-time, reduces operational risk, and frees dealer capital, with ECB pilots proving feasibility and McKinsey projecting USD 1 trillion of tokenized bonds by 2030.
Which region is expected to deliver the fastest bond-market growth?
Asia-Pacific, supported by India’s index inclusion and China’s continued expansion, is projected to grow at a 6.65% CAGR through 2031.
Page last updated on:


