Market Overview
| Study Period | 2020 - 2031 |
|---|---|
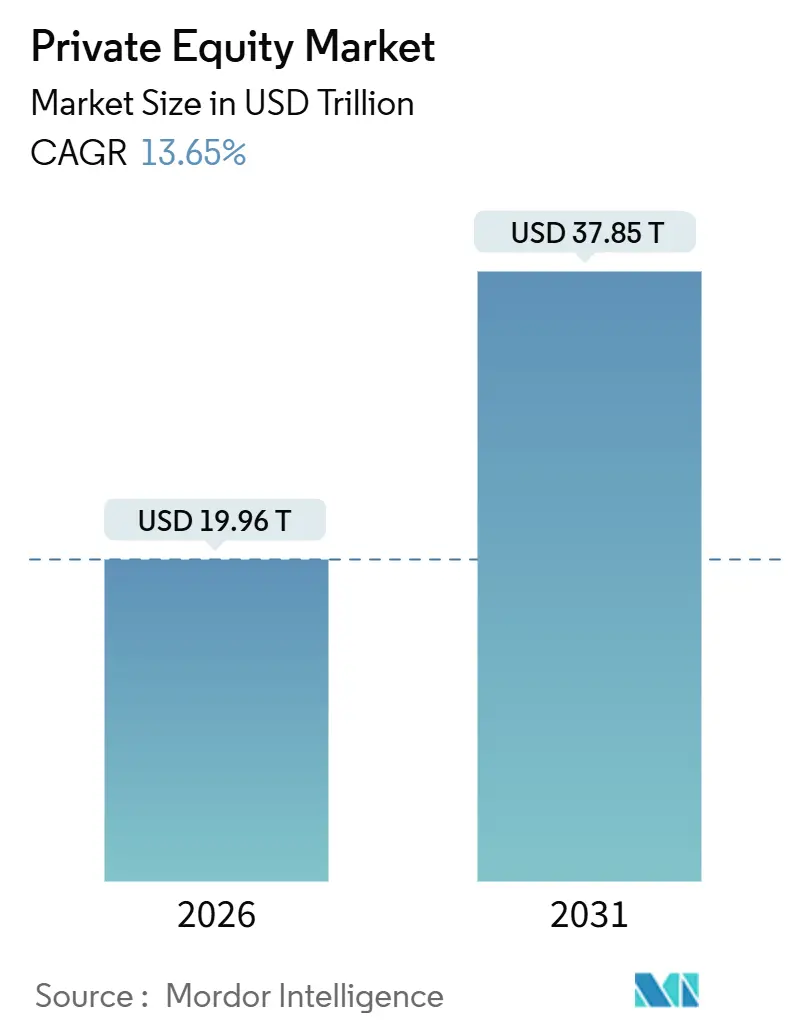
| Market Size (2026) | USD 19.96 Trillion |
| Market Size (2031) | USD 37.85 Trillion |
| Growth Rate (2026 - 2031) | 13.65% CAGR |
| Fastest Growing Market | Asia Pacific |
| Largest Market | North America |
| Market Concentration | Medium |
Major Players *Disclaimer: Major Players sorted in no particular order Image © Mordor Intelligence. Reuse requires attribution under CC BY 4.0. | |
Private Equity Market Analysis by Mordor Intelligence
The Private Equity Market size is estimated at USD 19.96 trillion in 2026, and is expected to reach USD 37.85 trillion by 2031, at a CAGR of 13.65% during the forecast period (2026-2031).
Growth is driven by USD 1.2 trillion in dry powder for buyouts as of mid-2025, alternative liquidity solutions, and increased deployment in high-conviction sectors. After valuation compression and exit bottlenecks in 2022-2023, 2025 saw global deal value reach USD 1.5 trillion in the first three quarters, with full-year projections of USD 1.4-2.0 trillion. Median buyout entry multiples stabilized at 11.9x EV/EBITDA in 2024, reflecting competition for quality assets despite tighter financing conditions.
The secondaries market recorded USD 103 billion in transaction volumes in H1 2025, a 51% year-over-year increase, with full-year projections exceeding USD 210 billion. GP-led continuation vehicles accounted for 87% of GP-led volume and 16-19% of sponsor-backed exits in H1 2025. Distributions to LPs exceeded capital calls in H1 2024, but median DPI ratios for 2018-vintage funds remained at 0.6x versus the 0.8x norm. Retail investor access expanded through semi-liquid structures and evergreen funds, with aggregate NAV surpassing USD 400-427 billion in 2025, doubling from late-2023 levels, and private wealth contributing 18-22% of secondaries fundraising.
Key Report Takeaways
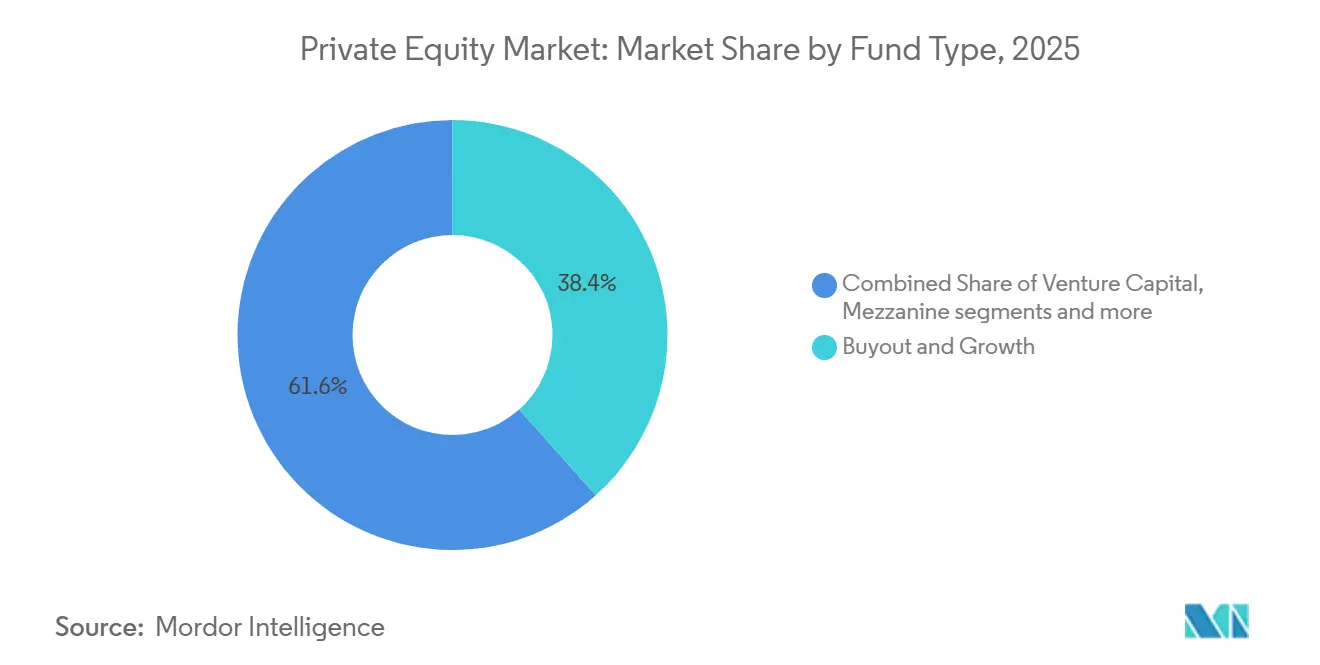
- By fund type, buyout strategies held a 38.39% share in 2025, while in the private equity market, secondaries & fund‑of‑funds are expected to grow at the fastest 8.84% CAGR through 2031.
- By sector, technology captured the largest 32.87% share in 2025, whereas in the private equity market, energy & power is projected to advance at a strong 11.38% CAGR through 2031.
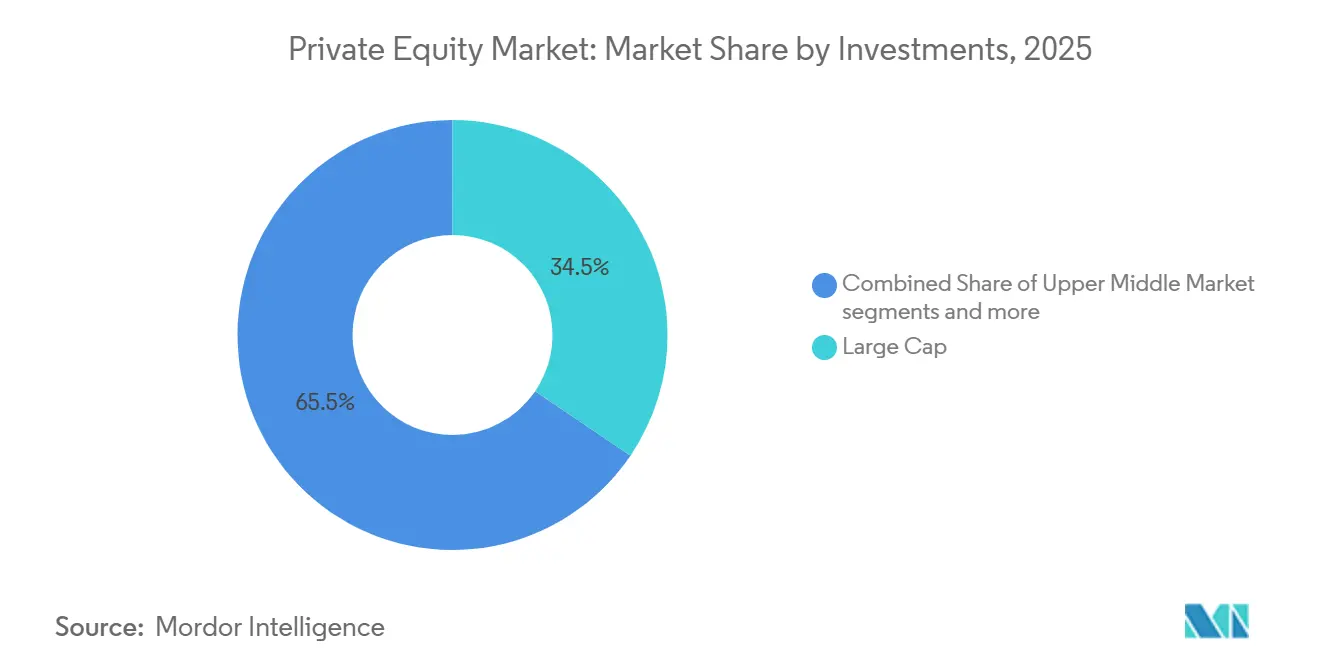
- By investment size, large‑cap transactions commanded a 34.49% share in 2025, and within the private equity market, the lower middle market is forecast to expand at the fastest 9.39% CAGR through 2031.
- By geography, North America led with a 51.87% share in 2025, while in the private equity market, Asia‑Pacific is anticipated to record the highest growth at a 7.48% CAGR through 2031.
Note: Market size and forecast figures in this report are generated using Mordor Intelligence’s proprietary estimation framework, updated with the latest available data and insights as of January 2026.
Global Private Equity Market Trends and Insights
Drivers Impact Analysis*
| Driver | (~) % Impact on CAGR Forecast | Geographic Relevance | Impact Timeline |
|---|---|---|---|
| Record dry-powder balances seeking deployment | +2.8% | Global, concentrated in North America & EU | Medium term (2-4 years) |
| Rising allocations to alternatives by pension & sovereign investors | +2.3% | Global, led by North America, increasing in APAC | Long term (≥ 4 years) |
| Digital transformation demand for operational value-creation expertise | +2.1% | Global core, spillover to MEA and Latin America | Medium term (2-4 years) |
| Liquidity unlocked through continuation & secondary funds | +1.8% | Global, with North America & Europe leading adoption | Short term (≤ 2 years) |
| Retail-investor access via semi-liquid / 401(k) structures | +1.5% | National (US-centric), with regulatory pilots in EU/UK | Long term (≥ 4 years) |
| Tokenisation of fund units enabling fractional ownership | +0.9% | National pilots (US, Singapore, EU), early-stage global spillover | Long term (≥ 4 years) |
| Source: Mordor Intelligence | |||
Record Dry-Powder Balances Seeking Deployment
Dry powder at buyout funds reached USD 1.2 trillion by mid-2025, which increases the pressure to deploy capital across the private equity market and supports deal activity as rates ease. In the United States, dry powder moved to USD 880 billion in September 2025, down from a December 2024 peak, which signals that deployment is picking up alongside improved market access. Dedicated secondaries dry powder reached USD 302 to USD 315 billion in Q3 2025, and when including alternative capital, the overhang multiple surpassed 2.0x, which supports GP-led pricing power and volume[1]Jefferies Secondary Team, “H1 2025 Global Secondary Market Review,” Jefferies, jefferies.com. Allocators are underweight private markets relative to targets and are gradually lifting private equity allocations, while the ratio of capital sought to funds closed moved to 3.1x in 2025. Sovereign wealth funds and pensions are joining large consortium deals to scale commitments, exemplified by the USD 55 billion Electronic Arts take-private. Rate cuts totaling 75 basis points through year-end 2025 lowered acquisition financing costs, which removed a visible hurdle to deployment and supported renewed momentum in the private equity market.
Rising Allocations to Alternatives by Pension & Sovereign Investors
Pension funds and sovereign wealth funds moved to increase or maintain private equity exposure in 2025 to enhance returns and diversify, which supports long-duration capital formation in the private equity market. The United Kingdom Mansion House Accord encouraged defined-contribution plans to allocate 5% to 10% to domestic private markets by 2030, which introduces policy support for incremental flows. Asian institutions also increased infrastructure allocations, with a majority of LPs in a 2025 survey indicating higher exposure to infrastructure continuation funds. Sovereign wealth funds from the Middle East participated in large-scale transactions and focused on AI, data centers, chips, and sports assets to pursue strategic diversification. Private wealth is growing in relevance, with an evergreen NAV above USD 400 billion in 2025 and private wealth accounting for 18% to 22% of secondaries fundraising. The broader environment remains supportive due to the need for return enhancement in a normalized rate regime, with the infrastructure’s recent return profile reinforcing diversification merits for large allocators[2]CBRE IM Research, “Infrastructure Quarterly: Q4 2025,” CBRE Investment Management, cbreim.com.
Digital Transformation Demand for Operational Value-Creation Expertise
As multiple expansion waned, managers shifted decisively to operating value creation, technology enablement, and AI adoption to drive EBITDA growth across the private equity market. Portfolio companies reported rapid adoption of AI tools in 2025, and executives increased AI-related software budgets to improve productivity and revenue capture[3]Blackstone CIO Office, “2026 Investment Perspectives,” Blackstone, blackstone.com. Mid-market PE funds also reported broad AI initiatives across portfolio holdings, indicating that digital capability has become a core differentiator in the private equity market. Operating improvements carry a measurable equity value premium at exit, which is motivating firms to invest in operating partners and specialized sector teams. The focus extends to healthcare IT, analytics, and workforce optimization, where deal value doubled in 2025 and where digital leverage correlates with competitive positioning. Longer holding periods also reinforce the need for continuous improvement that compounds value creation under more conservative leverage levels.
Liquidity Unlocked through Continuation & Secondary Funds
Continuation vehicles and GP-led secondaries delivered the fastest-growing liquidity channel in 2025, which supported distributions and reduced exit congestion across the private equity market. GP-led volume reached USD 47 billion in H1 2025 and is on track to exceed USD 100 billion for the year, with single-asset and multi-asset structures repricing assets that remain high-conviction holdings. Pricing trended above 90% of NAV for the majority of single-asset CVs, while LP-led portfolios also tightened discounts, which raised confidence for sellers. Dedicated secondaries dry powder reached USD 302 to USD 315 billion in Q3 2025, while traditional LPs and retail vehicles added incremental capacity, which increased the absorption of GP-led supply. Adoption broadened across regions, with more than half of APAC managers and about half of North American managers planning to increase GP-led activity in the next two years. Large managers forecast structural growth in secondaries volume toward USD 400 billion by 2030 as these tools become a standard part of the private equity market playbook.
Restraints Impact Analysis*
| Restraint | (~) % Impact on CAGR Forecast | Geographic Relevance | Impact Timeline |
|---|---|---|---|
| Higher interest-rate driven financing costs | -1.8% | Global, most acute in North America & EU | Short term (≤ 2 years) |
| Bid-ask valuation gaps suppressing exits | -1.4% | Global core, spillover to all regions | Short term (≤ 2 years) |
| Stricter ESG & impact-reporting compliance burdens | -1.2% | Europe-led, expanding to North America & APAC institutional LPs | Medium term (2-4 years) |
| AIFMD II & equivalent data-transparency mandates | -1.0% | EU core, regulatory convergence anticipated in UK, APAC | Medium term (2-4 years) |
| Source: Mordor Intelligence | |||
Higher Interest-Rate Driven Financing Costs
Elevated borrowing costs through 2024 reduced leverage, narrowed debt service cushions, and compressed return potential for leveraged buyouts in the private equity market[4]NEPC Research Team, “Quarterly Private Markets Report: Q3 2025,” NEPC, nepc.com. Rates started to ease in late 2025, yet they remain above the 2010 to 2021 baseline, which sustains a higher hurdle for leveraged strategies relative to the last cycle. Interest coverage ratios for private credit borrowers fell from 3.2x in 2021 to near 1.5x in H1 2025, while a larger share of borrowers now sits at or below 1.5x, which is causing tighter lending structures and more conservative underwriting. The use of payment-in-kind features rose and surfaced in senior direct loans, which signals borrower stress and supports opportunistic and distressed strategies. Large-cap sponsors found relief in the syndicated loan market, where volumes jumped to a record USD 404 billion in Q3 2025, while smaller sponsors remained more dependent on direct lenders. Normalization is expected as easing continues, but the private equity market is recalibrated to a higher-for-longer rate regime that emphasizes operating value creation over pure financial engineering.
Bid-Ask Valuation Gaps Suppressing Exits
Exit activity improved in 2025, yet valuation disconnects persisted for 2021 to 2022 vintages, which slowed full realizations and dampened distributions in parts of the private equity market. Exit markups narrowed over the last three years, while many sales cleared near carrying values, which reduced the role of multiple expansion at exit. Limited partners favored full exits to continuation or dividend recapitalizations in several polls, and managers adjusted with more structured earnouts, seller notes, and contingent value rights to bridge pricing gaps. Backlog remains high with tens of thousands of portfolio companies queued for monetization, a third of which are held beyond six years, which supports the continued use of GP-led tools in 2026. As syndicated markets stabilized and rates steadied, valuation gaps began to narrow during 2025, which opened windows for IPOs and strategic sales. Exit value reached USD 832 billion by Q3 2025 with a public listing value of USD 198.7 billion, which was the strongest since 2020.
*Our forecasts treat driver/restraint impacts as directional, not additive. The impact forecasts reflect baseline growth, mix effects, and variable interactions.
Segment Analysis
By Fund Type: Secondaries Emerge as Liquidity Catalyst Amid Exit Bottlenecks
Buyout strategies held a 38.39% share in 2025 as mega-LBOs and middle market activity rebounded, while the private equity market refocused on pricing discipline and tighter leverage levels. Median buyout entry multiples stabilized at 11.9x EV/EBITDA in 2024, which remained above pre-pandemic norms and reflected competition for high-quality platforms. Syndicated loan markets reopened to support large deals and public-to-private transactions, and direct lenders remained active, which together diversified financing sources across the private equity market. Fundraising trends favored managers with operating expertise, sector depth, and measured fund growth as LPs prioritized teams with consistent distribution profiles. The buyout playbook broadened into real assets, hybrid capital, and structured solutions to maintain deployment pace under normalized rates.
Secondaries and fund-of-funds represent the fastest-growing fund type at an 8.84% CAGR through 2031 as the asset class balances capital deployment with liquidity creation across the private equity industry. H1 2025 secondaries volume of USD 103 billion rose 51% year-over-year, and full-year projections exceeded USD 210 billion as GP-led transactions neared half of overall secondaries activity. Pricing tightened with most single-asset continuation vehicles clearing above 90% of NAV, while LP-led portfolios reached 94% of NAV on average, which reflected strong buyer demand. Dedicated dry powder continued to climb and was supplemented by traditional LPs and retail vehicles, which supported absorption of GP-led supply and portfolio rebalancing. Venture and growth equity exposure increased within LP-led secondaries as AI-driven exits improved liquidity conditions at the late stage.


By Sector: AI Infrastructure Propels Technology Leadership While Energy Surges
Technology captured 32.87% of sector activity in 2025, underpinned by USD 469 billion in global TMT PE investment and elevated valuations for high-quality software and AI assets across the private equity market. AI and machine learning funding of USD 160.8 to USD 193 billion through Q3 2025 accounted for a majority of venture deal value, which showed the scale of capital concentrating in AI relative to other growth themes. Hyperscalers increased 2026 capex plans after spending an estimated USD 415 billion in 2025, directing most of it to AI infrastructure spanning data centers, chips, power systems, and connectivity. Private equity invested heavily across the IT value chain since 2020, including data centers and semiconductors that enable AI workloads, to meet relentless compute and power demand. Software deal multiples eased from 2024 but stayed above pre-pandemic levels for high-growth, AI-enabled platforms, supported by persistent competition for mission-critical assets.
Energy and power is the fastest-growing sector at an 11.38% CAGR through 2031, driven by electrification, grid expansion, and AI-related power demands that are reshaping the private equity market. Global power investment approached USD 3.3 trillion in 2025, with most allocated to renewables, storage, and grid optimization, while battery energy storage spending expanded on cost declines and supportive procurement. Grid capital reached record levels in 2024, yet interconnection queues and materials inflation continue to challenge project timelines and raise the value of scale players. Data center electricity demand is projected to at least double by 2030, while leading cloud providers account for most clean energy contracting for these assets. Infrastructure fundraising accelerated in 2025 and skewed to renewables and data centers, which reflects investor conviction in real-asset platforms linked to AI workloads and grid modernization.
By Investments: Mega-Transactions Dominate Value While Lower Middle Market Offers Resilience
Large-cap deals over USD 1 billion held a 34.49% share in 2025 as public-to-privates returned and sponsor-to-sponsor sales scaled under improved financing access in the private equity market. Syndicated loan issuance hit a quarterly record in Q3 2025, and direct lenders contributed meaningful capacity, which together funded larger LBOs at conservative leverage. The USD 55 billion Electronic Arts take-private by a sponsor and sovereign consortium set a new high-water mark for LBOs and highlighted the role of co-investors in financing mega deals. Large platforms used structured financing and hybrid capital more actively to secure scale assets across technology and healthcare during 2025. Upper middle market valuation multiples expanded where assets had durable revenue, recurring models, or consolidation runways that justified premium pricing.
The lower middle market is the fastest-growing deal-size segment at a 9.39% CAGR through 2031, supported by entry multiples near 7.7x EV/EBITDA, lower leverage, and greater operational agility across the private equity industry. Service-oriented revenue models reduced exposure to trade and capital-market cycles, which helped sustain deal flow even when public markets were volatile. Financing costs weighed on smaller buyers in early 2025 and slowed closings, yet activity improved by late 2025 as rate expectations stabilized and lenders adjusted structures. Valuations rose for larger EBITDA brackets within the mid-market, which reinforced the premium for scale and resilience in the private equity market. Strategics remained active competitors with lower sensitivity to rates and greater collaboration capture, which influenced auction dynamics and outcome valuations.
Geography Analysis
North America held a 51.87% market share in 2025, supported by USD 880 billion in dry powder (as of September 2025, down from USD 1.3 trillion in December 2024). US PE deal value rose 8% year-over-year in H1 2025 to over USD 195 billion, while global buyout activity reached USD 911-1,500 billion, with North American sponsors driving mega-transactions. Broadly syndicated loan markets processed USD 404 billion in Q3 2025, and global leveraged finance issuance hit USD 1.3 trillion, up 45% year-over-year. TMT attracted USD 285.9 billion in PE investment through Q3 2025, healthcare reached USD 73.5 billion, and infrastructure/energy investments totaled USD 65.1 billion. Canada recorded 646 PE deals worth CAD 57 billion (USD 41.63 billion) in 2024, with 2025 activity at 488 deals for CAD 46 billion (USD 33.59 billion) by November.
Asia-Pacific is the fastest-growing region at a 7.48% CAGR through 2031, led by India’s 73% year-over-year deal value surge and Japan’s 155% increase. YTD Q3 2025 investment activity totaled USD 75 billion, with India and Japan contributing 60%. India’s growth is driven by SaaS platforms, healthcare, life sciences, and a favorable IPO market. Institutional allocations to infrastructure rose from 1.3% in 2020 to 2.2% by 2024. China’s sovereign fund seeks secondary buyers for USD 1 billion in PE investments, while South Korea and Middle Eastern funds expand regional investments. Exit activity reached USD 54 billion YTD Q3 2025, with India and Japan accounting for 60% of realized value.
Europe’s PE deal value reached €177 billion (USD 208.20 billion) in Q3 2025, a 25% rise over Q2, with megadeals exceeding €1 billion (USD 1.18 billion) accounting for 32% of total value. Public-to-private deal value rose 65% in 2024, with notable 2025 examples including Darktrace and Hargreaves Lansdown. Healthcare activity doubled to USD 59 billion, and the Verisure IPO raised €3.2 billion, the largest PE-backed IPO in European history. Regulatory changes, including AIFMD II and ELTIF 2.0, aim to enhance cross-border investments, while the UK’s Mansion House Accord targets 5-10% pension allocations to private markets by 2030.
South America and the Middle East & Africa show selective growth. Latin America has 39 unicorns and over 60 tech companies poised for liquidity events. Brazil leads in stablecoin adoption, while Nigeria’s fintech ecosystem matures with notable acquisitions. The Middle East attracts infrastructure and energy transition capital, with sovereign wealth funds co-investing globally and domestically.


Competitive Landscape
The private equity market is fragmented at the global level, yet competition intensified among scale managers as limited partners became more selective and capital remained concentrated in proven platforms. Large managers acquired peers more frequently in the last five years than in the prior period, which signaled consolidation around platforms with durable fundraising and operating capabilities. Performance persistence increased for top managers compared with prior vintages, while the gap between top and bottom quartiles widened, which elevated the premium on manager selection. Strategic buyers also competed actively for assets as they deployed balance sheets to pursue collaboration and longer integration horizons than most sponsors.
Operating value creation outperformed financial engineering as the primary source of returns, which increased emphasis on revenue acceleration, pricing, and AI-enabled productivity across the private equity market. Managers invested in operating partners and specialized talent for AI integration, pricing optimization, supply chain resilience, and data analytics to widen the operating delta at exit. Portfolio companies expanded AI use cases in 2025, and executives increased software budgets for AI compared with non-AI categories, which showed how digital adoption is now a baseline expectation for value creation. The private equity market saw active deployment across AI infrastructure and healthcare technology, where digital adoption maps to durable end demand and supports large-ticket deployment.
White-space opportunities included under-owned industrial assets, real-asset adjacencies to digital buildouts, and lower middle market platforms with disciplined operating plans and multiple exit pathways. Infrastructure tied to AI workloads, renewable power, and grids presented multi-year deployment potential, with the largest managers raising dedicated capital to scale into these areas. Continuation vehicles matured into a core toolkit for liquidity and for extending ownership of high-conviction assets as managers optimized the hold period to realize operating plans. The private equity market also drew incremental retail capital through evergreen structures, which added a more stable and countercyclical investor base alongside traditional institutions.
Private Equity Industry Leaders
Bain Capital
BC Partners
Blackstone
Brookfield Asset Management
Carlyle Group
- *Disclaimer: Major Players sorted in no particular order

Recent Industry Developments
- December 2025: Blackstone and TPG completed their USD 18.3 billion take-private acquisition of Hologic, a leading women's health medical technology company, representing approximately 9% of total global healthcare private equity deal value for 2025 and underscoring sustained investor appetite for scaled medtech platforms with defensible market positions.
- November 2025: Montagu raised a EUR 2 billion (USD 2.35 billion) continuation vehicle for Wireless Logic, the leading global managed connectivity provider, demonstrating the continued viability of large-scale GP-led secondaries as a liquidity mechanism for extending ownership of star assets while offering LPs optionality.
- October 2025: A consortium led by BlackRock, with participation from Nvidia and Microsoft, acquired Aligned Data Centers for approximately USD 40 billion (with potential to exceed USD 100 billion including debt), marking the largest data center transaction in history and signaling the strategic imperative of securing power and compute infrastructure to support AI workloads.


Research Methodology Framework and Report Scope
Market Definitions and Key Coverage
Our study defines the global private equity market as the aggregate assets under management, committed capital, and dry powder available to funds that acquire or provide growth capital to companies outside public exchanges; it covers buyout, growth, venture, secondaries, and fund-of-fund vehicles across all regions, currencies, and sectors.
Scope exclusions: The sizing purposefully leaves out private credit, real estate funds, infrastructure vehicles, and hedge fund strategies that do not seek controlling equity stakes.
Segmentation Overview
- By Fund Type
- Buyout & Growth
- Venture Capital
- Mezzanine & Distressed
- Secondaries & Fund of Funds
- By Sector
- Technology (Software)
- Healthcare
- Real Estate and Services
- Financial Services
- Industrials
- Consumer & Retail
- Energy & Power
- Media & Entertainment
- Telecom
- Others (Transportation, etc.)
- By Investments
- Large Cap
- Upper Middle Market
- Lower Middle Market
- Small & SMID
- By Geography
- North America
- Canada
- United States
- Mexico
- South America
- Brazil
- Argentina
- Rest of South America
- Asia-Pacific
- India
- China
- Japan
- Australia
- South Korea
- South East Asia (Singapore, Malaysia, Thailand, Indonesia, Vietnam, and Philippines)
- Rest of Asia-Pacific
- Europe
- United Kingdom
- Germany
- France
- Spain
- Italy
- BENELUX (Belgium, Netherlands, and Luxembourg)
- NORDICS (Denmark, Finland, Iceland, Norway, and Sweden)
- Rest of Europe
- Middle East And Africa
- United Arab of Emirates
- Saudi Arabia
- South Africa
- Nigeria
- Rest of Middle East And Africa
- North America
Detailed Research Methodology and Data Validation
Primary Research
To ground findings, our team conducts structured interviews and web surveys with general partners, limited partners, placement agents, and sector lawyers spanning North America, Europe, Asia-Pacific, and the GCC. Discussions clarify hidden capital movements, regional dry powder deployment plans, and expected internal rate hurdles, ensuring model inputs mirror on-the-ground sentiment.
Desk Research
Mordor analysts begin with macro-level evidence drawn from tier-one sources such as UNCTAD's World Investment Report, OECD Corporate Finance datasets, World Bank global investment flows, and regulatory filings from the US SEC and ESMA. We enrich these with industry-specific insights from Preqin public dashboards, S&P Global Market Intelligence, and IMF Financial Stability Reviews that track fundraising, exit values, and NAV uplifts. Paid intelligence from D&B Hoovers helps us verify individual manager AUM disclosures and fee structures. Major newspapers, association portals, and audited 10-K statements round out the context. This roster is illustrative; many additional outlets inform our desk work.
Market-Sizing & Forecasting
A top-down model anchors on reported global AUM and uncalled commitments, converted to constant-dollar terms, before being sense checked through sampled fund roll-ups and deal-value channel checks. Key variables include annual commitments, dry powder utilization rates, exit-to-NAV ratios, 10-year sovereign yields, global GDP growth, and MSCI ACWI valuation multiples, each forecast via multivariate regression and ARIMA techniques. Where bottom-up samples under-represent emerging managers, adjustment factors are applied using median ticket sizes gathered during primary outreach.
Data Validation & Update Cycle
Intermediate outputs pass three layers of review: variance scans against public benchmarks, anomaly sweeps by senior peers, and a final sign-off one week before publication. Models refresh yearly, with mid-cycle updates triggered by material events such as regulatory shifts or greater than 10 percent volatility in quarterly fundraising data.
Why Mordor's Private Equity Baseline Commands Reliability
Published estimates differ because firms pick dissimilar scopes, currency bases, and refresh cadences. Some track only closed-end funds, others count deal flow, while a few rely on voluntary manager surveys.
Key gap drivers include Mordor's inclusion of co-investments and evergreen pools, our annual currency normalization, and the practice of validating dry powder figures directly with fund CFOs. External publishers often exclude venture buckets or stop at reported deal proceeds, which compresses their totals and inflates perceived growth.
Benchmark comparison
| Market Size | Anonymized source | Primary gap driver |
|---|---|---|
| USD 17.36 T (2025) | Mordor Intelligence | - |
| USD 593.3 B (2025) | Global Consultancy A | Counts only closed-end funds; omits co-investments and evergreen pools |
| USD 530.3 B (2025) | Trade Journal B | Uses announced deal value, excludes venture and growth equity funds |
The comparison shows that narrower scopes shrink market values by more than an order of magnitude, whereas Mordor's disciplined inclusion rules, multi-source validation, and annual refresh cycle yield a balanced, transparent baseline that decision-makers can trace back to clearly documented variables.


Key Questions Answered in the Report
What is the current size and growth outlook for the private equity market?
The private equity market size is estimated at USD 19.96 trillion in 2026 and is projected to reach USD 37.85 trillion by 2031 at a 13.65% CAGR.
Which fund types and sectors are leading and growing fastest in private equity?
Buyouts led with a 38.39% share in 2025, while secondaries and fund-of-funds are the fastest-growing at an 8.84% CAGR; technology held 32.87% share in 2025 and energy and power is the fastest-growing at an 11.38% CAGR.
What is driving deal activity and liquidity in private equity in 2026?
Elevated dry powder, reopened syndicated loan markets, and broad adoption of GP-led continuation vehicles and secondaries are driving deployment and unlocking exits, while retail evergreen vehicles add capital resilience.
Which regions offer the strongest momentum for private equity deployment?
North America held 51.87% share in 2025 with strong financing access, while Asia-Pacific is the fastest-growing at a 7.48% CAGR driven by India and Japan and rising infrastructure needs.
How are interest rates and financing conditions affecting private equity transactions?
Higher rates reduced leverage and pressured coverage, but 2025 easing and record syndicated loan volumes improved access for large-cap deals, which shifted value creation toward operating improvements.
What strategies are top managers using to differentiate performance?
Leading firms emphasize operating value creation, AI integration, sector specialization, and liquidity solutions through continuation vehicles and secondaries to enhance returns and distributions.
Page last updated on:


