Green Bonds Market Size and Share
Market Overview
| Study Period | 2020 - 2031 |
|---|---|
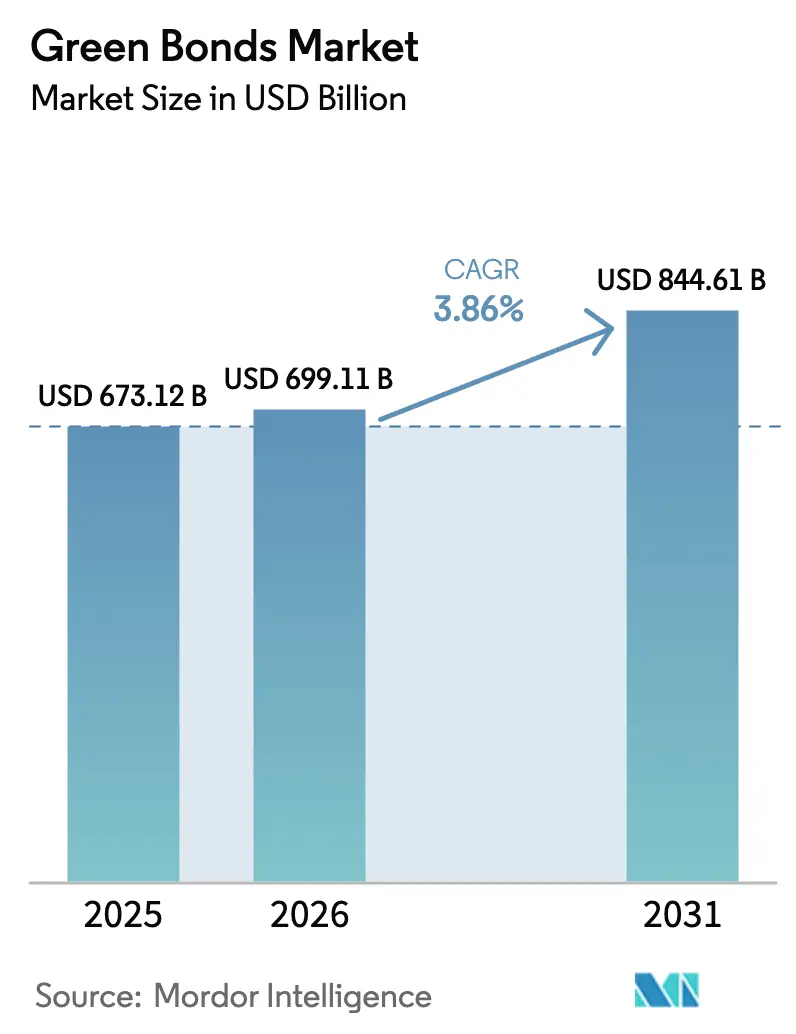
| Market Size (2026) | USD 699.11 Billion |
| Market Size (2031) | USD 844.61 Billion |
| Growth Rate (2026 - 2031) | 3.86% CAGR |
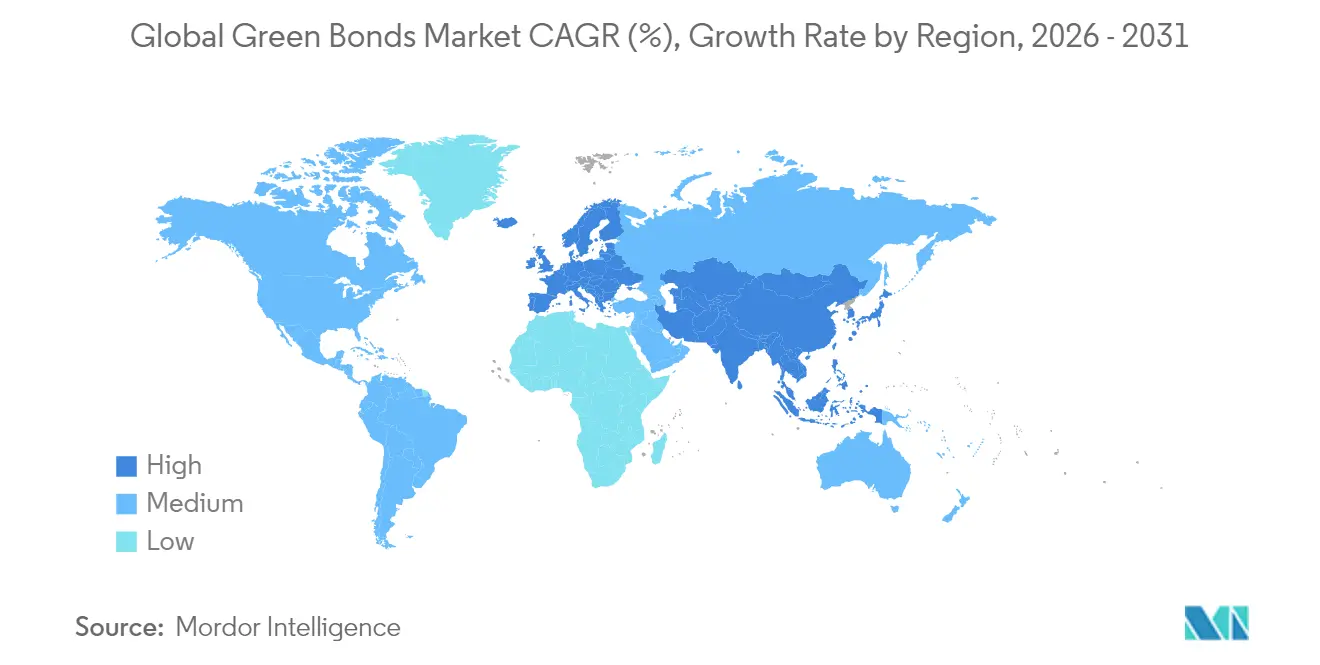
| Fastest Growing Market | Asia Pacific |
| Largest Market | Europe |
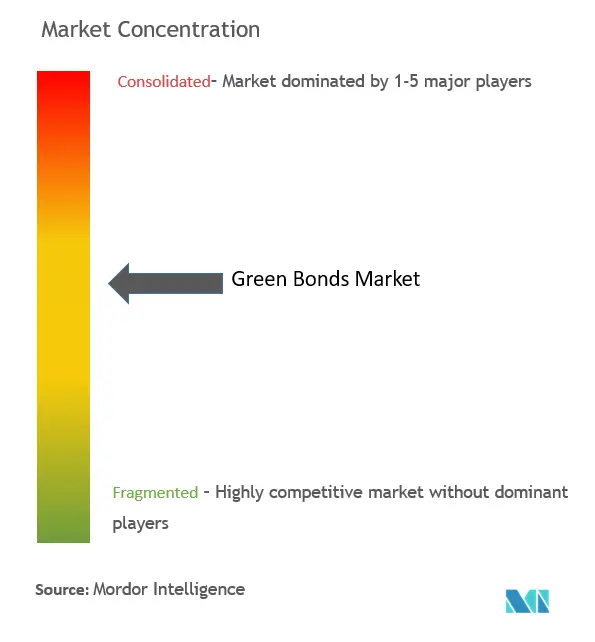
| Market Concentration | Medium |
Major Players *Disclaimer: Major Players sorted in no particular order Image © Mordor Intelligence. Reuse requires attribution under CC BY 4.0. | |
Green Bonds Market Analysis by Mordor Intelligence
The Green Bonds Market size is expected to grow from USD 673.12 billion in 2025 to USD 699.11 billion in 2026 and is forecast to reach USD 844.61 billion by 2031 at 3.86% CAGR over 2026-2031.
Demand reflects the fusion of net-zero policy signals with investor mandates for decarbonization, while issuance costs continue to fall as tokenization pilots and digital ledgers streamline documentation. Regulatory convergence is slow, yet the European Union’s new labeling scheme nudges issuers toward more granular reporting, sharpening price discovery, and thinning the greenium. Global sovereign programs now frame green bonds as public-sector climate diplomacy tools, creating liquid benchmarks that crowd in private capital. In parallel, corporate supply accelerates as falling renewable levelized costs improve project cash flows, broadening the investable universe in the green bond market.
Key Report Takeaways
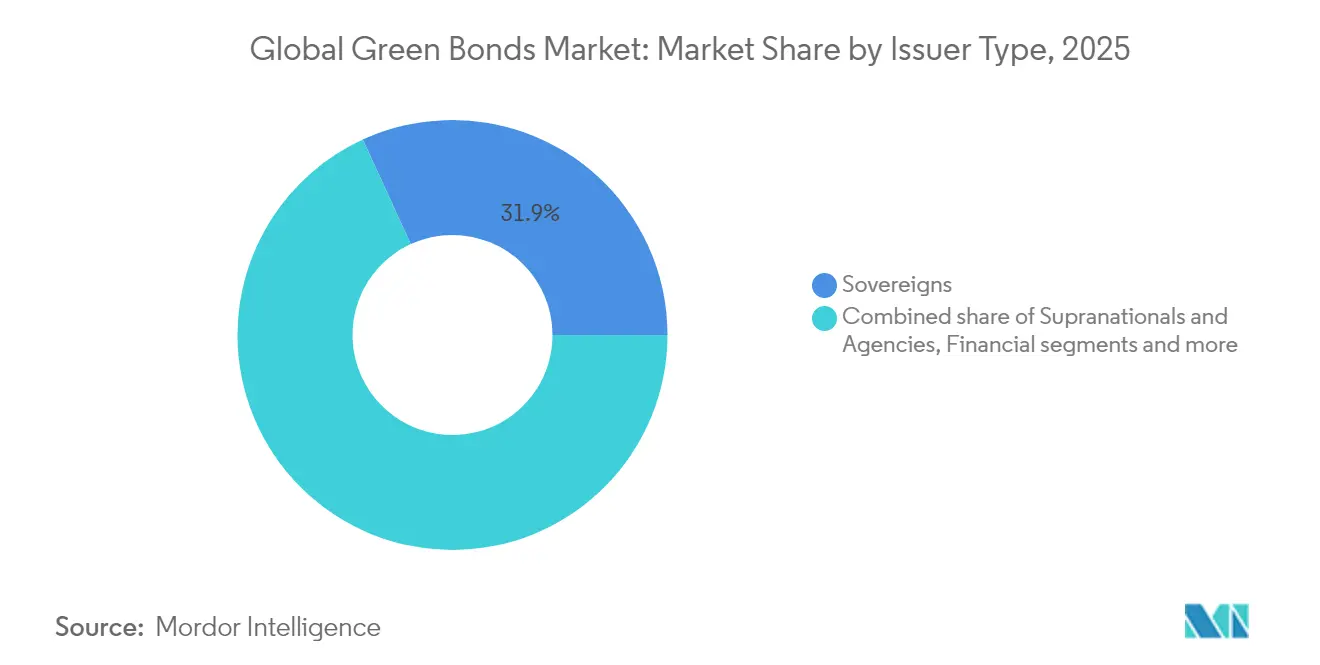
- By issuer type, sovereigns led with 31.85% of the green bond market share in 2025, while financial corporations recorded the highest projected CAGR at 4.65% through 2031.
- By use-of-proceeds, energy projects captured 28.15% of the green bond market size in 2025; land use & biodiversity financing is projected to expand at a 6.72% CAGR to 2031.
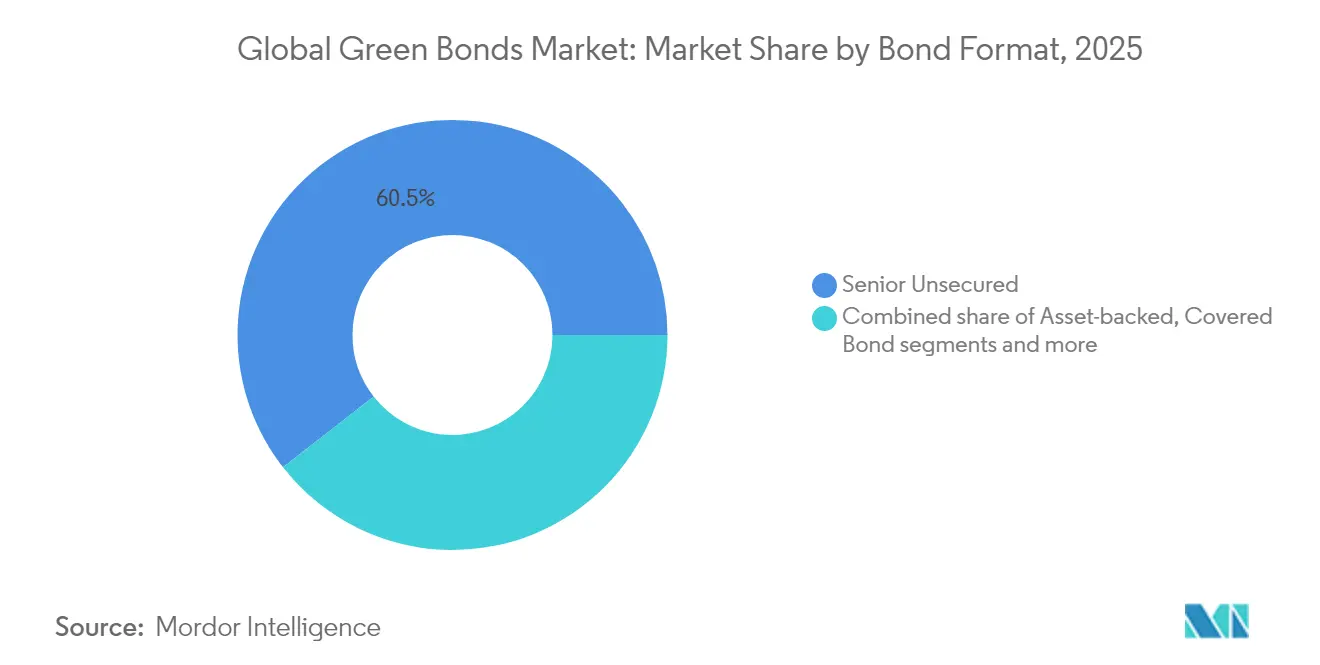
- By bond format, senior unsecured instruments accounted for a 60.55% share of the green bond market size in 2025, and sukuk formats are advancing at a 5.78% CAGR through 2031.
- By geography, the green bonds market in Europe held 43.70% revenue share in 2025, while Asia-Pacific is the fastest-growing region at a 5.98% CAGR to 2031.
Note: Market size and forecast figures in this report are generated using Mordor Intelligence’s proprietary estimation framework, updated with the latest available data and insights as of 2026.
Market Trends and Insights
Drivers Impact Analysis of Green Bonds Market*
| Driver | ( ~ ) % Impact on CAGR Forecast | Geographic Relevance | Impact Timeline |
|---|---|---|---|
| Sovereign net-zero commitments accelerating sovereign issuance | +0.8% | Global; early leadership in Europe and Asia-Pacific | Medium term (2-4 years) |
| EU Green Bond Standard spurring corporate supply | +0.6% | Europe primary; spillover global | Short term (≤ 2 years) |
| Declining clean-energy LCOE improves project bankability | +0.9% | Global; strongest in emerging markets | Long term (≥ 4 years) |
| ‘Biodiversity-linked’ green bonds unlocking nature finance | +0.4% | Latin America & Africa; expanding Asia-Pacific | Long term (≥ 4 years) |
| Tokenised green bonds lowering issuance costs for EM banks | +0.3% | Emerging markets, particularly Asia-Pacific and Middle East | Medium term (2-4 years) |
| Mutual-fund decarbonisation mandates driving muni green demand | +0.5% | North America and Europe, with spillover to developed Asia | Short term (≤ 2 years) |
| Source: Mordor Intelligence | |||
Sovereign Net-Zero Commitments Accelerating Sovereign Issuance
Sovereign issuance now anchors liquidity and price curves, exemplified by China’s USD 824 million debut in London that set a cross-border RMB benchmark[1]Climate Bonds Initiative, “China Issues First Sovereign Green Bond on LSE,” climatebonds.net. Australia’s USD 4.41 billion green bond attracted USD 13.86 billion in orders, illustrating the catalytic role of oversubscription in crowding in private capital. Canada expanded its framework to include nuclear expenditures, widening eligible assets without diluting environmental rigor. BIS analysis finds sovereign programs lift domestic corporate sustainable bond issuance by 23%, underscoring demonstration effects. With COP30 on the horizon, governments are timing deals to shape regional standards and secure first-mover reputational gains.
EU Green Bond Standard Spurring Corporate Supply
The EU Green Bond Standard (EuGB) took effect in December 2024, introducing external reviewer registration with ESMA and mandatory allocation reports[2]European Union, “Regulation (EU) 2023/2631 Establishing the European Green Bond Standard,” eur-lex.europa.eu. Only three issuers have adopted the EuGB so far, as compliance costs deter rapid uptake. The European Investment Bank’s USD 3.15 billion EuGB issue sets a liquidity benchmark for corporates keen to tap Europe’s USD 261.45 billion taxonomy-aligned investor pool. Financial institutions are early adopters because they already disclose taxonomy-aligned assets, gaining a funding cost edge that may spur competitive responses in other regions. As external jurisdictions reference EU criteria, arbitrage opportunities emerge for issuers able to navigate multiple taxonomies.
Declining Clean-Energy LCOE Improves Project Bankability
Utility-scale solar costs have fallen 85% since 2010 and onshore wind 56%, reaching USD 0.057/kWh and USD 0.039/kWh respectively[3]International Renewable Energy Agency, “Renewable Power Generation Costs in 2024,” irena.org. Lower generation costs strengthen debt-service ratios, compressing credit spreads for investment-grade projects. Yet higher capital costs lifted market electricity prices by 30% in 2024, creating temporary headwinds for developers as discount rates reset. Financing costs still vary widely—German onshore wind averages 1.1% while Ukrainian solar exceeds 10%, highlighting macro risk dispersion. Proceeds now target grid upgrades and battery storage, essential for integrating cheap but variable renewables, reinforcing a virtuous cost-reduction loop.
‘Biodiversity-Linked’ Green Bonds Unlocking Nature Finance
Colombia's new regulatory templates have paved the way for a USD 70 million biodiversity bond, specifically funding agroforestry initiatives aimed at promoting sustainable land use and biodiversity conservation. Meanwhile, the World Bank has introduced a USD 225 million bond, linking returns directly to verified carbon removals, which highlights its commitment to Amazon's reforestation and combating climate change. In a significant move, Uruguay has launched a USD 1.5 billion sustainability-linked sovereign bond, incorporating native-forest KPIs to ensure measurable environmental outcomes, thereby setting a precedent at the sovereign level for integrating sustainability into financial instruments. The Climate Bonds Standard has expanded its purview to include agri-food deforestation criteria, ensuring a disciplined and transparent approach to verification processes. With the maturation of measurement tools, institutional investors are now able to tap into natural capital markets, gaining exposure to sustainable investments while maintaining stringent risk controls and aligning with global environmental goals.
Restraints Impact Analysis of Green Bonds Market*
| Restraint | ( ~ ) % Impact on CAGR Forecast | Geographic Relevance | Impact Timeline |
|---|---|---|---|
| High real rates widen credit spreads for sub-investment-grade issuers | -0.7% | Global; acute in emerging markets | Short term (≤ 2 years) |
| Persistent greenwashing concerns raising second-party-opinion costs | -0.4% | Global; regulatory focus in Europe & North America | Medium term (2-4 years) |
| Lack of interoperable Asian taxonomies stalls cross-border flows | -0.3% | Asia-Pacific primary, spillover to global institutional investors | Medium term (2-4 years) |
| Shrinking 'greenium' eroding pricing incentive | -0.2% | Global, with strongest impact in developed markets | Short term (≤ 2 years) |
| Source: Mordor Intelligence | |||
High Real Rates Widen Credit Spreads for Sub-Investment-Grade Issuers
Tighter monetary policy lifted 10-year Treasury yields by 40 basis points in early 2025, inflating borrowing costs for lower-rated issuers. ECB research shows compressed US spreads are vulnerable as USD 1 trillion of corporate debt awaits refinancing. Federal Reserve studies confirm the geranium accrues mainly to large investment-grade names, leaving smaller developers exposed to wider spreads. Higher discount rates erode net present values for long-term renewable projects, delaying some pipeline assets in emerging markets where subsidy buffers are thin. Issuers with foreign-currency liabilities face an added layer of risk as a strong USD amplifies debt-service burdens, prompting some to hedge rate and FX exposure at higher derivative costs. In response, multilaterals are extending blended-finance structures that absorb first-loss tranches, yet take-up remains limited by sovereign guarantee ceilings.
Persistent Greenwashing Concerns Raising Second-Party-Opinion Costs
Only issuers with robust credentials secure meaningful geranium, according to empirical pricing work in peer-reviewed journals. ESMA’s stricter fund-naming rules force asset managers to verify underlying assets, raising demand for third-party reviews that add 15-25 basis points to issuance costs. Market-wide sustainable bond volume crossed USD 6 trillion in 2024, but inconsistent disclosure fuels skepticism, prompting calls for outcome-based instruments that link coupons to performance. Heightened scrutiny may consolidate issuance among experienced players that can absorb verification overheads. Reputational penalties are also climbing; regulators in Europe can now fine issuers up to 5% of annual turnover for misleading sustainability claims, increasing the downside risk of label misuse. As a defense, issuers are adopting blockchain-anchored reporting tools that timestamp project-level data feeds, although interoperability issues across platforms remain unresolved.
*Our forecasts treat driver/restraint impacts as directional, not additive. The impact forecasts reflect baseline growth, mix effects, and variable interactions.
Green Bonds Market Segment Analysis
By Issuer Type:
Sovereigns Hold Scale While Corporates AccelerateSovereigns captured 31.85% of the green bond market share in 2025 as governments leveraged issuance for climate signaling ahead of multilateral forums. It highlights the growing role of governments in driving sustainable finance initiatives. Financial corporates are set to see their green bond market size grow at a 4.65% CAGR through 2031, driven by capital adequacy rules that encourage banks to prioritize ESG-linked assets. This trend reflects the increasing integration of environmental, social, and governance considerations into financial strategies. Additionally, the World Bank's USD 1.10 billion bond for 2025, which attracted a robust USD 1.95 billion in orders, underscored the steady benchmarks and perceived safety associated with development-bank paper, further solidifying investor confidence in supranational issuances.
Non-financial Corporates are reacting to supply-chain decarbonization pressures; Dow Chemical’s USD 1.25 billion debut channels proceeds to its Path2Zero program. Municipal issuance remains underweighted at 23% of US green volume despite a USD 400 billion annual muni market, signaling a latent upside once disclosure protocols mature. Singapore’s public housing agency issued USD 703 million in green notes, showcasing how sub-sovereigns can replicate sovereign playbooks to finance resilient infrastructure. A growing cadre of export credit agencies is also stepping in with guarantee schemes that lower coupons for industrial exporters, linking green bond proceeds to domestic content rules. Meanwhile, margin improvements for investment-grade corporates are encouraging repeat issuance programs that standardize documentation and shorten execution timelines.


By Use-of-Proceeds Sector:
Energy Dominance Faces Biodiversity ChallengeIn 2025, the energy sector captured 28.15% of the green bond market, driven by falling renewable costs and strategic grid investments. This dominance highlights the sector's ability to attract significant capital as stakeholders prioritize sustainable energy solutions. The sector's growth is further supported by global efforts to transition to cleaner energy sources and reduce carbon emissions. Meanwhile, the Land Use & Biodiversity segment emerged as the fastest-growing category, set to achieve a 6.72% CAGR. This growth is fueled by the monetization of verified ecosystem services, which are increasingly creating investable cash flows and drawing attention from investors seeking environmentally impactful opportunities. The segment's expansion also reflects a growing recognition of the economic value of preserving biodiversity and sustainable land use practices.
Building financing gathers momentum via retrofit programs aligned with the EU taxonomy, while transport proceeds increasingly fund EV charging corridors and sustainable aviation fuel. Water infrastructure attracts issuers in drought-prone geographies, and industrial allocations target process electrification and data center efficiency. Biodiversity outcome bonds like the World Bank’s Amazon deal validate nature finance pathways, diversifying the asset base beyond conventional renewables. Hydrogen-related projects are now eligible in several frameworks, signaling an emerging pipeline of electrolyzer and storage assets that could reshape energy allocations post-2027. Adaptation finance for climate-resilient agriculture and coastal defense is also creeping into use-of-proceeds labels, widening the sectoral mix available to investors.
By Bond Format:
Senior Unsecured Stability Meets Sukuk InnovationIn 2025, senior unsecured structures captured a dominant 60.55% of the green bond market, lauded for their straightforwardness and robust secondary liquidity. Investors particularly favor these structures due to their simplicity, which reduces complexity in issuance and trading. Their deep secondary market liquidity ensures that investors can easily buy and sell these bonds, making them an attractive option for both institutional and retail participants. Furthermore, the widespread adoption of senior unsecured structures reflects their ability to meet the growing demand for transparent and accessible green financing instruments. Meanwhile, sukuk instruments are witnessing a 5.78% CAGR growth as Islamic investors harmonize Sharia compliance with ESG mandates.
Indonesia's sovereign program has rolled out a substantial USD 9.17 billion in green sukuk, channeling funds into flood control and mangrove restoration initiatives. In Europe, covered-bond structures are bolstering green mortgage origination, while in emerging markets, asset-backed project bonds are financing singular energy or transport projects, frequently backed by credit wraps from multilateral. Innovations like Hong Kong's digital green bond underscore a tre institutionsnd toward enhanced cost efficiency and transparency. Additionally, sustainability-linked bonds, which adjust coupon step-ups based on performance indicators, are gaining traction alongside traditional use-of-proceeds formats. This trend offers issuers the leeway to fund capital expenditures that may not strictly align with green asset criteria. Furthermore, mini-bond programs, typically under USD 50 million, are surfacing for community-centric solar and waste-to-energy projects, buoyed by streamlined prospectus exemptions that alleviate legal costs for local developers.
Geography Analysis
Europe Green Bonds Market
Europe commanded 43.70% of the green bond market in 2025, underpinned by pension-fund demand and the rollout of the EU Green Bond Standard. Germany's innovative twin-bond strategy, which issues both conventional and green tranches with synchronized maturities, has created distinct yield differentials, bolstering transparency in secondary pricing. Italy's BTP Green program allocated a significant USD 14.49 billion, projecting potential lifetime CO₂ reductions of 66.6 million tons. However, a mere 9% of Europe's green bonds align fully with the EU taxonomy, highlighting a notable compliance gap that could hinder future issuances. This gap underscores the need for enhanced regulatory alignment and issuer adaptation to meet the stringent EU taxonomy requirements, which could influence the pace of green bond market growth in the region.
APAC Green Bonds Market
Asia-Pacific is the fastest-growing region at a 5.98% CAGR, buoyed by China’s RMB-denominated sovereign green bond in London and Japan’s USD 11 billion transition bond program. Hong Kong's innovative USD 765 million blockchain-based green bonds achieved a remarkable 15-20% savings in issuance costs, setting a precedent likely to be emulated by neighboring hubs. Singapore, under a consolidated framework, aims for a bold USD 35 billion in green issuances by 2030, reflecting its commitment to becoming a leading green finance hub. Meanwhile, Australia celebrated its first USD 4.41 billion deal, attracting global investor interest and signaling the country's growing focus on sustainable finance. The region's diverse approaches, from blockchain integration to large-scale sovereign programs, highlight its adaptability and potential to lead in green bond innovation.
The Americas and MEA Green Bonds Market
In North America, progress is uneven. While US municipalities hold a modest share of the green bond market, state-level climate mandates in New York and California suggest a quicker adoption, especially with the arrival of standardized disclosures. These mandates, coupled with increasing investor awareness, are expected to accelerate green bond adoption in the United States. Canada's broadened framework, now inclusive of nuclear assets, diversifies eligible categories and signals robust federal endorsement, reflecting the country's strategic approach to expanding its green finance market. In South America, sovereigns are trailblazing with debt-for-nature swaps; Uruguay stands out, tying its KPI bond's coupon increments to forest conservation goals. This innovative approach aligns financial incentives with environmental outcomes, setting a benchmark for sustainable finance in the region. Over in the Middle East & Africa, the UAE and Saudi Arabia are at the forefront of the sustainable sukuk arena, artfully merging Islamic finance tenets with ESG commitments. Their leadership in this niche market underscores the region's ability to integrate cultural and financial principles with global sustainability standards, paving the way for further growth in sustainable finance.

Competitive Landscape
Green bonds Market share among underwriters is concentrated. BofA Securities led with USD 62.7 billion in 2024 green transactions. Crédit Agricole displaced SEB atop the global league table in Q3 2024, reflecting the premium attached to full-service ESG advisory capabilities. European banks such as Société Générale have pledged USD 541.1 billion in sustainable finance by 2030, reserving USD 108.2 million for green bonds, leveraging taxonomy expertise to differentiate.
US and Canadian dealers stress the breadth of distribution networks; RBC Capital Markets and J.P. Morgan each exceeded USD 40 billion in 2024 issuance, supported by established investor books. New entrants include blockchain-platform arrangers that target emerging-market sovereigns seeking lower execution costs; Hong Kong’s Monetary Authority indicates 15-20% savings versus legacy processes. Certification frameworks also evolve: Climate Bonds Initiative now permits entity-level certification, enabling frequent issuers to streamline repeat deals.
Strategic moves highlight escalating commitments. Goldman Sachs raised its 2030 sustainable-finance target to USD 750 billion, explicitly carving out transition-finance allocations. Deutsche Bank reported USD 403.4 million in cumulative sustainable financing since 2020 and issued its first social bond in 2024. Multilateral lenders such as the Central American Bank for Economic Integration placed a record USD 1.5 billion sustainable bond in March 2025, validating appetite for high-impact emerging-market paper.
Green Bonds Industry Leaders
HSBC
Crédit Agricole CIB
BNP Paribas
Bank of America
J.P. Morgan
- *Disclaimer: Major Players sorted in no particular order
Green Bonds Market Companies Covered in this Report
- HSBC
- Crédit Agricole CIB
- BNP Paribas
- Bank of America
- J.P. Morgan
- SEB
- NatWest Markets
- Citigroup
- Barclays
- Deutsche Bank
- UBS
- Mizuho Financial Group
- Societe Generale
- ING
- Goldman Sachs
- Industrial & Commercial Bank of China (ICBC)
- Fannie Mae
- KfW
- Nordea
- Standard Chartered

Recent Industry Developments in Green Bonds Market
- March 2025: Central American Bank for Economic Integration issued a USD 1.5 billion Sustainable Global Bond, 6 times oversubscribed, 3-year maturity, 4.7% coupon BCIE.
- March 2025: Deutsche Bank reported USD 403.41 billion cumulative sustainable financing since 2020 and placed its first USD 532.4 million social bond Deutsche Bank.
- February 2025: Dow Chemical completed USD 1.25 billion inaugural green bonds, channeling proceeds to its Alberta Path2Zero project.
- January 2025: The Climate Investment Funds (CIF) Capital Markets Mechanism debuted a USD 500 million AA+/Aa1‑rated bond in January 2025, attracting orders and making it around six times oversubscribed.


Green Bonds Market Report Scope and Research Methodology
Market Definition and Coverage
Our study defines the global green bonds market as the total outstanding value of debt securities whose proceeds are formally earmarked for renewable energy, clean transport, sustainable water, and energy-efficient infrastructure projects, with eligibility verified against the ICMA Green Bond Principles or the EU Green Bond Standard, and all figures converted to 2025 average USD rates.
Scope exclusion: We do not count social, transition, or sustainability-linked instruments unless they carry a dual green label and publish post-issuance allocation reports.
Segments Covered in This Report
- By Issuer Type
- Sovereigns
- Supranationals & Agencies
- Financial Corporates
- Non-Financial Corporates
- Municipal & Local Authorities
- By Use-of-Proceeds Sector
- Energy
- Buildings
- Transport
- Water & Wastewater
- Land Use & Biodiversity
- Industrial & ICT
- By Bond Format
- Senior Unsecured
- Asset-backed/Project Bond
- Covered Bond
- Sukuk
- By Geography
- North America
- Canada
- United States
- Mexico
- South America
- Brazil
- Peru
- Chile
- Argentina
- Rest of South America
- Europe
- United Kingdom
- Germany
- France
- Spain
- Italy
- BENELUX
- NORDICS
- Rest of Europe
- Asia-Pacific
- India
- China
- Japan
- Australia
- South Korea
- South-East Asia
- Rest of Asia-Pacific
- Middle East and Africa
- United Arab Emirates
- Saudi Arabia
- South Africa
- Nigeria
- Rest of Middle East and Africa
- North America
Data Sources, Market Sizing, and Validation
Primary Research
We validate desk findings through structured conversations with sovereign debt managers, sustainability heads at commercial banks, and institutional investors across Europe, Asia-Pacific, and the Americas. These conversations clarify allocation audit practices, spread movements, and near-term issuance pipelines.
Desk Research
We begin by extracting issuance and redemption series from freely available platforms such as Climate Bonds Initiative dashboards, Bloomberg NEF public snapshots, World Bank Treasury newsletters, and BIS statistical bulletins. Then, Mordor analysts reconcile these with finance-ministry debt portals, central-bank databases, and IMF currency averages. Company prospectuses lodged with the SEC and ESMA, ICMA disclosure templates, plus selective pulls from paid interfaces like D&B Hoovers and Dow Jones Factiva, let our team confirm coupon terms, maturity buckets, and allocation status. The sources named are illustrative; many additional public and subscription feeds underpin our evidence stack.
Market-Sizing & Forecasting
Our core model applies a top-down reconstruction of outstanding value by adding yearly issuance to the prior stock and subtracting scheduled redemptions. It then cross-checks results with a bottom-up sample of issuer roll-ups and channel checks. Key variables include primary issuance volume, weighted average tenor, redemption ladders, regulatory adoption rates, secondary-market premium, and major currency swings. We forecast through multivariate regression blended with scenario analysis, linking issuance momentum to carbon-policy stringency scores and institutional ESG allocation targets. When issuer data are sparse, we interpolate redemption curves from comparable cohorts before final triangulation.
Data Validation & Update Cycle
Outputs undergo variance tests against external indices, followed by senior analyst sign-off. We refresh models annually and trigger interim updates when major policy or market shocks emerge, with a final sweep before publication so clients receive the latest view.
How Mordor Intelligence's Green Bonds Market Size Compares to Other Published Estimates
Published estimates diverge because some firms focus on flow data, use older base years, or omit supranationals. By anchoring on outstanding value, applying strict eligibility filters, and updating every year, Mordor offers a balanced, transparent midpoint that decision-makers can trace line by line.
Benchmark comparison
| Market Size | Anonymized source | Primary gap driver |
|---|---|---|
| USD 673.1 Bn (2025) | Mordor Intelligence | |
| USD 582.6 Bn (2023) | Regional Consultancy A | Older base year; excludes municipal issuance |
| USD 479.2 Bn (2024) | Global Consultancy B | Omits supranationals; converts at spot FX |
| USD 349.1 Bn (2023) | Industry Observer C | Counts annual issuance only, not outstanding stock |
These contrasts highlight how scope, currency treatment, and refresh cadence widen gaps. Mordor's disciplined approach delivers the dependability our clients need.


Key Questions Answered in the Report
What was the size of the global green bond market in 2026?
The global green bond market reached USD 699.11 billion in 2026.
Which issuer segment is growing fastest?
Financial Corporates are projected to grow at a 4.65% CAGR through 2031, the fastest among issuer groups.
Why is the EU Green Bond Standard important for issuers outside Europe?
EuGB compliance can unlock access to Europe’s EUR 249 billion taxonomy-aligned capital pool, giving non-European issuers a pricing and distribution advantage.
How does declining renewable energy cost influence green bonds?
Falling levelized costs boost project cash flows, supporting tighter credit spreads and expanding the pipeline of bankable assets.
What role do biodiversity-linked green bonds play in market growth?
They channel capital into conservation and restoration projects, driving the Land Use & Biodiversity segment’s 6.72% CAGR.
Are higher interest rates a threat to green bond issuance?
Elevated real rates widen spreads for sub-investment-grade issuers, potentially delaying projects in emerging markets until financing conditions ease.
Page last updated on:


