Sustainable Finance Market Size and Share
Market Overview
| Study Period | 2020 - 2031 |
|---|---|
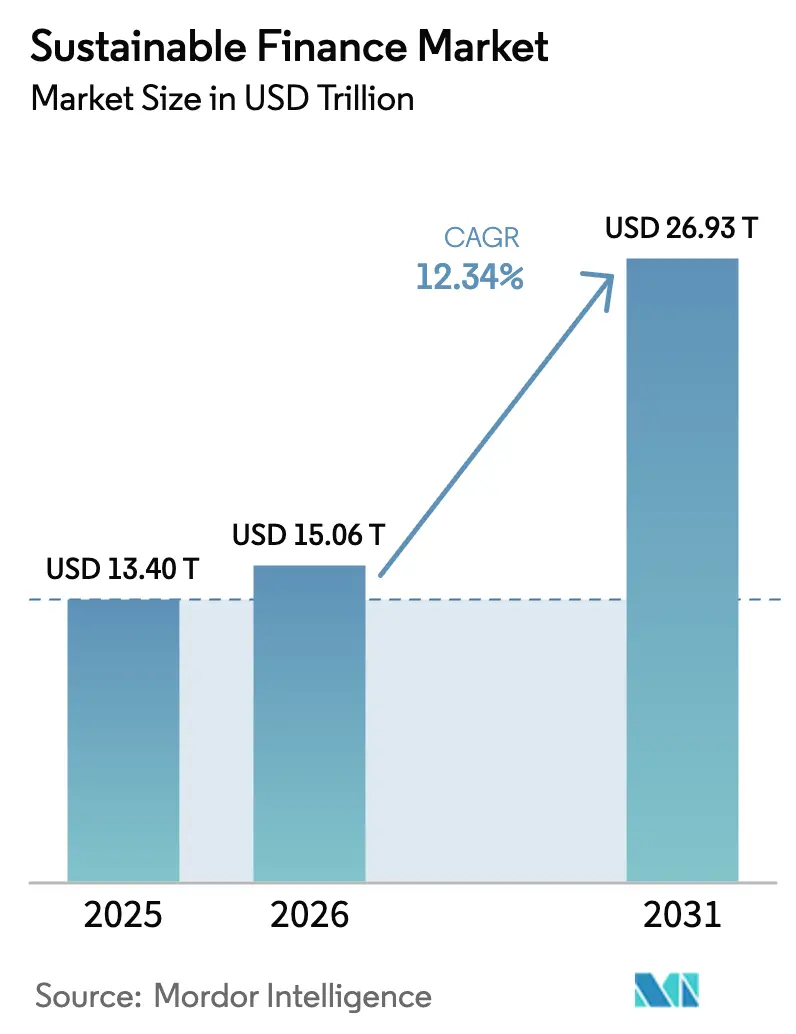
| Market Size (2026) | USD 15.06 Trillion |
| Market Size (2031) | USD 26.93 Trillion |
| Growth Rate (2026 - 2031) | 12.34% CAGR |
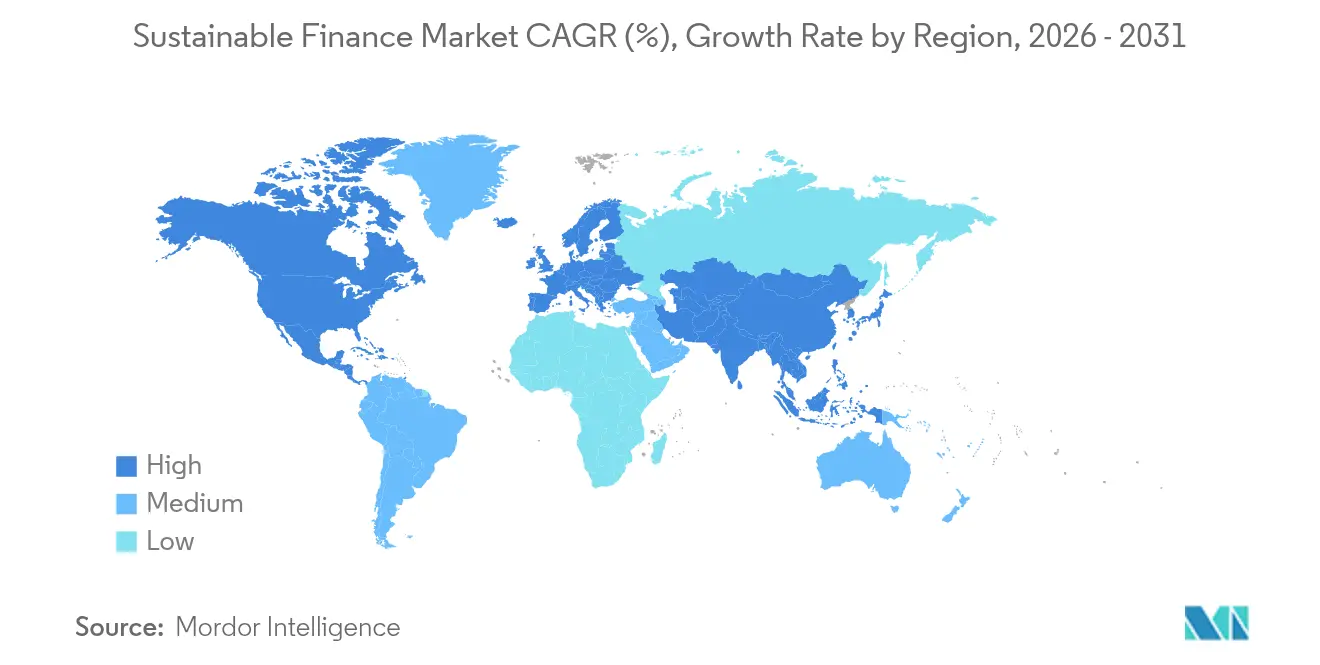
| Fastest Growing Market | Europe |
| Largest Market | Asia Pacific |
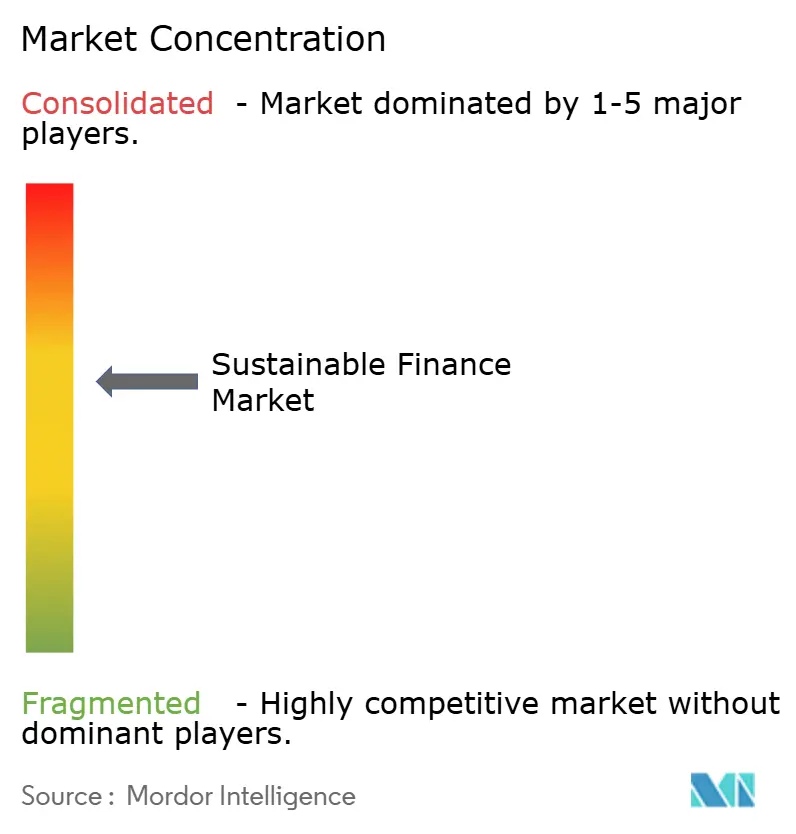
| Market Concentration | Medium |
Major Players *Disclaimer: Major Players sorted in no particular order Image © Mordor Intelligence. Reuse requires attribution under CC BY 4.0. | |
Sustainable Finance Market Analysis by Mordor Intelligence
The Sustainable Finance Market size was valued at USD 13.40 trillion in 2025 and is estimated to grow from USD 15.06 trillion in 2026 to reach USD 26.93 trillion by 2031, at a CAGR of 12.34% during the forecast period (2026-2031).
Europe remains the largest regional pool, yet institutional capital is rotating quickly toward Asia-Pacific as sovereign green bond programs accelerate. Central-bank climate stress-testing, mandatory disclosure rules, and sovereign issuance pipelines have turned environmental, social, and governance (ESG) factors from optional screens into core risk variables for global banks and investors. Rapid product innovation, from tokenized green assets to performance-linked debt, has broadened the investable universe and reduced transaction frictions. Although regulatory momentum is strong, the market’s forward trajectory still hinges on harmonized taxonomies, interest-rate dynamics that preserve the greenium, and sustained political support for ESG mandates.
Key Report Takeaways
- By transaction type, green bonds accounted for 53.88% of the sustainable finance market share in 2025, while sustainability-linked and transition bonds are on track to rise at a 14.08% CAGR to 2031.
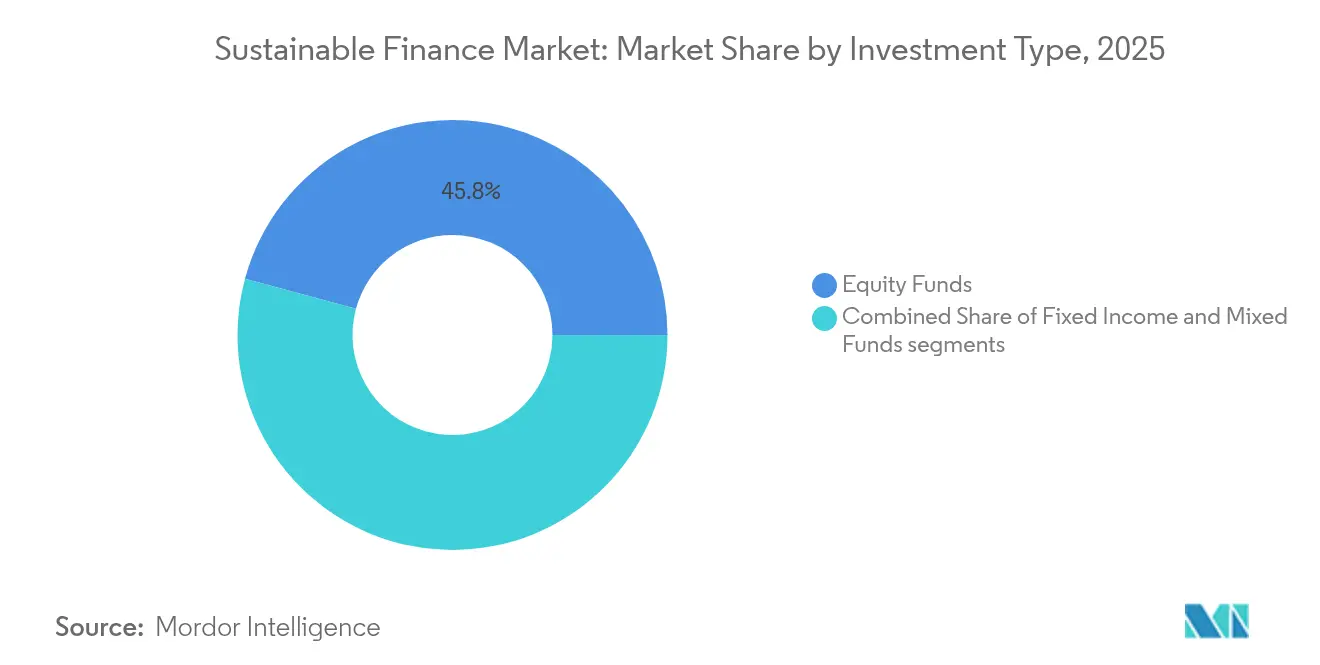
- By investment type, equity funds led with 45.78% of the market share in 2025; mixed/multi-asset strategies are forecast to expand at 13.22% CAGR through 2031.
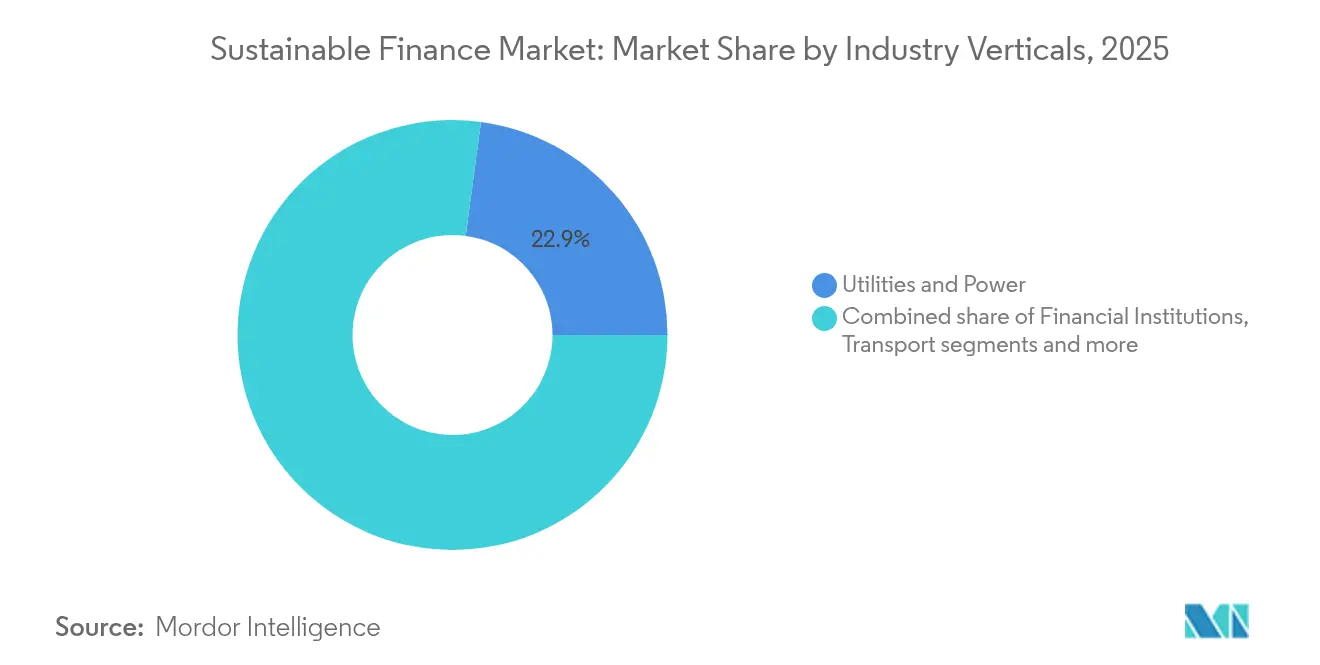
- By industry vertical, utilities and power captured 22.89% of the sustainable finance market size in 2025, whereas financial institutions are projected to post the fastest 11.14% CAGR to 2031.
- By geography, Europe held a 31.72% revenue share of the market in 2025; Asia-Pacific is projected to grow at a 12.53% CAGR to 2031.
Note: Market size and forecast figures in this report are generated using Mordor Intelligence’s proprietary estimation framework, updated with the latest available data and insights as of 2026.
Market Trends and Insights
Drivers Impact Analysis of Sustainable Finance Market*
| Driver | ( ~ ) % Impact on CAGR Forecast | Geographic Relevance | Impact Timeline |
|---|---|---|---|
| Regulatory push & mandatory ESG disclosures | +2.5% | Global (EU leadership; APAC uptake) | Medium term (2-4 years) |
| Rise of corporate-stakeholder ESG pressure | +1.8% | North America & Europe spreading to APAC | Short term (≤2 years) |
| Proven long-term risk-adjusted returns of ESG assets | +2.1% | Global institutional markets | Long term (≥4 years) |
| Central-bank climate stress-testing of balance sheets | +1.4% | Developed markets; selective emerging economies | Medium term (2-4 years) |
| Tokenization & blockchain-based green asset issuance | +0.9% | Global; early adoption in Singapore and Hong Kong | Long term (≥4 years) |
| Climate-adaptation & resilience finance demand surge | +1.2% | Global; concentrated in climate-vulnerable regions | Long term (≥4 years) |
| Source: Mordor Intelligence | |||
Regulatory Push and Mandatory ESG Disclosures
The EU Corporate Sustainability Reporting Directive now obliges more than 50,000 companies to publish detailed sustainability metrics, giving investors a consistent data spine for portfolio analysis[1]European Commission, “Directive (EU) 2022/2464 (CSRD),” europa.eu . Similar frameworks from the International Sustainability Standards Board are being adopted in the UK, Japan, and Australia, creating a de facto global “accounting language” for climate data. Mandatory disclosures shrink information asymmetry, reduce diligence costs, and enable easier cross-border comparison of issuers. Asset managers are using the new data to adjust credit spreads for transition risk, rewarding compliant borrowers with cheaper capital. Sovereign regulators are also embedding disclosure requirements into listing rules, extending the discipline to private and state-owned enterprises. As a result, ESG considerations have moved from voluntary policies to core prudential standards within the sustainable finance market.
Rise of Corporate-Stakeholder ESG Pressure
Shareholder support for ESG resolutions rose to 28% in 2024, signaling a broader willingness to influence corporate policy[2]BlackRock, “Investment Stewardship 2024 Voting Report,” blackrock.com . Boards face simultaneous pressure from customers and employees who increasingly select suppliers and employers on sustainability performance, accelerating target-setting for decarbonization and social equity. Financial institutions have responded with sizeable balance-sheet pledges, HSBC aims for USD 750 billion in sustainable finance by 2030, ING targets USD 162 billion, and Deutsche Bank earmarks USD 540 billion. These public goals generate a competitive cascade as peers match or exceed commitments to avoid reputational risk. Lenders are also tightening sustainability covenants in revolving credit facilities, sharpening incentives for real-economy issuers. Together, these forces reinforce a self-reinforcing cycle that channels incremental capital toward the sustainable finance market.
Proven Long-Term Risk-Adjusted Returns of ESG Assets
A 2024 survey of 700 ESG equity funds found that 73% beat conventional benchmarks on a volatility-adjusted basis. Outperformance stems from ESG metrics acting as proxies for management quality, supply-chain robustness, and regulatory preparedness, all of which translate into steadier cash flows. Academic work shows ESG leaders experience lower financing costs and smaller drawdowns during market stress, improving Sharpe ratios. Pension trustees and endowments are increasingly making ESG integration a fiduciary requirement, not an optional overlay. Liquidity has improved as market makers quote tighter spreads for labelled bonds and ETFs, reducing transaction costs for allocators. Collectively, the empirical return profile underpins sustained growth in the sustainable finance market.
Central-Bank Climate Stress-Testing of Balance Sheets
The European Central Bank’s 2024 stress test of 98 banks covering 70% of euro-area assets indicated potential transition-risk losses of up to USD 75.6 billion under disorderly-transition scenarios[3]European Central Bank, “Climate Stress Test 2024: Methodology and Results,” ecb.europa.eu. The Bank of England and the United States Federal Reserve have launched parallel pilots, embedding climate metrics into capital adequacy reviews. As supervisors publish results, banks must re-price high-carbon exposures and raise capital against worst-case losses. This pushes lenders to expand green lending books and scale back fossil-fuel finance, reallocating credit to renewable infrastructure and resilience projects. Insurers face similar solvency tests, driving asset-side portfolio shifts. These supervisory tools hard-wire ESG risk into prudential frameworks, accelerating capital flows into the sustainable finance market.
Restraints Impact Analysis of Sustainable Finance Market*
| Restraint | ( ~ ) % Impact on CAGR Forecast | Geographic Relevance | Impact Timeline |
|---|---|---|---|
| Lack of global taxonomy / data standardization | -1.3% | Global; especially challenging for emerging markets | Medium term (2-4 years) |
| Perceived green-washing & credibility gaps | -0.8% | Global; sharper in regimes with weak oversight | Short term (≤2 years) |
| Political backlash & anti-ESG legislation (US states) | -0.9% | North America, with spillover effects to global asset flows | Short term (≤ 2 years) |
| Rising rates eroding "greenium" bond pricing | -0.7% | Global fixed-income markets, particularly developed economies | Medium term (2-4 years) |
| Source: Mordor Intelligence | |||
Lack of Global Taxonomy / Data Standardization
While the EU Taxonomy provides granular screening criteria, the US, China, and India have developed divergent frameworks, forcing multinational issuers to navigate conflicting definitions of “sustainable”. Compliance teams must map activities to multiple classifications, inflating issuance costs and delaying transaction timelines. For investors, inconsistent data hinders cross-border portfolio comparisons and may reduce appetite for foreign labelled debt. Emerging-market borrowers face the steepest hurdles because they often lack internal capacity to meet varied disclosure rules. Efforts by the International Sustainability Standards Board aim to converge approaches, but wholesale alignment is unlikely before 2027. Until then, fragmented taxonomies will continue to shave growth points off the sustainable finance market.
Perceived Green-Washing & Credibility Gaps
The European Securities and Markets Authority’s 2024 review uncovered widespread inconsistencies between fund labels and underlying holdings, sparking stricter naming rules and possible reclassifications. Asset managers now incur higher assurance and audit costs to validate sustainability claims. Investors, wary of reputational risk, conduct deeper due diligence, extending allocation lead times and sometimes opting for passive benchmarks with clear rules. Litigation risk is climbing, as class-action suits target alleged mis-selling of ESG products in the US and Australia. Rating agencies have responded with tougher methodologies, occasionally downgrading issuers that overstate decarbonization plans. These credibility concerns can curb inflows until impact-measurement standards mature, tempering the sustainable finance market’s expansion.
*Our forecasts treat driver/restraint impacts as directional, not additive. The impact forecasts reflect baseline growth, mix effects, and variable interactions.
Sustainable Finance Market Segment Analysis
By Investment Type:
Multi-Asset Strategies Gain GroundMixed and multi-asset vehicles hold rising appeal, growing at a 13.22% CAGR through 2031 as institutions seek diversified access across public equity, private credit, and infrastructure. Equity funds still represent 45.78% of the sustainable finance market share in 2025, buoyed by robust renewable and clean-tech performance. Yet the rapid uptake of multi-asset products underscores a desire to capture the full transition spectrum in one mandate. The Wellington-Vanguard-Blackstone collaboration showcases how partnerships can democratize previously exclusive strategies. Private-market sleeves inside these vehicles channel capital to grid modernization, battery storage, and nature-based carbon projects; areas where listed exposure is scarce. Fixed-income allocations are also swelling as labelled-bond pipelines deepen; global sustainable bond issuance approached USD 1 trillion in 2024, broadening credit diversification. Investors welcome the ability to toggle risk profiles dynamically across asset classes without leaving a single vehicle, reinforcing momentum behind multi-asset solutions.
A second trend is the steady institutionalization of thematic ETFs and mandates tracking water, circular-economy, and social-inclusion indices. These instruments have attracted endowments and insurers looking to address specific impact goals within overall climate strategies, further enlarging the sustainable finance market. To support product integrity, managers embed third-party assurance and on-chain data feeds, which shorten reporting cycles and enhance credibility. As these structures mature, they provide a blueprint for expanding the sustainable finance market size by mobilizing retail and defined contribution capital.


By Transaction Type:
Performance-Linked Debt Reshapes IssuanceSustainability-linked and transition bonds are the fastest-moving corner of the sustainable finance market, advancing at 14.08% CAGR. Cumulative issuance since 2019 topped USD 250 billion, equal to more than 10% of the green-bond universe. The appeal lies in coupon step-ups if issuers miss decarbonization or diversity targets, aligning incentives with impact. Green bonds, however, remain anchor instruments with a 53.88% share of 2025 issuance. The European Central Bank’s decision to accept sustainability-linked paper as collateral has increased liquidity and compressed spreads. Early observation dates in 2025 will test issuer commitment, but preliminary data suggest most firms are on track, reinforcing investor confidence.
Adjacent innovations include blue bonds financing ocean conservation and resilience bonds for climate adaptation. Sovereigns such as Uruguay have pioneered sustainability-linked sovereign formats that embed GDP-adjusted coupons, signalling future optionality for fiscal authorities. Tokenised micro-bond structures under trial in Hong Kong could open the sustainable finance market to smaller corporates by cutting settlement costs. Together, these developments point toward a more granular capital stack aligned to transition pathways, broadening participation and enlarging the sustainable finance market size.
By Industry Vertical:
Finance Sector Leads ESG MainstreamingUtilities and power companies drew 22.89% of sustainable finance volumes in 2025, reflecting multi-trillion-dollar grid and renewables requirements. Yet banks and diversified financials display the highest 11.14% CAGR as they embed net-zero roadmaps into primary lending and advisory businesses. Commitments such as HSBC’s USD 750 billion-1 trillion and Deutsche Bank’s USD 540 billion targets illustrate how core balance sheet strategies are shifting toward climate-aligned exposures. Insurance groups are likewise tilting general accounts toward green infrastructure, having identified lower catastrophe risk correlations versus legacy portfolios. The sustainable finance industry is witnessing rapid product creation for transport, chemicals, and agriculture, each attracting blended-finance structures that combine multilateral guarantees with private debt. The growth of sustainability-linked derivatives for shipping and aviation fuels further attests to vertical expansion.
In parallel, corporate treasury teams are embedding ESG performance criteria into revolving credit facilities, extending sustainable finance beyond capital markets issuance. This cross-pollination boosts demand for external assurance providers and data analytics firms, generating a competitive service ecosystem that reinforces the sustainable finance market. Looking forward, industrial firms in hard-to-abate segments are expected to tap transition instruments heavily as they align with 2030 decarbonization milestones, enlarging segmental diversity.
Geography Analysis
Europe Sustainable Finance Market
Europe retained 31.72% of global sustainable finance market share in 2025, supported by the EU Taxonomy, CSRD, and the Sustainable Finance Disclosure Regulation, which together create the most comprehensive rulebook worldwide. Germany’s twin-tranche Bund green securities and Italy’s BTP Green series shape the euro yield curve, anchoring investor demand. The European Central Bank’s collateral policy further underwrites market liquidity. Regional growth is driven by the European Green Deal, which mobilises USD 1.08 trillion in public-private investment toward mid-century carbon neutrality.
APAC Sustainable Finance Market
Asia-Pacific records the fastest 12.53% CAGR to 2031. China’s USD 824 million sovereign green bond on the London Stock Exchange signalled Beijing’s commitment and is expected to catalyse onshore issuance. Singapore intends to raise up to USD 25.9 billion in green bonds and has launched Project Greenprint to digitalise sustainability data across the financial sector. Japan and Australia are debuting sovereign green programmes, with Canberra’s USD 4.62 billion green bond attracting USD 14.5 billion in bids from 105 global investors, illustrating surplus appetite for APAC climate assets. Southeast Asian nations are exploring blended-finance vehicles to de-risk early-stage renewable projects, while India’s Reserve Bank inclusion of green bonds in statutory liquidity norms is likely to drive domestic demand.
The Americas and MEA Sustainable Finance Market
North America remains a deep capital pool despite political contestation. US asset managers control trillions in ESG mandates, and federal incentives under the Inflation Reduction Act underpin renewable deployment, steering capital into climate infrastructure. Canada’s second USD 2.96 billion sovereign green bond, which controversially included nuclear energy, drew 66% ESG-oriented investors. Momentum could vary by state regulation, yet institutional allocations appear durable due to fiduciary appreciation of climate risk. Emerging markets in South America and the Middle East are gaining traction; Uruguay’s sustainability-linked bond and Saudi Arabia’s prospective green municipal issuances hint at diversification of the sustainable finance market. Although these regions start from smaller bases, regulatory ambition and infrastructure needs suggest outsized growth potential once frameworks mature.

Competitive Landscape
The sustainable finance market features moderate concentration: the top three asset managers, BlackRock, Vanguard, and State Street, hold significant shares yet face accelerating competition from fintechs, ESG data specialists, and regional champions. BlackRock’s USD 12 billion acquisition of HPS Investment Partners created a USD 220 billion private-credit platform that can structure bespoke sustainable loans, while the USD 3 billion purchase of Global Infrastructure Partners adds a USD 100 billion renewable and transport infrastructure pipeline. Vanguard has deepened shareholder-engagement capacity, and State Street is embedding real-time ESG analytics across its custody network to retain institutional stickiness.
Partnership models are proliferating. Wellington Management, Vanguard, and Blackstone have teamed up on multi-asset climate portfolios, demonstrating that scale players value specialist expertise to win mandates from pension and sovereign clients. Meanwhile, regional banks in Asia, such as DBS and OCBC, leverage local networks to originate green and transition loans, subsequently distributing risk via labelled securitizations. Blockchain-enabled platforms operating in Hong Kong and Singapore tokenize solar or energy-efficiency assets, expanding investor bases through fractionalization and instant settlement.
Competitive pressure also arises from ESG data providers that offer granular emissions, biodiversity, and supply-chain indicators, allowing midsize managers to compete on analytics rather than AUM heft. To defend margins, incumbents are investing in proprietary datasets, AI-driven impact measurement, and automated client reporting. Regulatory divergence across jurisdictions creates an advantage for globally diversified firms that can absorb compliance costs, yet nimble local players thrive by tailoring products to domestic guidelines. Over the forecast horizon, consolidation is likely as managers seek scale in private markets and infrastructure, while specialist impact houses will continue to carve out niches in adaptation finance and nature-based solutions, enlarging the sustainable finance market size.
Sustainable Finance Industry Leaders
BlackRock
Vanguard Group
State Street Global Advisors
Amundi
BNP Paribas Asset Management
- *Disclaimer: Major Players sorted in no particular order
Sustainable Finance Market Companies Covered in this Report
- BlackRock
- Vanguard Group
- State Street Global Advisors
- JPMorgan Asset Management
- Citigroup
- Goldman Sachs
- UBS
- Bank of America
- Amundi
- Allianz Global Investors
- BNP Paribas Asset Management
- HSBC Holdings
- Credit Agricole CIB
- NatWest Group
- Morgan Stanley
- AXA Investment Managers
- Deutsche Bank
- Legal & General Investment Management
- Nordea
- Schroders
- Macquarie Group
- ING Group

Recent Industry Developments in Sustainable Finance Market
- June 2025: Hong Kong Monetary Authority launched institutional green and infrastructure bond offerings to deepen the city’s green finance hub.
- June 2025: Allianz, BlackRock, and T&D Holdings agreed to acquire Viridium Group for USD 3.8 billion, expanding closed-book life-insurance capabilities.
- April 2025: Wellington Management, Vanguard, and Blackstone formed a strategic alliance for public-private multi-asset climate portfolios .
- April 2025: China’s Ministry of Finance issued its inaugural USD 824 million offshore sovereign green bond on the London Stock Exchange.


Global Sustainable Finance Market Report Scope
Sustainable finance compiles financial regulations, strategies, methodologies, and products designed to uphold environmental objectives. By funding its agents and pursuing a growth purpose, it makes it possible for the financial system to interact with the population and the economy. This report aims to provide a detailed analysis of the sustainable finance market. It focuses on insights into the many product and application types, market dynamics, and emerging trends in the segments and regional markets. It examines the competitive environment and the major players. The sustainable finance market is segmented by investment type, which includes equity, fixed income, and mixed allocation; by transaction type, including green bond, social bond, and mixed-sustainability bond; by industry, including utilities, transport and logistics, chemicals, food and beverage, and government; and by geography including North America, Europe, Asia-Pacific, South America, and the Middle East. The report offers the market size for the sustainable finance market in value terms in USD for all the abovementioned segments.
Segmentation Overview
| Equity Funds |
| Fixed-Income Funds |
| Mixed / Multi-Asset Allocation |
| Green Bonds |
| Social Bonds |
| Sustainability Bonds |
| ESG Investing |
| Others |
| Utilities & Power |
| Transport & Logistics |
| Chemicals & Materials |
| Food, Beverage & Agriculture |
| Public Sector / Government |
| Financial Institutions |
| North America | United States |
| Canada | |
| Mexico | |
| South America | Brazil |
| Argentina | |
| Rest of South America | |
| Europe | Germany |
| United Kingdom | |
| France | |
| Spain | |
| Russia | |
| Rest of Europe | |
| Asia-Pacific | China |
| Japan | |
| India | |
| Rest of Asia-Pacific | |
| Middle East & Africa | United Arab Emirates |
| Saudi Arabia | |
| South Africa | |
| Rest of Middle East & Africa |
| By Investment Type | Equity Funds | |
| Fixed-Income Funds | ||
| Mixed / Multi-Asset Allocation | ||
| By Transaction Type | Green Bonds | |
| Social Bonds | ||
| Sustainability Bonds | ||
| ESG Investing | ||
| Others | ||
| By Industry Vertical | Utilities & Power | |
| Transport & Logistics | ||
| Chemicals & Materials | ||
| Food, Beverage & Agriculture | ||
| Public Sector / Government | ||
| Financial Institutions | ||
| Geography | North America | United States |
| Canada | ||
| Mexico | ||
| South America | Brazil | |
| Argentina | ||
| Rest of South America | ||
| Europe | Germany | |
| United Kingdom | ||
| France | ||
| Spain | ||
| Russia | ||
| Rest of Europe | ||
| Asia-Pacific | China | |
| Japan | ||
| India | ||
| Rest of Asia-Pacific | ||
| Middle East & Africa | United Arab Emirates | |
| Saudi Arabia | ||
| South Africa | ||
| Rest of Middle East & Africa | ||


Key Questions Answered in the Report
What is the current size of the sustainable finance market?
The sustainable finance market size stood at USD 15.06 trillion in 2026 and is forecast to reach USD 26.93 trillion by 2031.
Which region leads the sustainable finance market today?
Europe held 31.72% of global sustainable finance market share in 2025, supported by the EU’s comprehensive regulatory architecture.
Which product segment is growing fastest?
Sustainability-linked and transition bonds are expanding at a 14.08% CAGR through 2031, making them the fastest-growing transaction category.
Why are multi-asset strategies popular in sustainable investing?
Institutions prefer multi-asset vehicles because they offer diversified exposure across public equity, private credit, and infrastructure while meeting ESG objectives, and they are growing at a 13.22% CAGR.
Page last updated on:


