United States Hedge Fund Market Size and Share
Market Overview
| Study Period | 2020 - 2031 |
|---|---|
| Forecast Data Period | 2026 - 2031 |
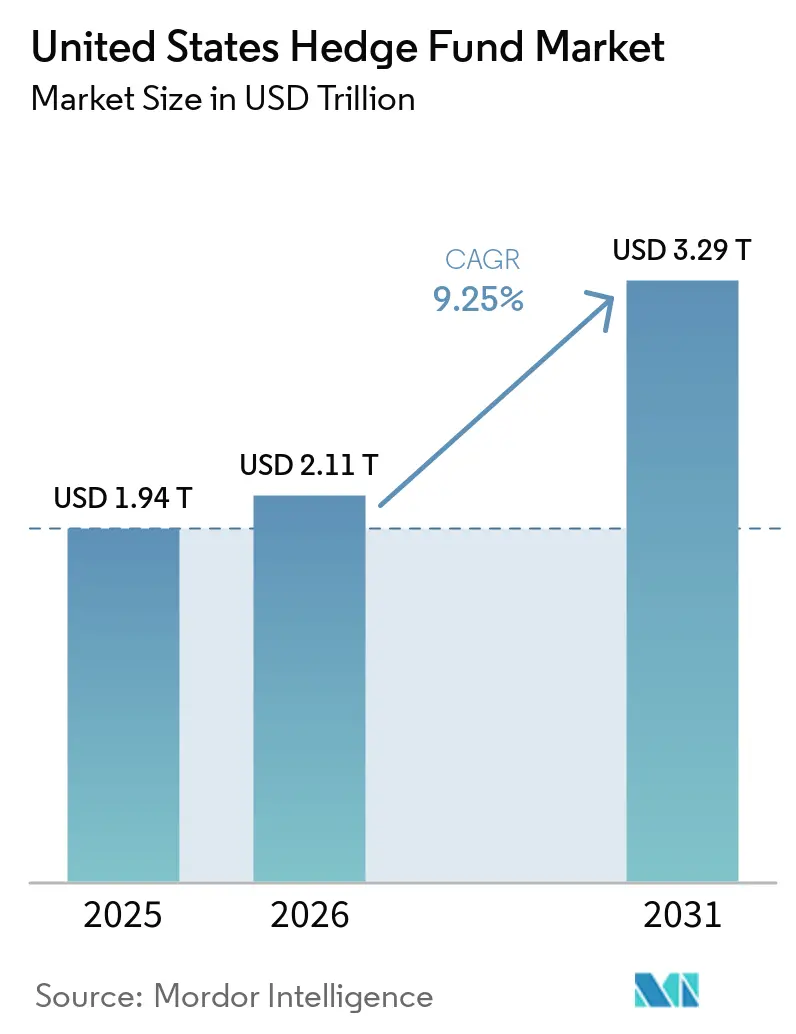
| Base Year Market Size (2025) | USD 1.94 Trillion |
| Market Size (2026) | USD 2.11 Trillion |
| Market Size (2031) | USD 3.29 Trillion |
| Growth Rate (2026 - 2031) | 9.25% CAGR |
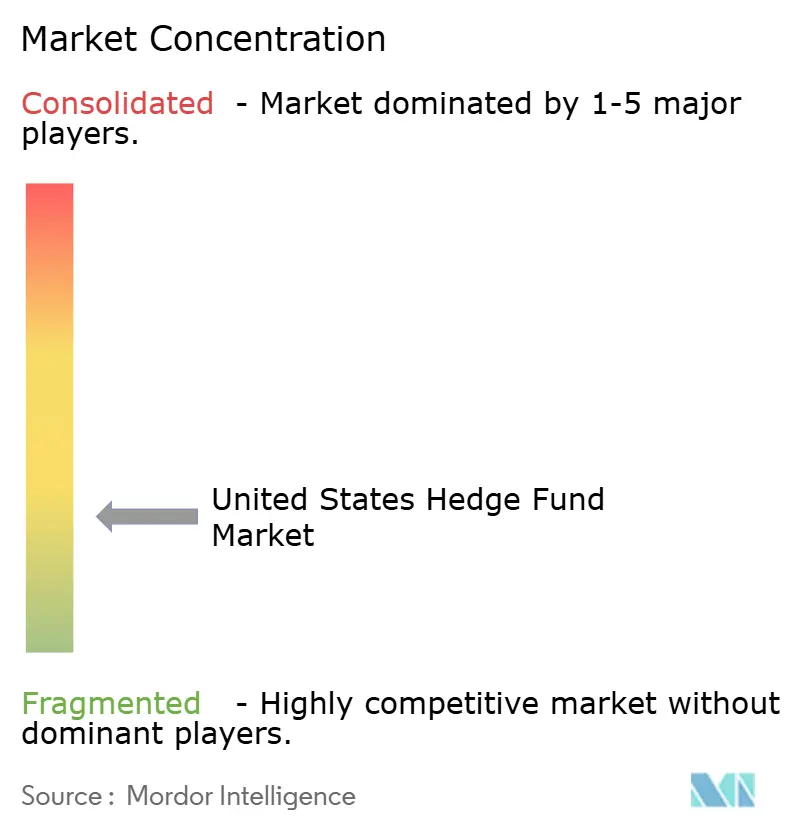
| Market Concentration | Low |
Major Players
*Disclaimer: Major Players sorted in no particular order Image © Mordor Intelligence. Reuse requires attribution under CC BY 4.0. |
|
United States Hedge Fund Market Analysis by Mordor Intelligence
The United States Hedge Fund Market size is expected to grow from USD 1.94 trillion in 2025 to USD 2.11 trillion in 2026 and is forecast to reach USD 3.29 trillion by 2031 at 9.25% CAGR over 2026-2031.
Institutional allocations are rotating back to hedge funds as allocators seek uncorrelated alpha in a regime defined by higher dispersion, normalized volatility, and policy divergence across major central banks. Industry assets surpassed USD 5 trillion in 2025, and net inflows of USD 79 billion marked the strongest deployment since 2015 as average returns of 11.8% outpaced traditional 60/40 portfolios for the fourth straight year. Strategy mix is tilting toward multi-strategy platforms that absorbed a large share of new capital in 2025, while macro and equity long or short managers benefit from cross-asset and single-stock dispersion[1]U.S. Securities and Exchange Commission, “Private Fund Advisers,” U.S. Securities and Exchange Commission, sec.gov. Scale dynamics remain in focus as large funds above USD 5 billion hold 30.7% of assets and smaller managers under USD 1 billion expand faster, supported by separately managed accounts that reduce operational friction for institutions and high-net-worth investors.
Key Report Takeaways
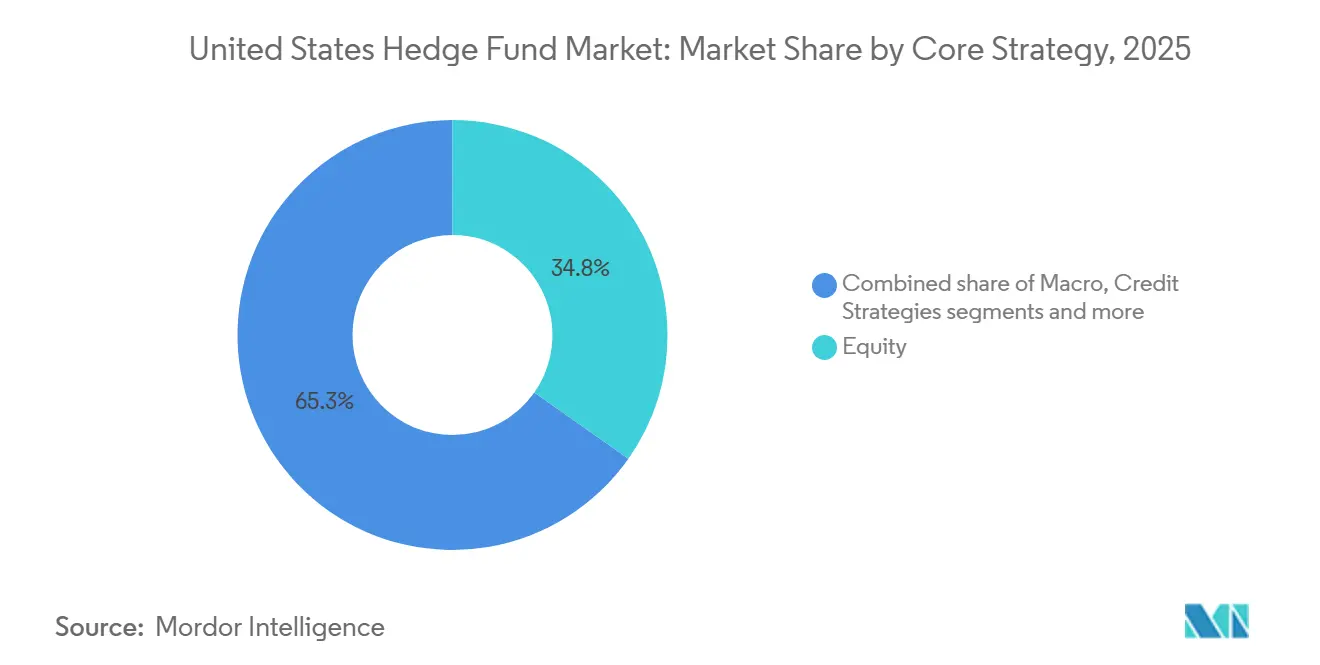
- By core investment strategy, the United States hedge fund market saw equity lead with 34.8% share in 2025, while macro is projected to grow at an 8.8% CAGR through 2031.
- By fund size, the United States hedge fund market had large funds above USD 5 billion holding 30.7% share in 2025, while small funds below USD 1 billion are projected to expand at an 11.8% CAGR through 2031.
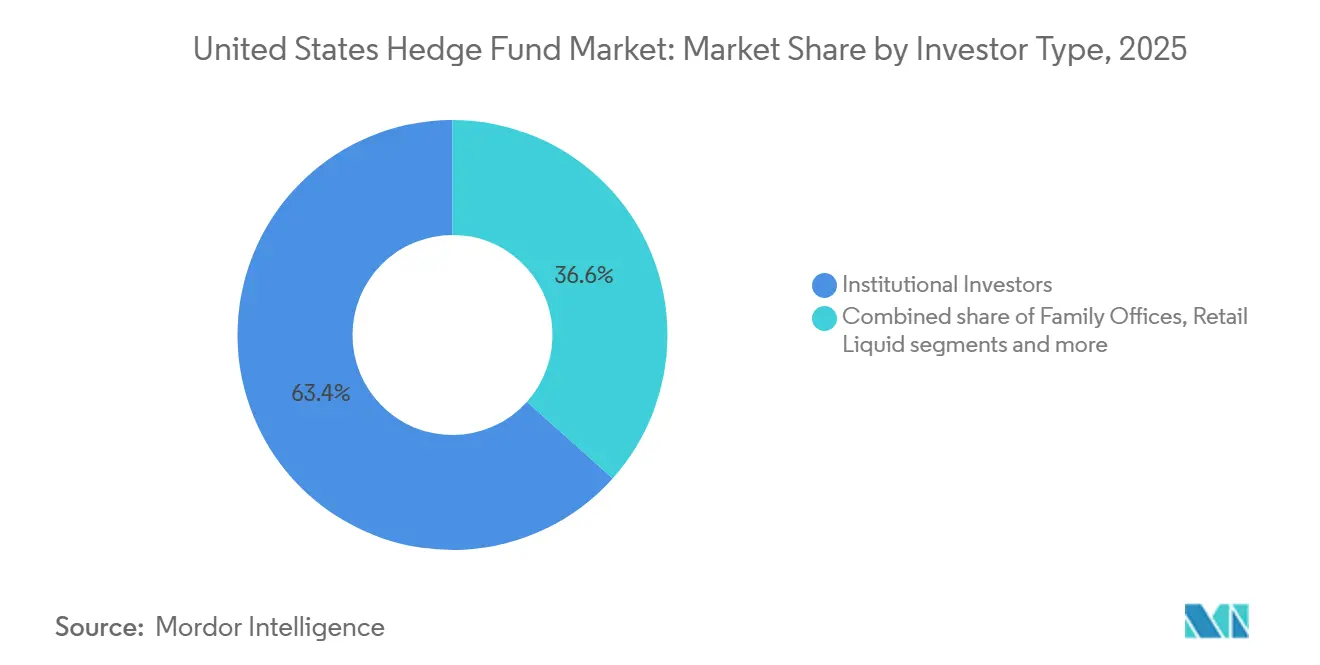
- By investor type, the United States hedge fund market had institutional investors holding a 63.4% share in 2025, while family offices are projected to grow at a 7.9% CAGR through 2031.
- By geography, the United States hedge fund market saw the Northeast account for 49.4% share in 2025, while the South is projected to grow at an 8.5% CAGR through 2031.
Note: Market size and forecast figures in this report are generated using Mordor Intelligence’s proprietary estimation framework, updated with the latest available data and insights as of 2026.
United States Hedge Fund Market Trends and Insights
Drivers Impact Analysis*
| Driver | (~) % Impact on CAGR Forecast | Geographic Relevance | hujn |
|---|---|---|---|
| Institutional appetite for uncorrelated alpha | +1.8% | Global, strongest in United States public pensions and endowments | Medium term (2-4 years) |
| High United States policy-rate spread widens RV trades | +1.2% | United States fixed income markets, secondary in Europe and Asia | Short term (≤ 2 years) |
| Equity micro-sector rotation lifts dispersion | +1.5% | North America with spillover to European and APAC equities | Medium term (2-4 years) |
| SEC private-fund fee transparency rules | +0.9% | United States regulatory compliance frameworks | Long term (≥ 4 years) |
| Crowding and capacity in multi-PM pods | +1.1% | United States multi-manager platforms with secondary impact on European hubs | Medium term (2-4 years) |
| Talent migration to private credit platforms | +0.7% | United States and United Kingdom alternative asset centers with spillover to Asia | Medium term (2-4 years) |
| Source: Mordor Intelligence | |||
Institutional Appetite for Uncorrelated Alpha
Institutional allocators deployed USD 79 billion into hedge funds in 2025 as public pensions and endowments rebalanced toward liquid alpha sources that can diversify equity and duration risk. United States plans, including large state systems, have shown renewed interest in mandates that prioritize risk mitigation and liquid alternatives, consistent with broader asset allocation shifts highlighted in recent institutional surveys[2]State Street, "Driving success in volatile environments", State Street, statestreet.com. In 2025, 63% of United States institutional investors expected active strategies to lead outcomes into 2026 and cited improved hedge fund alpha delivery since 2020 compared with the prior decade. The correlation breakdown between stocks and bonds over a long stretch in 2025 weakened the 60 or 40 construct and raised the role of hedged and market-neutral exposures in the United States hedge fund market. At the same time, 71% of institutions signaled a shift toward a 60 or 20 or 20 allocation that embeds a larger role for alternatives, with hedge funds capturing a meaningful portion of the incremental sleeve.
High United States Policy-Rate Spread Widening RV Trades
The United States policy-rate premium versus peers in 2025 sustained relative value opportunities across fixed income, where managers trade mispricings between Treasury futures and cash markets, as well as cross-currency basis spreads. The Securities and Exchange Commission adopted a Treasury market central clearing mandate that sets cash clearing by December 31, 2026, and repo clearing by June 30, 2027, which will lift aggregate initial margin requirements materially for levered basis trades. Treasury Borrowing Advisory Committee analysis points to a USD 58.4 billion increase in aggregate margin as central clearing scales across cash and repo flows. Cross-margining between FICC and CME could reduce initial margin for offsetting Treasury futures and repo positions by as much as 75% which would preserve capital efficiency for relative value participants if regulators approve and clearinghouses implement by the deadline. In the absence of practical offsets, managers in the United States hedge fund market may reduce basis-trade exposure, which would compress spreads and diminish capacity even as institutional demand for uncorrelated fixed income returns rises[3]Wellington Management, “2026 Hedge Fund Outlook: 3 Reasons Hedge Funds Fit Today’s Market,” Wellington Management, wellington.com.
Dispersion-Friendly Equity Micro-Sector Rotation
Equity dispersion rose to multi-year highs in 2025 as factor and sector rotations created fertile ground for stock pickers and market-neutral approaches that isolate idiosyncratic alpha. Index concentration remained elevated, with the top 10 S&P 500 constituents representing an outsized weight, which sharpened the need to manage factor exposures while harvesting underlying dispersion. Discretionary long or short equity funds delivered strong results in 2025, and market-neutral strategies generated positive alpha as managers exploited micro-sector rotation and valuation gaps. Biotech and select healthcare names experienced extended drawdowns from earlier peaks, yet renewed M&A and pipeline catalysts created event-driven upside that was less dependent on broad index direction. Overseas, Japan’s governance reforms supported a pick-up in corporate actions during 2025, which further diversified global equity long or short opportunity sets for United States-based managers.
SEC Private-Fund Fee-Transparency Rules
Although portions of the 2023 private fund adviser rules faced legal challenges, the SEC carried the policy intent into examinations and enforcement with an emphasis on fee and expense transparency for private fund advisers. In August 2025, the SEC sanctioned a private fund adviser for improper fee allocations and ordered disgorgement and penalties, which underscored that negligent fee practices face liability even without fraudulent intent. The 2026 examination priorities maintain focus on fee calculations, expense allocation, valuation methodologies, and preferential treatment, including side letters, which heighten operational demands for hedge fund compliance programs. Multi-manager platforms also face questions about performance fee mechanics when pod-level gains and losses are offset at the firm level, which raises the risk of fees calculated on gross rather than net exposure. Chief Compliance Officers in the United States hedge fund market are reinforcing independent testing, LP disclosure quality, and LPAC documentation, as examination findings more often convert into enforcement referrals.
Restraints Impact Analysis*
| Restraint | (~) % Impact on CAGR Forecast | Geographic Relevance | Impact Timeline |
|---|---|---|---|
| Rising technology and data-licensing costs | -0.6% | Global, concentrated in quantitative and systematic strategies | Long term (≥ 4 years) |
| Greater Treasury-clearing margin requirements | -0.9% | United States Treasury and repo markets, affecting basis-trade participants | Short term (≤ 2 years) |
| Retail redemption spikes in risk-off shocks | -0.4% | United States and Europe, particularly liquid alternative structures | Short term (≤ 2 years) |
| Compressed equity long or short fee budgets | -0.5% | Global, strongest in United States and European institutional mandates | Medium term (2-4 years) |
| Source: Mordor Intelligence | |||
Rising Technology & Data-Licensing Costs
Escalating alternative data costs and vendor fees increased at a rapid clip during 2023 to 2025 as systematic managers expanded their use of transaction feeds, web data, and geospatial inputs, which intensified budget pressures across the United States hedge fund market. Wider adoption of AI for research, analytics, and workflow automation raised demand for high-performance compute and storage, which can push annual technology spend to large figures for data-intensive platforms. Leading quantitative managers disclosed the breadth of their data estates and model development cycles, which illustrates the infrastructure burden that smaller managers struggle to replicate without scale. Multi-strategy platforms that centralize data acquisition and share costs across pods hold an efficiency edge, which raises competitive hurdles for emerging quant managers. Separately, the SEC has warned against misrepresenting AI capabilities and continues to emphasize fair and accurate disclosures, which adds compliance tasks for managers integrating AI into investment processes[4].
Greater Treasury-Clearing Margin Requirements
The Treasury clearing mandate will bring a large portion of cash and repo activity into central clearing, which the Treasury Borrowing Advisory Committee estimated will raise aggregate initial margin by USD 58.4 billion as daily cleared volumes scale. A levered basis trade that pairs a short Treasury futures position with a repo-financed long in the cash market faces a step-up in collateral needs since the cash leg must carry initial margin once clearing is required. Cross-margining programs between FICC and CME could cut combined margins materially for offsetting positions which would restore capital efficiency if the SEC and CFTC grant approvals and clearinghouses implement operational linkages by the end of 2026. If cross-margining is delayed or limited, many relative value participants in the United States hedge fund market will trim exposures which would compress spreads, reduce strategy capacity, and weigh on Treasury market liquidity. Deadlines and design choices will shape how much relative value capacity persists which is a key determinant of fixed income alpha streams in 2026.
*Our forecasts treat driver/restraint impacts as directional, not additive. The impact forecasts reflect baseline growth, mix effects, and variable interactions.
Segment Analysis
By Core Investment Strategy: Multi-Strategy Funds Capture Institutional Mandate Shift
Equity strategies commanded 34.8% of the United States hedge fund market share in 2024, and macro strategies are on track to grow at an 8.8% CAGR through 2030 as allocators prize uncorrelated return streams when policy paths diverge. Multi-strategy platforms that combine equity, credit, and macro pods within centralized risk management frameworks attracted a significant portion of 2025 net inflows, which validated the appeal of liquidity, capacity, and consistent risk-adjusted returns during higher dispersion. These platforms benefit from shared infrastructure, centralized data procurement, and flexible capital allocation that allows managers to route risk to the most attractive opportunity sets across styles and asset classes. Event-driven teams continued to benefit from an active M&A calendar where changing antitrust signals widened merger spreads for specialists who run diversified risk books. In credit, tight spreads kept managers selective and shifted focus to structured and niche segments where dispersion remains elevated and idiosyncratic catalysts drive payoffs.
Macro funds capitalized on relative value in rates and currencies as well as policy divergence across the United States, Europe, and Japan, while equity long or short managers leaned into single-stock dispersion and factor rotation. Convertible arbitrage and volatility strategies preserved positive convexity in 2025 even as some fixed income arbitrage books contended with rapid rate repricing and evolving collateral rules. Within the United States hedge fund market, multi-strategy platforms continue to re-weight capital dynamically to higher Sharpe sleeves while protecting drawdown budgets through firm-level risk limits. Niche strategies, including commodities and insurance-linked securities, served as useful diversifiers in 2025 and gave allocators additional levers to manage correlation when rates or equities experienced stress.


By Fund Size: Small Funds Leverage SMA Structures to Capture Emerging Manager Premium
Large funds above USD 5 billion controlled 30.7% of assets in 2025 while small funds under USD 1 billion are expanding at an 11.8% CAGR as institutions broaden mandates to capture nimble alpha in the United States hedge fund market. The United States hedge fund market size for small funds is set to compound faster as separately managed accounts gain traction among pensions, endowments, and family offices that prefer better transparency, customization, and governance controls. SMA structures help new managers scale by leveraging institutional operational infrastructure without the time and capital intensity of traditional commingled vehicles, which shortens the path from incubation to meaningful capacity. Mid-sized funds between USD 1 billion and USD 5 billion hold a strategic middle ground with sufficient heft to access large allocators yet enough agility to avoid capacity constraints that can weigh on the largest platforms. In 2025, allocators showed increasing willingness to balance commitments across mega platforms and focused emerging managers to diversify model risk and reduce exposure to crowded factors.
Cost structure and data intensity favor scaled managers, which makes distribution and prime brokerage relationships critical for smaller firms seeking to offset fixed technology costs that rise with alternative data and AI workflows. SMAs mitigate some of these hurdles by standardizing reporting and risk analytics for institutional LPs while enabling tighter liquidity and fee alignment than legacy commingled funds. As the United States hedge fund market evolves, we see small and mid-sized managers emphasize differentiated process, targeted capacity, and clear risk budgets to preserve edge while scaling thoughtfully. These positioning choices support a broader allocator shift toward portfolios that combine resilient multi-strategy platforms with specialists that exploit persistent inefficiencies.
By Investor Type: Family Offices Double Hedge Fund Allocations on Inflation Fears
Institutional investors held 63.4% of the United States hedge fund capital in 2025 while family offices are the fastest-growing allocator cohort at a 7.9% CAGR as they seek inflation protection and dynamic downside management within the United States hedge fund market. Family offices that prioritize inflation hedging allocated 9.4% to hedge funds within broader alternatives weightings near 60% based on a 2026 survey that covered hundreds of offices globally. A majority of global institutions expect market turbulence in 2026 and favor frameworks that add an alternatives sleeve to the traditional 60 or 40 model, which further supports net inflows into the United States hedge fund market. The United States hedge fund market size is also poised to benefit from the gradual expansion of interval funds, CITs, and other vehicles that embed institutional safeguards in products designed for qualified wealth channels. High net worth investors, who represented a meaningful share of capital in 2025, increasingly access managers through SMAs and feeder structures that can tailor liquidity and reporting preferences.
Risk concerns cited by family offices include geopolitics, AI-driven valuation risk, and the possibility of re-acceleration in inflation, which collectively improve the case for hedged and market-neutral sleeves that can respond faster to macro or regime changes. Many offices maintain limited or zero exposure to gold and crypto, which raises the role of active risk management to protect wealth during drawdowns. In this context, the United States hedge fund market offers a mix of discretionary, quantitative, and multi-strategy approaches that can align with family office goals for capital preservation, tax efficiency, and liquidity. Institutions and advisors are also using SMAs to improve fee and governance alignment across mandates, which can help sustain the growing family office segment over the forecast period.
Geography Analysis
The Northeast commands 49.4% of assets in 2025, a concentration anchored by New York and Connecticut that reflects proximity to capital markets infrastructure, deep talent pools, and well-established compliance ecosystems within the United States hedge fund market. New York remains a hub for global multi-asset managers and systematic platforms, with leading firms maintaining major offices to access institutional allocators, prime brokerage networks, and technology partners. Connecticut houses several of the world’s largest hedge funds, including Bridgewater Associates, and has built a high-wage finance cluster that pays far above the state median which underpins its durable position in the regional hierarchy. This agglomeration effect continues to draw service providers and specialized talent which sustains network advantages for incumbent firms in the Northeast.
The West maintains a meaningful footprint led by California managers that sit close to venture and private equity ecosystems which enrich cross-asset research and deal flow. Technology-oriented strategies and data science talent pools in the Bay Area support quantitative and hybrid approaches that benefit from proximity to enterprise AI innovation. The Midwest accounted for 9% of assets in 2025 and leverages Chicago’s derivatives exchanges and risk management culture to support systematic and relative value strategies. While capital and talent still flow to coastal hubs, the region’s specialized strengths in rates, volatility, and futures make it a durable contributor to the United States hedge fund market.
The South is the fastest-growing region at an 8.5% CAGR as managers expand in Florida and Texas to optimize tax outcomes, cost bases, and access to a growing local allocator ecosystem. Miami and West Palm Beach have attracted multi-asset and multi-strategy firms that value flexible infrastructure and favorable business climates while Austin and Dallas gained traction with systematic managers seeking engineering talent and lower operating costs. Even as this dispersion continues, network effects keep the largest share of assets and platforms in the Northeast which means the United States hedge fund market retains a dual-center structure with a growing southern corridor. Over the forecast period, relative cost advantages and a broadening allocator base in the South will likely sustain its faster growth path while the Northeast remains the center of gravity for institutional mandates.
Competitive Landscape
The competitive field balances influential multi-strategy platforms with a long tail of specialists across equity, macro, credit, relative value, and niche sleeves which supports a diverse opportunity set in the United States hedge fund market. Multi-strategy firms differentiate on risk-adjusted returns and liquidity frameworks, while specialized managers emphasize convexity, sector knowledge, and lower correlation to equities and bonds. Systematic franchises and discretionary shops converge on the use of machine learning and alternative data, which compresses alpha cycles and places a premium on research velocity and data governance. Thought leadership from leading firms highlights the risks of index concentration which encourages hedged portfolios that harvest dispersion and manage factor exposures.
Company actions in 2025 and 2026 illustrate evolving playbooks in the United States hedge fund industry. Pershing Square raised unsecured debt in October 2025 and extended its average maturity at a competitive cost of capital which supports flexible capital deployment for concentrated positions. In 2025 and 2026, Pershing Square also disclosed material public equity positions and provided updates through regulatory filings which reflected a continued focus on high conviction technology and consumer names. Leading multi-asset platforms continued to invest in technology and data while returning capital selectively to optimize capacity and maintain targeted risk budgets which underscores disciplined growth models in the current environment.
Infrastructure change is another competitive vector that will influence strategy capacity and execution quality. The SEC’s Treasury clearing mandate and the potential for cross-margining between FICC and CME will shape how relative value capital is deployed across futures and cash which has implications for managers’ returns and market liquidity through 2026. In parallel, the SEC’s emphasis on fee transparency and preferential treatment policies is shifting compliance investments toward stronger controls and documentation which favors managers with robust infrastructure. As these forces play out, the United States hedge fund market continues to reward platforms that combine durable infrastructure, research depth, and adaptive capital allocation.
United States Hedge Fund Industry Leaders
-
Bridgewater Associates
-
Citadel LLC
-
Millennium Management
-
Renaissance Technologies
-
DE Shaw & Co.
- *Disclaimer: Major Players sorted in no particular order

Recent Industry Developments
- February 2026: Pershing Square Capital Management issued USD 500 million in 5.5% seven-year unsecured bonds due 2032, following an April 2025 issuance of EUR 650 million at 4.3% due 2030, extending its weighted average debt maturity to six years at a 3.6% cost of capital.
- December 2025: Citadel LLC, the most profitable hedge fund of all time with USD 66 billion in capital as of February 1, achieved this milestone after returning nearly USD 5 billion to investors in early 2026, reinforcing its position as the industry's performance leader.
- December 2025: Howard Hughes Holdings, Inc. signed a definitive agreement to acquire Vantage Group Holdings Ltd., a specialty insurance and reinsurance company, for approximately USD 2.1 billion in cash, with Pershing Square committing up to USD 1 billion in non-voting exchangeable preferred stock to finance the transaction, expected to close in Q2 2026.
- May 2025: Pershing Square HoldCo, L.P. invested USD 900 million to purchase 9 million newly issued Howard Hughes Holdings shares at USD 100 per share, increasing Pershing Square's collective ownership to 46.9% and transforming HHH into a diversified holding company, with Bill Ackman rejoining as Executive Chairman.


United States Hedge Fund Market Report Scope
Investment funds pooled and traded reasonably liquid assets are known as hedge funds. They can employ a variety of sophisticated trading, portfolio creation, and risk management strategies, including leverage, derivatives, and short selling, to increase returns. The market's background is thoroughly examined, covering industry trends, growth factors, market shares, market size and forecast, and suppliers. The research also includes qualitative and quantitative evaluations based on an analysis of data collected from market participants and industry analysts at significant stages in the industry's value chain. The United States hedge fund market is segmented based on core investment strategies, which include equity, macro, event-driven, credit, relative value, niche, and multi-strategy, as well as managed futures/CTA strategies. The report offers market sizes and forecasts for the hedge fund market in the United States in terms of revenue (USD) for all the above segments.
| Equity Strategies |
| Macro Strategies |
| Event-driven Strategies |
| Credit Strategies |
| Relative Value Strategies |
| Niche Strategies |
| Multi-strategy |
| Others |
| Large (>USD 5 billion) |
| Medium (USD 1-5 billion) |
| Small (<USD 1 billion) |
| Institutional Investors |
| Family Offices |
| High-Net-Worth Individuals |
| Retail Liquid Alternatives |
| Northeast |
| Midwest |
| South |
| West |
| By Core Investment Strategy | Equity Strategies |
| Macro Strategies | |
| Event-driven Strategies | |
| Credit Strategies | |
| Relative Value Strategies | |
| Niche Strategies | |
| Multi-strategy | |
| Others | |
| By Fund Size | Large (>USD 5 billion) |
| Medium (USD 1-5 billion) | |
| Small (<USD 1 billion) | |
| By Investor Type | Institutional Investors |
| Family Offices | |
| High-Net-Worth Individuals | |
| Retail Liquid Alternatives | |
| By Geography | Northeast |
| Midwest | |
| South | |
| West |


Key Questions Answered in the Report
What is the current size and 5-year growth outlook for the United States hedge fund market?
The United States hedge fund market size is USD 2.1 trillion in 2026 and is projected to reach USD 3.3 trillion by 2031 at a 9.3% CAGR.
Which strategies led and which are growing fastest in the United States hedge fund landscape?
Equity strategies led with 34.8% share in 2024 while macro strategies are projected to grow at an 8.8% CAGR through 2031.
How are allocator segments positioned in United States hedge funds for 2026?
Institutional investors held 63.4% of capital in 2025 while family offices are projected to grow allocations at a 7.9% CAGR and allocate 9.4% among those prioritizing inflation hedges.
Where are assets concentrated across regions in the United States hedge fund ecosystem?
The Northeast held 49.4% of assets in 2025 while the South is projected to post the fastest growth at an 8.5% CAGR through 2031.
What recent flow and return signals support renewed demand for United States hedge funds?
Net inflows reached USD 79 billion in 2025, the strongest since 2015, and average returns of 11.8% exceeded 60/40 portfolios for the fourth consecutive year.
How could the U.S. Treasury clearing mandate affect hedge fund relative value strategies in 2026?
Central clearing deadlines for cash by December 31, 2026 and repo by June 30, 2027 are set to raise aggregate initial margin by USD 58.4 billion, with potential relief if FICC and CME cross-margining is approved and implemented.
Page last updated on:


