Market Overview
| Study Period | 2020 - 2031 |
|---|---|
| Forecast Data Period | 2026 - 2031 |
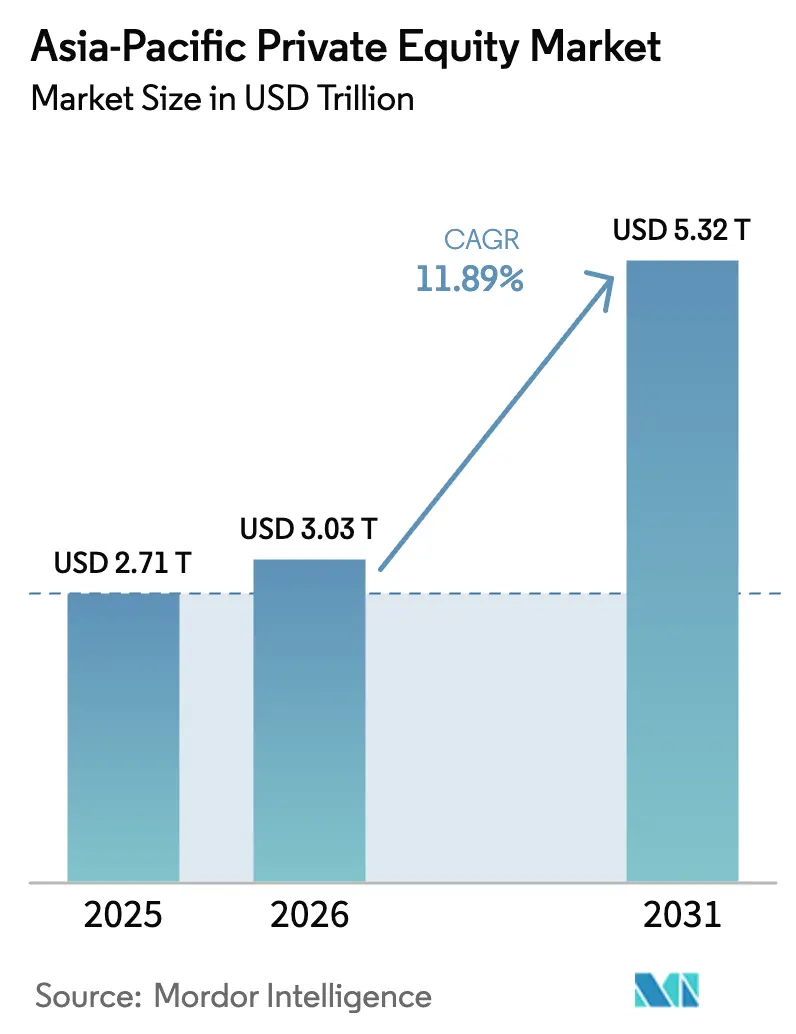
| Base Year Market Size (2025) | USD 2.71 Trillion |
| Market Size (2026) | USD 3.03 Trillion |
| Market Size (2031) | USD 5.32 Trillion |
| Growth Rate (2026 - 2031) | 11.89% CAGR |
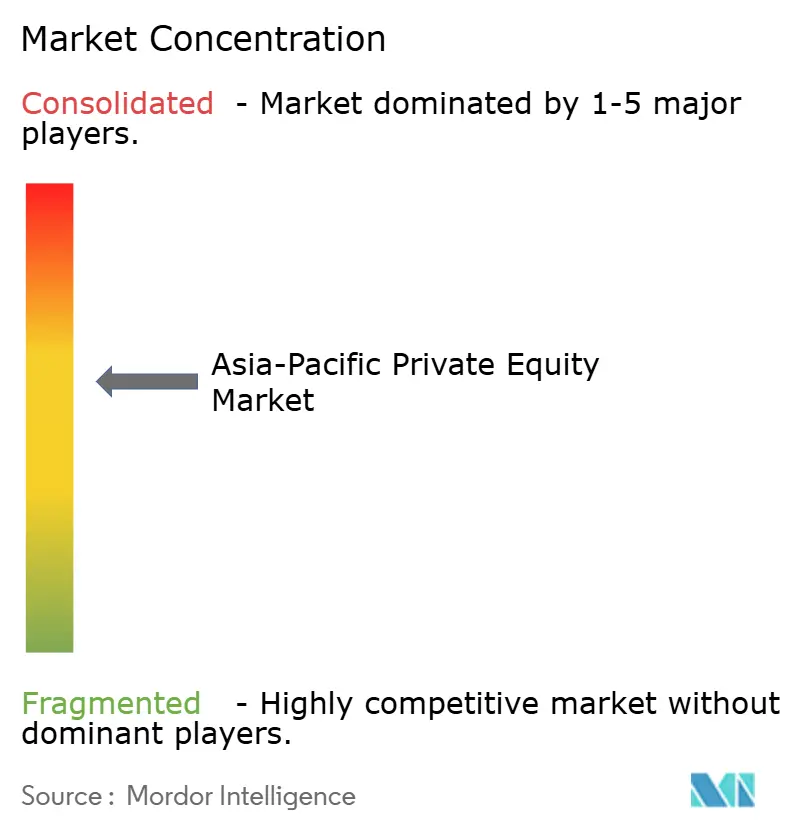
| Market Concentration | Medium |
Major Players *Disclaimer: Major Players sorted in no particular order Image © Mordor Intelligence. Reuse requires attribution under CC BY 4.0. | |
Asia-Pacific Private Equity Market Analysis by Mordor Intelligence
The Asia-Pacific Private Equity Market size is expected to grow from USD 2.71 trillion in 2025 to USD 3.03 trillion in 2026 and is forecast to reach USD 5.32 trillion by 2031 at 11.89% CAGR over 2026-2031.
The region has become a priority destination for global institutional capital as investors rebalance exposure away from slower-growing developed economies. Large sovereign wealth and pension investors continue to amplify deal sizes, while a widening bank-funding gap lifts direct-lending volumes. Geopolitical realignment is prompting sponsors to diversify holdings beyond mainland China into India, Japan, and selected ASEAN economies. Meanwhile, digitalisation, ageing demographics, and energy transition are expanding thematic deal pipelines across technology, healthcare, and infrastructure sectors, supporting long-term growth prospects within the Asia-Pacific private equity market.
Key Report Takeaways
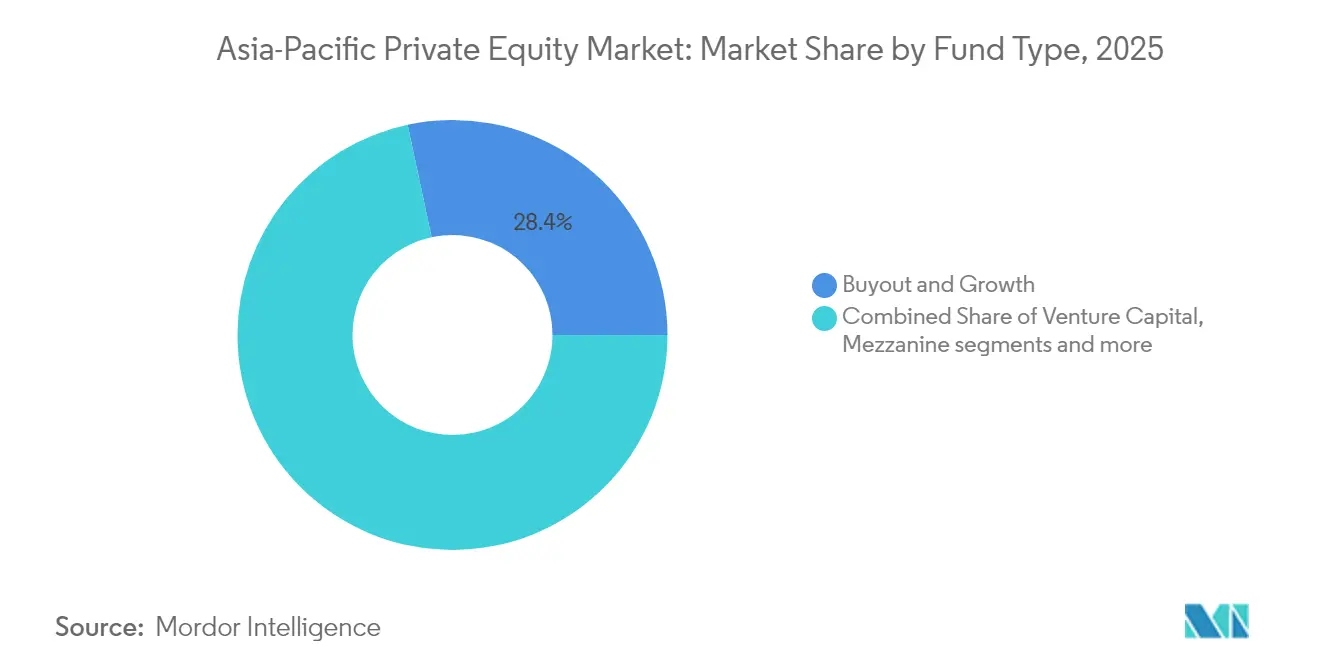
- By fund type, buyout & growth retained 28.35% revenue share in 2025; venture capital is set to accelerate at 13.97% CAGR during 2026-2031.
- By sector, technology captured 12.05% of 2025 deal value, while healthcare is poised to grow fastest at 17.92% CAGR over the forecast period.
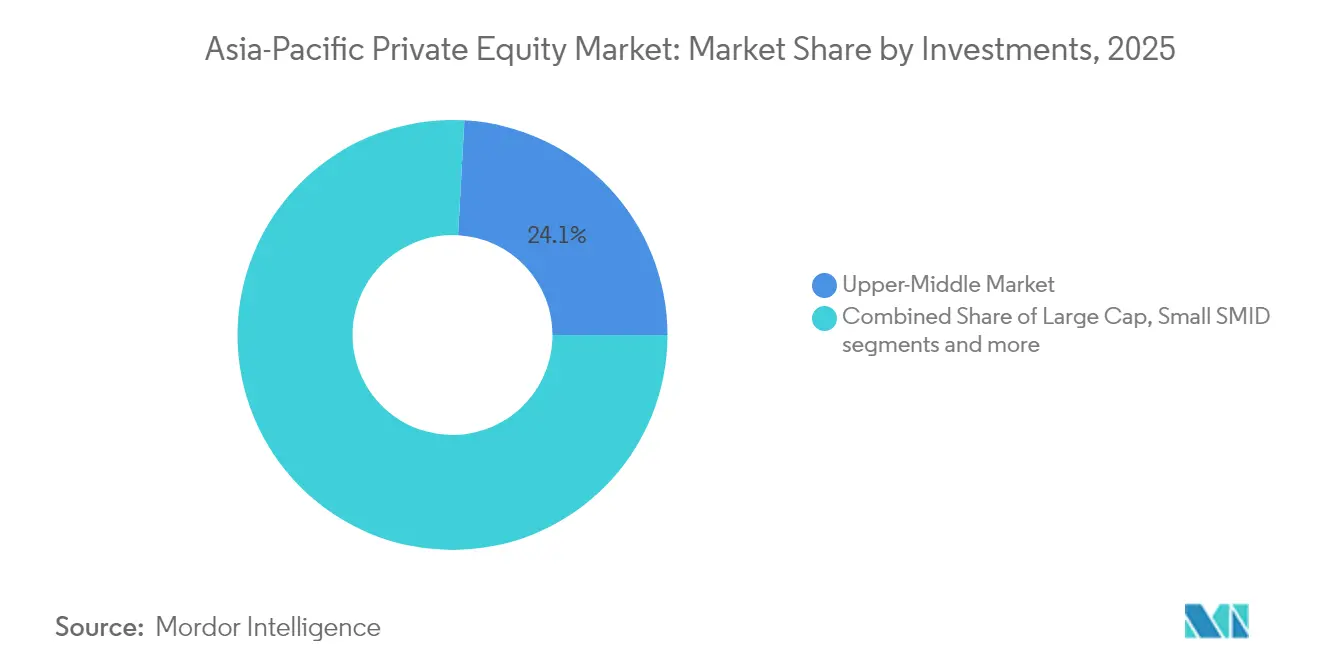
- By investment size, upper middle market transactions accounted for 24.12% of the Asia-Pacific private equity market size in 2025; small & SMID deals are forecast to expand at 12.05% CAGR.
- By geography, China led with 22.86% of the Asia-Pacific private equity market share in 2025, whereas India is projected to compound at 13.38% through 2031.
Note: Market size and forecast figures in this report are generated using Mordor Intelligence’s proprietary estimation framework, updated with the latest available data and insights as of 2026.
Asia-Pacific Private Equity Market Trends and Insights
Drivers Impact Analysis*
| Driver | ( ~ ) % Impact on CAGR Forecast | Geographic Relevance | Impact Timeline |
|---|---|---|---|
| Record dry-powder levels from sovereign and pension LPs | +2.1% | Singapore, Australia, Japan | Medium term (2-4 years) |
| Succession-driven corporate carve-outs | +1.8% | Japan, South Korea | Short term (≤2 years) |
| Rapid growth of private-credit transactions | +2.3% | Singapore, Hong Kong, Australia | Medium term (2-4 years) |
| Digital-native mid-market platforms | +1.5% | ASEAN-6 and India | Long term (≥4 years) |
| Regulatory liberalization of foreign ownership caps | +1.2% | Vietnam, Thailand, Philippines, with gradual ASEAN adoption | Medium term (2-4 years) |
| Net-zero infrastructure push (renewables, EV supply chains) | +1.7% | Global, with early gains in China, India, Australia | Long term (≥ 4 years) |
| Source: Mordor Intelligence | |||
Record Dry-Powder Deployment Transforms Capital Allocation
Sovereign wealth and pension investors hold roughly 34% of global sovereign assets and lifted private-market allocations by 10% annually during the past decade. The pool of undeployed capital has pushed deal tickets higher, with Asia-Pacific sovereign funds alone steering USD 79.4 billion into private-equity deals in 2023. Gulf investors joined Singapore’s GIC in multi-billion-dollar co-investments, confirming a trend toward fee-saving, governance-rich structures. Deployment, however, is now more selective as Singapore state entities trimmed aggregate commitments by more than 50% in 2023 while Gulf peers accelerated exposure in technology and infrastructure assets. The new capital mix is compressing entry yields but simultaneously deepening the liquidity stack available to general partners. Overall, ample dry-powder continues to anchor bid momentum across the Asia-Pacific private equity market.
Japan–Korea Succession Crisis Accelerates Corporate Restructuring
Ageing ownership profiles and governance reform have propelled Japanese companies to divest USD 56 billion in non-core units since 2022, the highest cumulative value since the global financial crisis. Carve-outs now represent 12.6% of Asia-Pacific buyouts, up from 5.7% just three years ago, signalling a structural rather than cyclical shift. The USD 15 billion Toshiba take-private illustrates sponsor appetite for complex, multi-business restructurings, while Carlyle’s USD 3 billion Japan-focused vehicle underscores long-duration commitment to the theme. South Korean chaebols face parallel demographic pressures, spurring cross-border M&A that allows regional PE houses to consolidate industrial supply chains. Dedicated on-the-ground teams give global firms execution speed and cultural fluency, translating into competitive advantages in bilateral negotiations. These factors together lift the short-term growth contribution embedded in the Asia-Pacific private equity market.
Private Credit Surge Fills Traditional Banking Void
Private-credit assets exceeded USD 1.2 trillion worldwide, and Asia-Pacific logged the swiftest regional rise as bank regulatory capital rules curbed syndicated lending. Alternative lenders are pivoting toward Hong Kong property refinancing and Australia’s infrastructure backlog, areas where commercial-bank risk limits have tightened most. Infrastructure alone needs USD 26 trillion by 2030, turning direct-lending strategies into critical enablers of project completion timetables. Direct loans to sponsor-backed companies form the core allocation, offering floating-rate coupons that hedge duration risk in a rising-rate cycle. Investor demand is robust; 25–50% of European allocators now layer leverage on direct-lending portfolios and report interest in replicating the model across Asia. The resulting financing flexibility strengthens deal-execution certainty and supports valuation resilience across the Asia-Pacific private equity market[1]Scott Murdoch, “Asia Private Credit Poised for Expansion as Banks Retreat,” Reuters, reuters.com.
Digital Platform Proliferation Drives Mid-Market Innovation
Fintech funding in ASEAN jumped from under USD 600 million in 2015 to USD 6.4 billion in 2024, a tenfold surge that resisted global venture pullbacks. Early-stage rounds absorb more than 60% of inflows, reflecting deep white space in digital payments, neobanking and embedded-finance verticals. Landmark raises include Kredivo’s USD 270 million Series D and Ascend Money’s USD 195 million expansion, both underpinned by underbanked consumer bases. Investors are also bridging the “missing middle” by injecting growth equity into scale-ups such as Validus, supported by 01Fintech’s USD 20 million cheque for regional SME lending. Convergence of artificial intelligence, blockchain and quantum-secure protocols widens total-addressable markets and diversifies monetisation paths. This technology flywheel amplifies long-term upside built into the Asia-Pacific private equity market.
Restraints Impact Analysis*
| Restraint | (~) % Impact on CAGR Forecast | Geographic Relevance | Impact Timeline |
|---|---|---|---|
| US–China geopolitical bifurcation | -1.9% | Greater China and outbound corridors | Long term (≥4 years) |
| Muted IPO windows elongating holding periods | -1.4% | Core Asia-Pacific | Medium term (2-4 years) |
| FX volatility & rate divergence eroding | -1.1% | Asia-Pacific | Short term (≤ 2 years) |
| ESG-driven DD delays & green-washing litigation risk | -0.8% | stricter enforcement in Australia, Singapore | Medium term (2-4 years) |
| Source: Mordor Intelligence | |||
Geopolitical Bifurcation Fragments Cross-Border Capital Flows
Roughly USD 1.5 trillion of Chinese assets remain locked inside older PE vintages, with secondary buyers requesting discounts above 60% versus 15% in the United States and Europe. Leading global franchises executed only five new onshore China deals in 2024 after completing 30 in 2021, while Sequoia split into three regional brands to ring-fence regulatory exposure. CFIUS has expanded filing mandates, adding diligence costs and potentially civil penalties for non-compliance, thereby raising friction for cross-border LP funding. Chinese LPs are reshuffling Western fund stakes, evidenced by the USD 1 billion secondary sale plan tabled by China Investment Corporation. The cumulative effect is a liquidity logjam that redirects sponsor focus toward India, Japan and Southeast Asia. This fragmentation dilutes historical return correlations but subtracts near-term growth impulse from the Asia-Pacific private equity market.
Extended Holding Periods Compress Investment Returns
Distribution rates throughout Asia-Pacific venture funds sit at multi-year lows, prompting managers to hold assets beyond customary five-year cycles. IPO markets remain inconsistent: Vietnam’s VNG withdrew its US listing, and several Southeast Asian platforms postponed flotations amid valuation mismatches. Strategic buyers, however, are re-entering healthcare and telecom segments, selectively filling the exit gap with corporate takeovers. In response, GPs deploy continuation vehicles and preferred-equity tranches to generate interim liquidity for investors. These mechanics protect internal rates of return but elevate fund-level complexity and governance costs. Consequently, prolonged holding periods shave 140 basis points from projected Asia-Pacific private equity market CAGR across the medium term.
*Our forecasts treat driver/restraint impacts as directional, not additive. The impact forecasts reflect baseline growth, mix effects, and variable interactions.
Segment Analysis
By Fund Type: Venture Capital Momentum Challenges Buyout Dominance
Buyout & Growth strategies retained 28.35% of the Asia-Pacific private equity market share in 2025, anchored by large-ticket transactions like the USD 7.11 billion ESR take-private. The segment benefits from stronger governance control and the ability to drive operational turnarounds. Venture Capital, however, is forecast to advance at a 13.97% CAGR between 2026 and 2031 as digital adoption accelerates in ASEAN and South Asia. This growth pulls increasing allocations from family offices and global university endowments seeking early-stage technology positions, reinforcing the Asia-Pacific private equity market as an innovation gateway.
The Asia-Pacific private equity market size attributed to Venture Capital deals is projected to expand rapidly, whereas Mezzanine & Distressed strategies profit from corporate deleveraging in Japan and Korea, where ageing owners pursue liquidity solutions. Secondaries and Fund-of-Funds managers are scaling regional platforms as limited partners demand portfolio rebalancing and interim liquidity. The broader Asia-Pacific private equity industry is also witnessing rising hybrid strategies that blend minority equity stakes with private credit tranches to optimise risk-adjusted returns.


By Sector: Healthcare Innovation Outpaces Technology Maturation
Technology transactions held 12.05% of 2025 activity but face valuation normalisation as artificial-intelligence exuberance cools. Even so, data-centre infrastructure and enterprise software continue to underpin recurring-revenue plays valuable to the Asia-Pacific private equity market. Healthcare investments are forecast to expand at 17.92% CAGR through 2031, spurred by ageing populations, rising chronic disease prevalence, and policy-driven capacity upgrades in Japan, South Korea, and Singapore.
The Asia-Pacific private equity market size for Healthcare assets is set to climb sharply as sponsors pursue hospital chains, contract research organisations, and tele-medicine platforms delivering stable margins. Real Estate strategies overlap as data-centre demand lifts land values, while Financial Services deals concentrate on payments and embedded-finance solutions. Industrials attract energy-transition funding into battery supply chains and renewable infrastructure, shaping a diversified opportunity map within the Asia-Pacific private equity industry.
By Investments: Small-Cap Opportunities Challenge Mid-Market Dominance
Upper Middle Market deals commanded 24.12% of the Asia-Pacific private equity market size during 2025 on the back of corporate carve-outs and regional platform roll-ups. Yet Small & SMID transactions are forecast to rise 12.05% yearly through 2031 as digital disruption lowers entry barriers and niche sector specialists scale regionally. Sponsors leverage operational toolkits and talent bench-strength to professionalise family-run companies and unlock cross-border synergies.
Large-Cap headline transactions will remain newsworthy, but increasing capital efficiency and competition are steering many investors into lower-mid-market ecosystems with higher growth headroom. Private-credit funds supplement equity with senior secured debt structures, mitigating dilution for founders and smoothing syndication risk. These dynamics keep the Asia-Pacific private equity market vibrant across the size spectrum and sustain a diversified exit funnel.
Geography Analysis
China’s exit challenges encompass trapped valuations exceeding USD 1.5 trillion, with secondary markdowns above 60%. Despite headwinds, demographic shifts maintain momentum in healthcare and consumer upgrades. Parallel supply-chain relocation offers scope for manufacturing and semiconductor assets seeking capital for international expansion.
India has become the prime beneficiary of rotating capital, booking USD 71 billion in foreign direct investment during 2024. Liberalised sectoral caps and deep domestic capital markets underpin a resilient exit path, as evidenced by improving realisation multiples in domestic IPOs. A rich pipeline of consumer-tech, renewables, and fintech businesses sustains a double-digit growth trajectory for the Asia-Pacific private equity market.
Japan’s record deal surge stems from governance reforms, while Australia attracts pension and insurance capital into long-duration infrastructure debt. Southeast Asian nations broaden opportunity sets by easing foreign-ownership ceilings, especially in critical telecom and digital-banking verticals. Collectively, the geographic mosaic provides diversification benefits to global allocators tracking the Asia-Pacific private equity market.
Competitive Landscape
The Asia-Pacific private equity market hosts a dual structure in which global mega-funds compete for billion-dollar corporate carve-outs, while regional specialists chase mid-market and growth narratives. Operational value-creation levers—digital acceleration, procurement optimisation, and ESG compliance—are prioritised as rising rates dilute leverage arbitrage. Artificial intelligence tools for deal sourcing and portfolio monitoring are becoming standard, differentiating firms that integrate advanced analytics.
Strategic positioning features growing collaboration between private equity sponsors and single-family offices aiming for co-control stakes and longer hold periods. Capital formation remains robust: EQT secured more than USD 10 billion for its latest Asia vehicle and targets USD 14.5 billion at final close, while Carlyle committed USD 3 billion exclusively to Japan carve-outs[3]Arjun Kharpal, “Carlyle Deepens Japan Push with New Fund,” CNBC, cnbc.com. Emerging managers in private credit are stepping in where banks retrench, with JPMorgan anticipating substantial expansion in Asia-Pacific direct lending.
Regulatory oversight is tightening; antitrust reviews and foreign-investment screenings have lengthened closing timelines, prompting contingency clauses in sale-and-purchase agreements. Nonetheless, pipeline visibility remains strong as conglomerates divest non-core operations and founders seek institutional partners. The combination of liquidity, structural reforms and sectoral megatrends reinforces the competitive vitality of the Asia-Pacific private equity market.
Asia-Pacific Private Equity Industry Leaders
KKR
Carlyle
Blackstone
Bain Capital
CVC Capital Partners
- *Disclaimer: Major Players sorted in no particular order

Recent Industry Developments
- June 2025: KKR and Brookfield head the bidding for Macquarie’s USD 3.6 billion DIG Airgas exit, underscoring demand for large-scale infrastructure assets across Asia-Pacific.
- June 2025: Bain-backed Virgin Australia returns to public markets via a USD 1.7 billion IPO, signaling improving exit conditions for sponsor-owned companies
- May 2025: Carlyle closes a USD 3 billion Japan-focused fund and enlarges its Tokyo office to exploit succession-driven transactions.
- May 2025: Warburg Pincus pursues a USD 2.4 billion offer for Fonterra’s consumer unit, demonstrating sustained interest in branded food assets.


Research Methodology Framework and Report Scope
Market Definitions and Key Coverage
Our study defines the Asia-Pacific private equity market as the total value of active funds that pool capital from institutional and qualified individual investors to acquire controlling or significant stakes in unlisted or soon-to-be-delisted companies across China, India, Japan, South Korea, Australia, Southeast Asia, and the region's smaller economies. Value is expressed in USD and reflects assets under management plus unspent commitments, which together drive fee income, investment capacity, and exit proceeds throughout the forecast window, 2019-2030.
Scope exclusion: Passive minority stakes made directly by corporations or sovereign entities without a formal fund structure are not covered.
Segmentation Overview
- By Fund Type
- Buyout & Growth
- Venture Capital
- Mezzanine & Distressed
- Secondaries & Fund of Funds
- By Sector
- Technology (Software)
- Healthcare
- Real Estate and Services
- Financial Services
- Industrials
- Consumer & Retail
- Energy & Power
- Media & Entertainment
- Telecom
- Others (Transportation, etc.)
- By Investments
- Large Cap
- Upper Middle Market
- Lower Middle Market
- Small & SMID
- By Geography
- India
- China
- Japan
- Australia
- South Korea
- South East Asia (Singapore, Malaysia, Thailand, Indonesia, Vietnam, and Philippines)
- Rest of Asia-Pacific
Detailed Research Methodology and Data Validation
Primary Research
Mordor analysts complemented desk work with structured interviews and e-mail surveys of general partners, placement agents, family-office allocators, and corporate-finance advisers spread across Tokyo, Singapore, Mumbai, and Sydney. Insights on dry-powder deployment speed, healthcare deal appetite, and typical holding-period extensions shaped variable selection and sensitivity ranges within the model.
Desk Research
We began by gathering publicly available datasets from sources such as the OECD Capital Market Series, World Bank FDI statistics, UNCTAD investment trend monitors, and central-bank balance-of-payments releases, which anchor regional capital flows. Regional trade groups, including the Asian Venture Capital Journal's open newsletters and the Singapore Venture & Private Capital Association's annual factbooks, supplied deal counts, median entry multiples, and exit channel splits. Company disclosures, IPO prospectuses, and Form 10-Ks were mined through Dow Jones Factiva, while D&B Hoovers provided fund manager financial snapshots. These references illustrate the breadth of secondary material consulted; many additional publications aided data checks and contextual framing.
Market-Sizing & Forecasting
A regional top-down construct starts with historical deal value and assets-under-management series, rebuilt from production and trade data for capital flows, which are then corroborated through selective bottom-up snapshots such as sampled average ticket size multiplied by deal count and disclosed fee income rolls. Key fingerprints, including dry-powder ratios, median entry EV/EBITDA multiples, IPO window length, sovereign-fund allocation targets, and secondary-market discount trends, drive scenario parameters. Multivariate regression with ARIMA overlays projects each variable, letting the model capture cyclical fundraising swings and macro shocks before converging on a 2030 value. Data gaps in country-level buyout counts were bridged using three-year moving averages benchmarked against comparable venture activity.
Data Validation & Update Cycle
Outputs pass a two-layer analyst review: first for variance versus historical patterns and peer benchmarks, then for anomaly reconciliation with interview feedback. Reports refresh every twelve months, with interim updates triggered by material regulatory or macro events; a final pre-publication sweep ensures clients receive the latest view.
Why Mordor's Asia-Pacific Private Equity Baseline Earns Dependability
Published estimates often diverge because firms pick differing fund types, investment stages, currencies, and refresh cadences.
Key gap drivers include whether venture capital and mezzanine pools are counted, the choice between AUM versus annual capital raised, and the treatment of undrawn commitments; this is where Mordor Intelligence applies a consistent assets-under-management lens and annual refresh, whereas others vary these levers.
Benchmark comparison
| Market Size | Anonymized source | Primary gap driver |
|---|---|---|
| USD 2.71 tn (2025) | Mordor Intelligence | - |
| USD 1.10 tn (2024) | Regional Consultancy A | Omits undrawn commitments and excludes Japan buyouts |
| USD 35 bn (2024) | Trade Journal B | Measures only new capital raised, not total AUM |
| USD 0.85 tn (2023) | Global Consultancy C | Counts active funds less than USD 5 bn and excludes secondary funds |
These comparisons show that when scope is narrow or refreshes are infrequent, totals compress or inflate unpredictably. By selecting clear variables, cross-checking with primary evidence, and updating yearly, Mordor delivers a balanced, transparent baseline that decision-makers can replicate and trust.


Key Questions Answered in the Report
How large is the Asia-Pacific private equity market today?
The market stands at USD 3.03 trillion in 2026 and is forecast to reach USD 5.32 trillion by 2031 following a 11.89% CAGR.
Which geography is growing fastest within the region?
India leads with a projected 13.38% CAGR through 2031, driven by strong foreign-investment inflows and regulatory liberalization.
Why is private credit important for Asia-Pacific sponsors now?
Banking retrenchment and stricter capital rules have created funding gaps, making private credit vital for acquisition finance and infrastructure projects worth trillions of USD
What sector offers the highest growth outlook?
Healthcare tops the list, expected to expand at 17.92% CAGR as ageing populations boost demand for medical infrastructure and services.
Page last updated on:


