Market Overview
| Study Period | 2021 - 2031 |
|---|---|
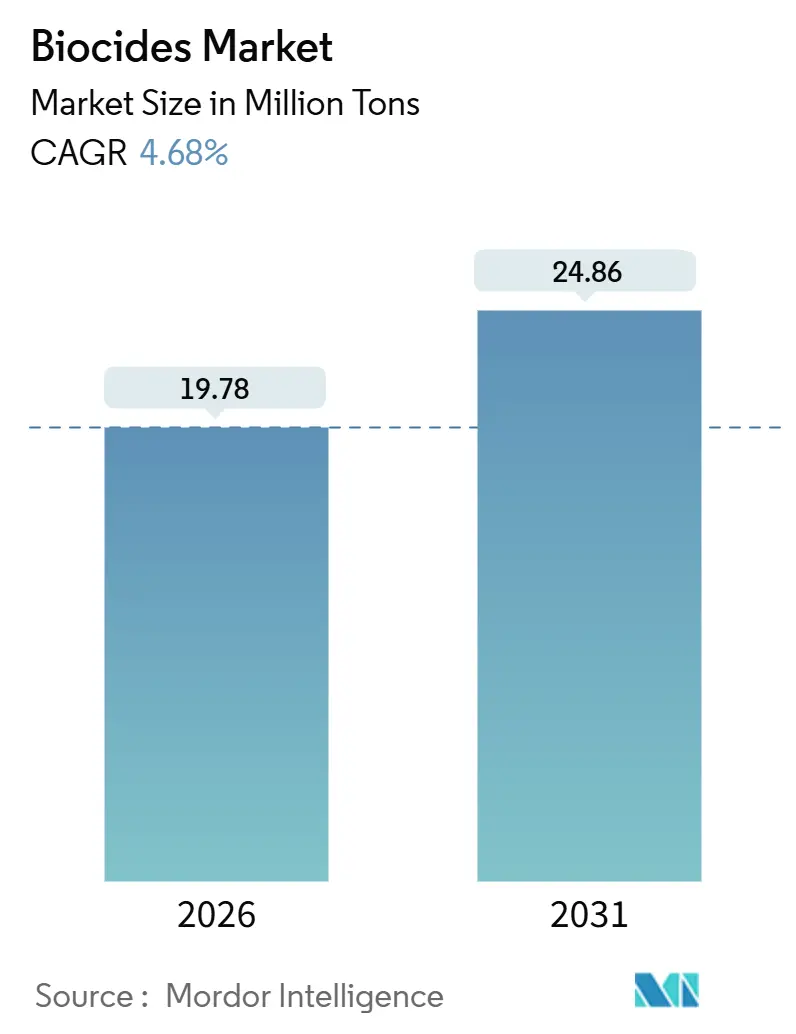
| Market Volume (2026) | 19.78 Million tons |
| Market Volume (2031) | 24.86 Million tons |
| Growth Rate (2026 - 2031) | 4.68% CAGR |
| Fastest Growing Market | Asia Pacific |
| Largest Market | Asia Pacific |
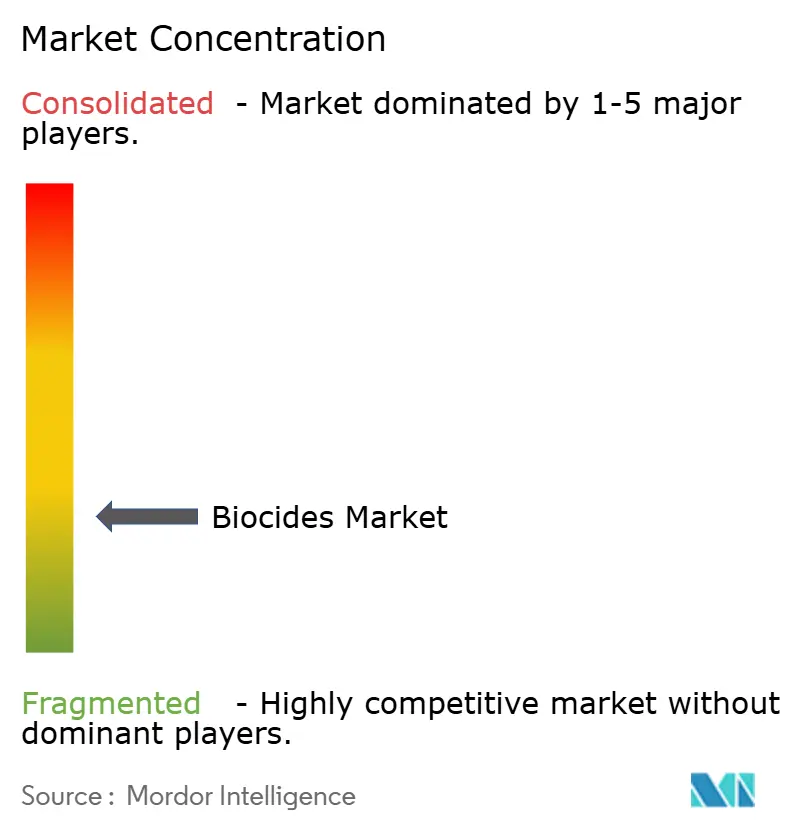
| Market Concentration | Medium |
Major Players *Disclaimer: Major Players sorted in no particular order Image © Mordor Intelligence. Reuse requires attribution under CC BY 4.0. | |
Biocides Market Analysis by Mordor Intelligence
The Biocides Market size is estimated at 19.78 million tons in 2026 and is expected to reach 24.86 million tons by 2031, at a CAGR of 4.68% during the forecast period (2026-2031). Growth reflects tightening environmental rules, rising investment in water and sanitation, and the post-pandemic normalization of hygiene protocols across manufacturing, health care, and built environments. Halogen compounds continue to anchor demand despite regulatory scrutiny, while oxidizing chemistries gain share because utilities see them as the most economical route to compliance. Wood preservation remains the largest individual application due to construction activity in North America and the Asia-Pacific. Regionally, Asia-Pacific sets the pace as governments fund large-scale water projects and local industries upgrade plant hygiene standards to match export-market rules.
Key Report Takeaways
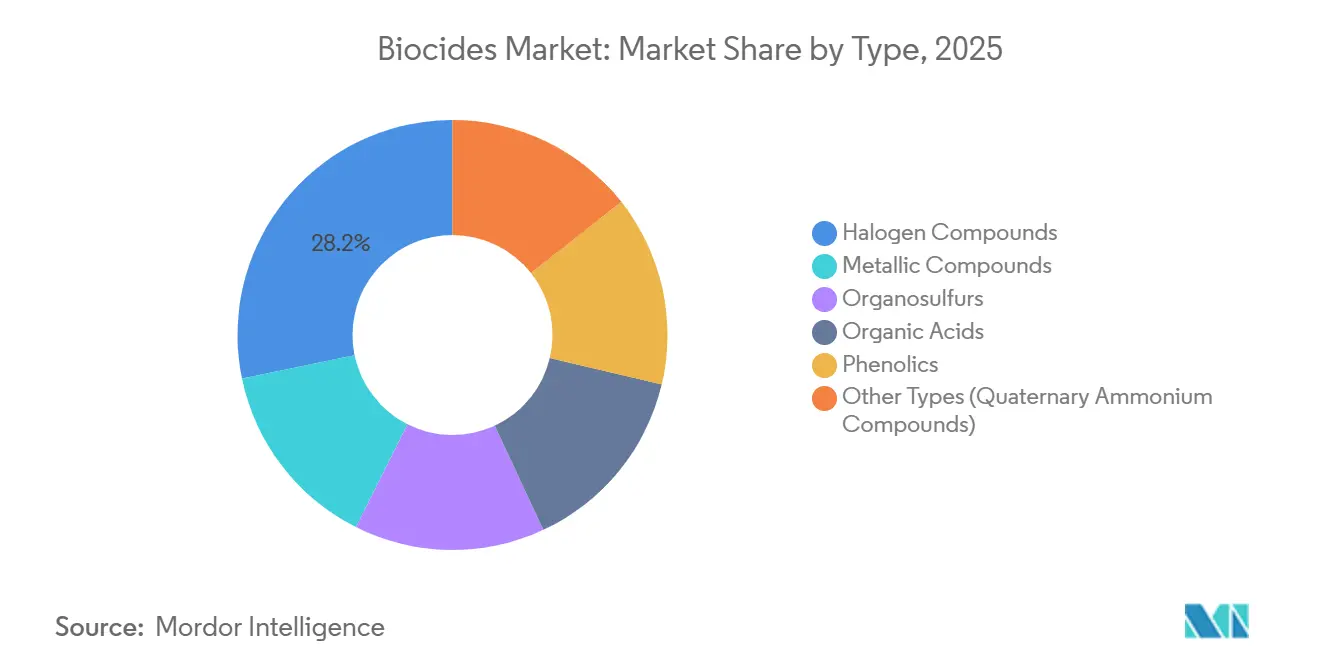
- By type, halogen compounds led with a 28.23% share of the 2025 volume and are projected to expand at a 5.86% CAGR through 2031.
- By application, wood preservation accounted for 32.12% of 2025 demand and is advancing at a 4.82% CAGR across the forecast horizon.
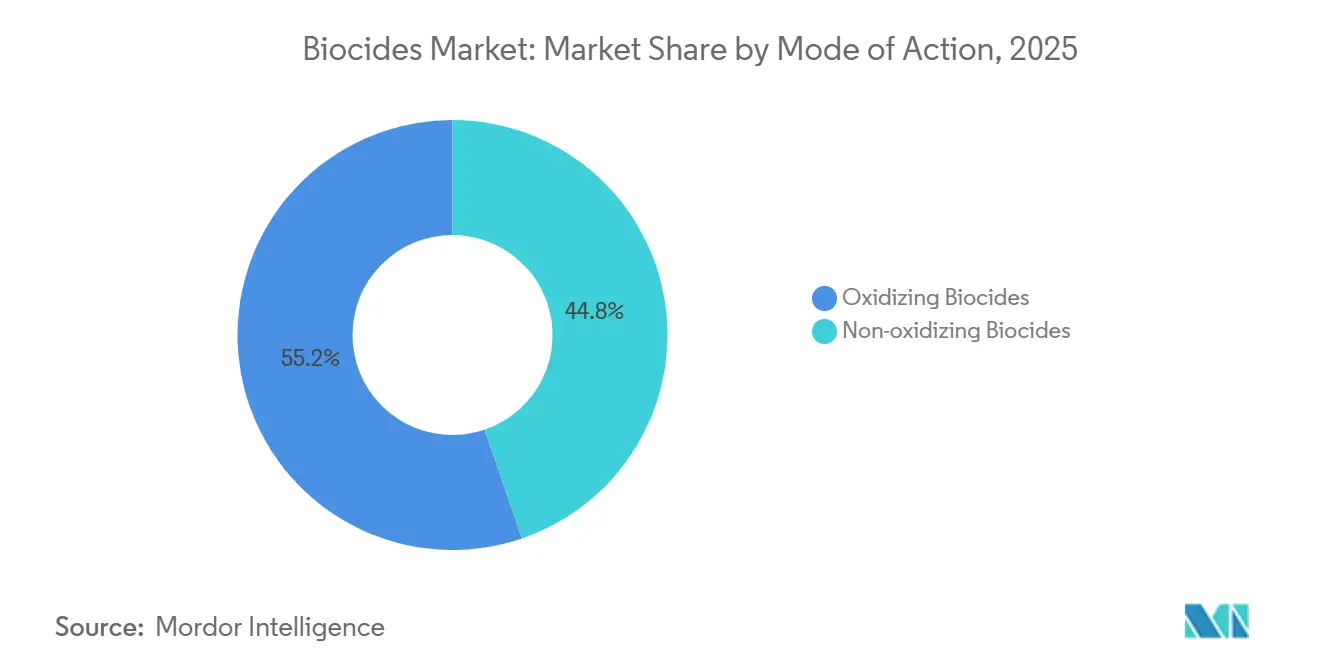
- By mode of action, oxidizing biocides captured 55.23% of the 2025 volume and are slated to grow at a 5.41% CAGR to 2031.
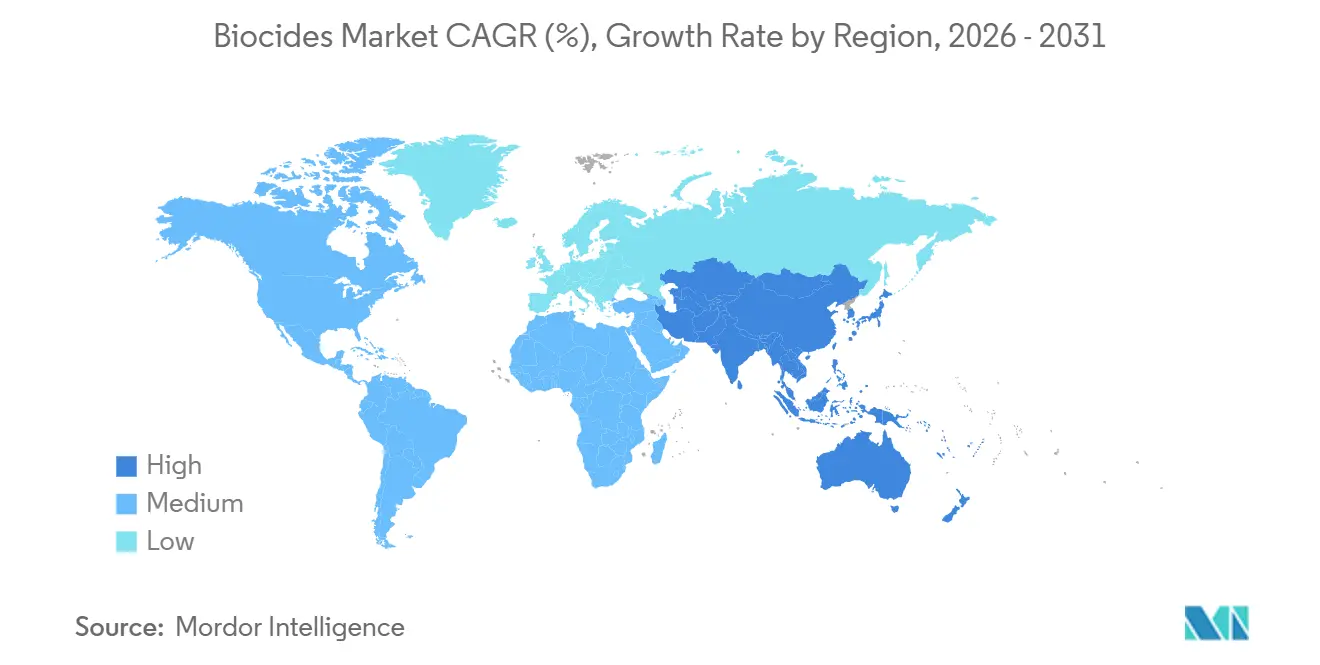
- By geography, Asia-Pacific held 35.32% of the 2025 volume and registers the fastest 5.22% CAGR through 2031.
Note: Market size and forecast figures in this report are generated using Mordor Intelligence’s proprietary estimation framework, updated with the latest available data and insights as of January 2026.
Global Biocides Market Trends and Insights
Driver Impact Analysis*
| Drivers | (~) % Impact on CAGR Forecast | Geographic Relevance | Impact Timeline |
|---|---|---|---|
| Increasing Demand for Water Treatment Globally | +1.2% | APAC, Middle East, global spillover | Long term (≥ 4 years) |
| Growing Demand from the Food and Beverage Industry | +0.9% | North America, EU, expanding APAC hubs | Medium term (2-4 years) |
| Heightened Awareness of Health and Hygiene | +0.7% | Global | Short term (≤ 2 years) |
| Rising Demand in Paints and Coatings Industry | +0.6% | Europe, North America | Medium term (2-4 years) |
| Regulatory Support for Safer Alternatives | +0.5% | EU, North America, upstream APAC | Long term (≥ 4 years) |
| Source: Mordor Intelligence | |||
Increasing Demand for Water Treatment Globally
Municipal and industrial treatment plants remain the single largest outlet for oxidizing chemistries such as chlorine dioxide and sodium hypochlorite, because these agents deliver reliable microbial control at the lowest cost per treated liter. The updated U.S. Stage 3 Disinfectants rule in 2024 lowered allowable trihalomethanes, prompting utilities to blend peracetic acid or ultraviolet oxidation with traditional chlorination[1]U.S. Environmental Protection Agency, “Stage 3 Disinfectants and Disinfection Byproducts Rule,” epa.gov. China’s zero-discharge mandate for coastal industrial cooling water is pushing operators toward non-oxidizing isothiazolinone programs that limit salinity and chemical oxygen demand[2]Ministry of Ecology and Environment China, “Zero-Discharge Cooling Water Standards,” mee.gov.cn. Across the Middle East, rapid desalination expansion has favored monochloramine systems because they minimize membrane biofouling and lower residual chlorine in brine. India’s National Mission for Clean Ganga funds ultraviolet–peracetic acid hybrids for new wastewater plants, which embed biocides as a secondary barrier rather than the lone treatment step. Together, these moves extend the serviceable universe for high-efficacy, low-dose oxidizers, sustaining the biocides market trajectory through 2031.
Growing Demand from the Food and Beverage Industry
Sanitation managers face a patchwork of residue limits that differ sharply between the United States and the European Union, accelerating the shift from commodity chlorine rinses to premium peracetic-acid or quaternary-ammonium blends. FDA guidance issued in 2025 allows 80 ppm peracetic acid on fresh-cut produce without a potable rinse, saving an estimated 15% water per line and encouraging processors to standardize around single-step protocols. Dutch dairy cooperatives reported 25% shorter clean-in-place cycles after switching to quaternary foams, a gain that lifts throughput and lowers steam use. Meanwhile, beverage plants fight yeast and mold in aseptic fillers with broad-spectrum biocides that remain efficacious across acidic product lines, evident in BASF Preventol's success at pH 3-7. Retail pressure for clean labels has prompted formulators to experiment with sorbic acid and natamycin; however, higher dosing rates and tighter application windows offset part of the consumer appeal. The net effect is a higher average selling price per active kilogram, bolstering revenue even when volumes shift toward costlier niches in the biocides market.
Heightened Awareness of Health and Hygiene
Hospitals, hotels, and public transit networks institutionalized elevated disinfection cycles after 2020 and show no rush to revert to pre-pandemic routines. In 2024, the Centers for Disease Control and Prevention endorsed hydrogen-peroxide vapor for terminal room turnaround, and 68% of U.S. acute-care hospitals with over 200 beds have already installed the equipment. European hospitality chains contract daily surface treatment with quaternary-ammonium sprays, a shift that helped Ecolab post a 34% sales increase to the segment in 2024. Asian transit authorities adopted electrostatic sprayers that deposit long-lasting antimicrobial coatings; microbial counts on treated rail surfaces now run 99.9% below untreated controls for up to 90 days. Market differentiation is emerging between fast-acting oxidizers for instant kill and polymer-bound quaternary compounds that provide residual protection. Retail disinfectant wipes remain in high demand, yet rising private-label penetration has started to compress branded margins. Overall, the driver adds 0.7 percentage points to forecast CAGR but will moderate after 2027 as institutional buyers shift from emergency stockpiling to routine restocking.
Rising Demand in Paints and Coatings Industry
Green-building schemes now award points for antimicrobial interior paints, bringing what was once a hospital-only specification into mainstream commercial and even residential construction. LEED v5 grants credit if the paint carries an EPA-registered biocide and meets volatile-organic-compound (VOC) caps, a combination now achievable with silver-ion or zinc-pyrithione systems. Silver-ion additives represented 18% of antimicrobial-coatings sales in 2025, primarily because the ions inhibit bacterial colonization on surfaces for up to five years. Zinc pyrithione remains the go-to for marine antifouling, though European regulators are reviewing its aquatic toxicity, spurring research into copper blends that meet performance targets with lower persistence. In Asia-Pacific, India’s affordable-housing drive calls for antimicrobial wall coatings to curb mold in humid climates, expanding the addressable market for premium additives. Price premiums of 25-40% over standard paints are common, ensuring robust value growth in the biocides market even when volumes remain modest.
Restraint Impact Analysis*
| Restraints | (~) % Impact on CAGR Forecast | Geographic Relevance | Impact Timeline |
|---|---|---|---|
| Environmental Issues and Health Hazards Related to Biocides | -0.8% | EU, North America, growing focus elsewhere | Long term (≥ 4 years) |
| Fluctuating Raw Material Prices | -0.5% | Europe, Asia, global ripple effects | Short term (≤ 2 years) |
| High Research and Development Costs | -0.8% | Asia-Pacific, South America, Middle East and Africa | Medium term (2-4 years) |
| Source: Mordor Intelligence | |||
Environmental Issues and Health Hazards Related to Biocides
Regulators are elevating environmental and toxicological scrutiny, leading to longer approval pipelines and outright bans on specific actives. The European Chemicals Agency added bronopol and glutaraldehyde to its Candidate List in 2024, compelling users to run substitution assessments wherever safer options exist. The U.S. EPA’s endocrine-disruption screen flagged triclosan and triclocarban in 2025, prompting consumer-goods makers to phase out both and cut usage in personal-care products by 62% within 18 months. Aquatic-toxicity caps on isothiazolinones in EU industrial discharges now stand at 0.1 µg L-1, forcing plants to upgrade to closed-loop treatments or pay wastewater surcharges. Encapsulation technologies help curb environmental release but raise production costs by 15-20%, squeezing margins on commodity lines. Collectively, tightening standards subtract 0.8 percentage points from the forecast CAGR and heighten compliance risk for suppliers that lag in portfolio renewal.
Fluctuating Raw Material Prices
Biocide economics remain hostage to chlor-alkali and petrochemical feedstock swings. European sodium hypochlorite prices shot up 42% in early 2025 when natural-gas costs jumped to EUR 120/MWh, prompting several formulators to invoke force-majeure clauses. Propylene volatility in Asia pushed isothiazolinone costs 28% higher in 2024, a spike that smaller suppliers could not hedge. While bio-based routes such as corn-fermented lactic acid offer partial insulation, these options still command 50-80% higher prices per active kilogram and face scale limitations. The result is a transient but meaningful erosion of price-sensitive demand, especially in industrial water treatment and wood preservation, trimming 0.5 percentage points off near-term growth for the biocides market.
*Our forecasts treat driver/restraint impacts as directional, not additive. The impact forecasts reflect baseline growth, mix effects, and variable interactions.
Segment Analysis
By Type: Halogen Dominance Anchors Volume Growth
Halogen compounds accounted for 28.23% of global volume in 2025, underscoring their status as the most widely used chemistry in the biocides market share. This subsegment is forecast to grow at a 5.86% CAGR through 2031, outpacing the broader biocides market as utilities and industrial users rely on chlorine- and bromine-based systems they already understand and can purchase at scale. Chlorine remains central to potable-water programs because operators can meet stricter disinfection-by-product limits through pH control and improved contact-time protocols rather than wholesale chemistry swaps. Bromine’s higher efficacy at elevated pH makes it the preferred choice for zero-liquid-discharge cooling towers where blowdown must be minimized. Metallic compounds, led by copper preservatives and silver-ion antimicrobials, satisfy niche yet high-value needs. Meanwhile, phenolics continue to lose share to quaternary ammonium and peroxide systems that avoid characteristic odor and surface staining. Regulatory reviews of isothiazolinones in the European Union pressure organosulfurs, but alternative pockets, such as organic acids, benefit from food-industry demand for clean-label antimicrobials exempt from full biocidal registration.
Halogens also derive strength from integrated supply chains; suppliers such as Dow operate captive chlor-alkali assets that hedge margin against feedstock swings. Growing installation of on-site chlorine dioxide generators further reduces lifecycle cost and transport risk, anchoring customer retention for established vendors. However, halogen volumes face a long-term ceiling as municipal utilities invest in multi-barrier treatment that incorporates ultraviolet or advanced oxidation to reduce chemical dosage. Suppliers that complement halogen products with bio-based or encapsulated alternatives will protect revenue as the biocides market absorbs both cost-driven and regulatory shifts in the 2030s.


By Application: Wood Preservation Leads, Water Treatment Diversifies
Wood preservation held 32.12% of application volume in 2025, the single largest slice of the biocides market share, thanks to sustained housing starts in North America and infrastructure expansion in Asia-Pacific. The segment is projected to grow at a 4.82% CAGR through 2031, supported by the American Wood Protection Association’s new UC5C classification aimed at extreme marine exposure that mandates dual-biocide systems. Modern copper azole blends meet lower human-toxicity thresholds under California Proposition 65 while extending the service life of marine pilings and utility poles. Market value also benefits from treated-timber price premiums of up to 20% versus untreated lumber.
Water treatment remains the second-largest and most diversified application. Municipal chlorination programs continue to rely on oxidizers, but industrial operators now supplement primary treatment with non-oxidizing agents to curb biofilm in closed-loop systems. Ballast-water programs integrate ultraviolet with residual biocides to meet International Maritime Organization D-2 standards, creating specialty niches for hybrid solutions. Food-grade water in beverage and dairy plants increasingly uses peracetic acid for no-rinse sanitation, accelerating demand for high-purity grades. These evolving requirements foster demand for specialized formulations, expanding revenue faster than tonnage in the biocides market.
By Mode of Action: Oxidizers Retain Cost Advantage
Oxidizing biocides commanded 55.23% of 2025 volume, delivering both immediate microbial kill and attractive cost per active kilogram, a combination that entrenches their position in the biocides market size calculus. Forecast growth at a 5.41% CAGR through 2031 reflects accelerated adoption of chlorine dioxide in large U.S. utilities, where it minimizes regulated trihalomethanes yet remains compatible with legacy infrastructure. Peracetic acid enjoys double-digit growth in food and wastewater applications because it breaks down into benign by-products, eliminating costly dechlorination steps. Hydrogen-peroxide–silver blends continue to gain share in pharmaceutical water systems that must meet stringent United States Pharmacopeia purity specs.
Non-oxidizers grow relatively slowly, but they remain indispensable for closed-loop cooling, oil-field injection, and long-term preservation where oxidizers off-gas too quickly or damage materials. Isothiazolinone usage persists despite tighter European limits because few alternatives match its efficacy at sub-ppm dosages in high-organic waters. Dual-chain quaternary ammonium compounds dominate surface disinfection in health care settings due to residual activity against enveloped viruses. Glutaraldehyde use is plateauing as hospitals move to ortho-phthalaldehyde or peracetic acid systems that reduce worker exposure. Suppliers increasingly market hybrid packages in which a fast-acting oxidizer delivers primary kill, followed by a non-oxidizer that maintains residual protection against recolonization, a strategy that aligns with precision-dosing trends in the broader biocides market.
Geography Analysis
Asia-Pacific made up 35.32% of the 2025 volume and posts the fastest 5.22% CAGR through 2031, reflecting vigorous infrastructure spending and stricter water-quality laws. China’s zero-discharge cooling-water mandate forces petrochemical and metals plants onto closed-loop systems that require constant biocide dosing to control microbial-induced corrosion. India’s Jal Jeevan Mission, targeting universal rural water connections, rolls out millions of small dosing stations that rely on sodium hypochlorite powder for simplified logistics. Japan tightened Legionella monitoring in tower loops, lifting domestic demand for non-oxidizing solutions that can be deployed without draining systems in densely occupied buildings. Southeast Asian manufacturing hubs insist on EPA- or EU-compliant biocides to secure export certifications, prompting BASF to add 40,000 ton/year capacity at Nanjing for regional supply.
North America and Europe together account for half of global consumption, yet expand slowly because markets are mature and regulatory constraints drive reformulation rather than volume expansion. The United States advanced its Safer Choice standards in 2024, banning or limiting eighteen actives, thereby nudging suppliers toward bio-based alternatives that command higher prices but lower dose rates. Canada’s re-evaluation program for pollinator safety delays renewal for several commonly used actives, adding supply uncertainty. Europe’s centralized Union Authorization process now stretches approvals to three years, a burden that favors multinationals with robust regulatory teams. Demand inside the bloc concentrates in Germany, the United Kingdom, and France, driven by automotive coatings, pharmaceuticals, and municipal water.
South America and the Middle East and Africa are witnessing a significant rise in demand as governments expand water and energy infrastructure. Brazil now permits chlorine dioxide and peracetic acid as alternatives to chlorine in potable water, opening the door for on-site generation equipment. Argentina’s industry upgrades cooling systems to comply with stricter discharge rules, supporting sales of non-oxidizing packages. Saudi Arabia’s Vision 2030 desalination build-out calls for monochloramine to curb membrane biofouling, representing a significant new outlet for oxidizer producers. Nigeria and Egypt secure African Development Bank grants for WHO-compliant chlorination installations, signalling future upside in sub-Saharan volumes.

Competitive Landscape
The biocides market is moderately fragmented, with the top five players in the market accounting for considerable market share and leaving space for regional specialists. Regulatory compliance serves as a key entry barrier; incumbents leverage pre-existing EPA and EU registrations that cost newcomers years and millions to replicate. Formulation know-how is equally pivotal; leaders increasingly market multi-active blends that balance efficacy, stability, and eco-toxicity to meet emerging standards in real time. Vertical integration into chlorine and peracetic-acid intermediates shields margins when feedstock costs spike, a hedge smaller formulators cannot easily replicate.
Biocides Industry Leaders
Ecolab
BASF SE
Lonza
Dow
LANXESS
- *Disclaimer: Major Players sorted in no particular order

Recent Industry Developments
- January 2025: BASF completed a EUR 180 million expansion at its Ludwigshafen site, adding 30,000 ton/year capacity for peracetic-acid and hydrogen-peroxide formulations.
- November 2024: Dow formed a joint venture with Saudi Aramco to build a 50,000 ton/year chlor-alkali unit in Jubail, slated for Q3 2026 start-up.
- September 2024: Lonza acquired algae-based antimicrobial specialist Ichor Therapeutics for USD 120 million to accelerate its clean-label portfolio.


Research Methodology Framework and Report Scope
Market Definitions and Key Coverage
Our study defines the global biocides market as the sale of chemical or biologically derived active substances that suppress, render harmless, or eliminate harmful microorganisms across water treatment, paints and coatings, wood preservation, personal care, food processing, oil and gas, and hygienic cleaning value chains. We include oxidizing and non-oxidizing actives sold in formulated or technical grades, tracking volume and value from the first point of commercial sale through to industrial end use.
Scope exclusion: Agricultural crop protection pesticides and hospital-grade antiseptics regulated under separate legislation are not included.
Segmentation Overview
- By Type
- Halogen Compounds
- Metallic Compounds
- Organosulfurs
- Organic Acids
- Phenolics
- Other Types (Quaternary Ammonium Compounds)
- By Application
- Water Treatment
- Pharmaceutical and Personal-care
- Wood Preservation
- Food and Beverage
- Paints and Coatings
- Other Applications (Oil and Gas, Agriculture, Disinfectants and Sanitization)
- By Mode of Action
- Oxidizing Biocides
- Non-oxidizing Biocides
- By Geography
- Asia-Pacific
- China
- India
- Japan
- South Korea
- Thailand
- Malaysia
- Indonesia
- Vietnam
- Rest of Asia-Pacific
- North America
- United States
- Canada
- Mexico
- Europe
- Germany
- United Kingdom
- Italy
- France
- Spain
- Russia
- Nordics
- Rest of Europe
- South America
- Brazil
- Argentina
- Rest of South America
- Middle East and Africa
- Saudi Arabia
- United Arab Emirates
- Qatar
- South Africa
- Nigeria
- Egypt
- Rest of Middle East and Africa
- Asia-Pacific
Detailed Research Methodology and Data Validation
Primary Research
We interview product development chemists at specialty chemical suppliers, sourcing managers from municipal water utilities, regional distributors, and coatings formulators across North America, Europe, Asia Pacific, and the Middle East. These discussions validate cost pass-through, regional penetration rates, and regulatory lead times that raw desk data alone cannot capture.
Desk Research
Mordor analysts begin with structured desk work that mines open-source regulators such as the US EPA's Pesticide Product and Ingredient lists, the EU ECHA Biocidal Products Regulation (BPR) dossiers, and China's Ministry of Ecology and Environment discharge norms; these clarify allowable actives and registration counts. Trade flow and tariff data from UN Comtrade, Eurostat, and Volza outline cross-border movement of halogen and metallic compounds, while industry bodies such as the American Chemistry Council and the International Paint and Printing Ink Council publish demand snapshots for key downstream sectors.
Company 10-Ks, investor decks, and procurement tender portals supply price bands and contract volumes that we feed into our model. Paid databases, D&B Hoovers for producer financials and Dow Jones Factiva for transaction news, round out the picture. The sources cited above are illustrative; many additional publications and datasets are consulted for corroboration and gap filling.
Market Sizing and Forecasting
A top-down reconstruction starts with national production plus net imports of active substances, converted to finished form output using average formulation factors, and then distributed across applications by end-use penetration shares. Select bottom-up checks, supplier revenue roll-ups and sampled ASP times volume transactions, calibrate totals. Key model variables include industrial water withdrawal volumes, new housing wood demand, regional architectural paint output, average halogen compound price, and annual BPR approval counts. Forecasts rely on multivariate regression combined with scenario analysis for regulatory tightening, with historical series extended via ARIMA where data are short. Any bottom-up gaps are bridged using nearest neighbor ratios drawn from analog markets.
Data Validation and Update Cycle
Outputs pass three-layer variance checks, peer review, and reconciliation against independent indicators before sign-off. Reports refresh every twelve months, with mid-cycle updates triggered by material events; a final analyst pass ensures clients receive the latest view.
Why Mordor's Biocides Baseline Inspires Confidence
Published estimates often diverge because firms adopt different application baskets, price assumptions, and refresh cadences.
Key gap drivers include narrower end-use coverage, region omissions, or aggressive price inflation factors used elsewhere, whereas Mordor's model ties every ton and dollar to auditable supply, trade, and consumption series and benefits from yearly primary research recalibration.
Benchmark comparison
| Market Size | Anonymized source | Primary gap driver |
|---|---|---|
| USD 10.60 B (2025) | Mordor Intelligence | - |
| USD 9.72 B (2024) | Global Consultancy A | Excludes personal care and oil and gas uses; older base year |
| USD 9.29 B (2024) | Industry Publisher B | Omits several Asia Pacific economies, uses factory gate prices only |
| USD 8.34 B (2024) | Trade Journal C | Relies on import statistics without domestic production uplift |
In summary, Mordor's disciplined scope selection, dual track modeling, and annual validation deliver a balanced, transparent baseline that decision makers can trace back to clearly documented variables and repeatable steps.


Key Questions Answered in the Report
What is the current volume of the biocides market and its expected growth to 2031?
The biocides market is estimated at 19.78 million tons in 2026 and is projected at 24.86 million tons by 2031, implying a 4.68% CAGR.
Which segment holds the largest biocides market share?
Halogen compounds led with 28.23% of 2025 volume, retaining dominance through 2031.
Why is Asia-Pacific the fastest-growing region for biocides?
Government-funded water projects, zero-discharge mandates, and expanding manufacturing bases lift regional demand, driving a 5.22% CAGR.
How are regulations influencing product development?
EU and U.S. fast-track pathways for low-toxicity and bio-based actives compress innovation cycles and favor suppliers that invest in safer chemistries.
Which companies dominate production capacity?
BASF, Dow, Ecolab, Lonza, and Kemira together control roughly 38% of global installed capacity, giving the market a moderate concentration level.
What technologies are shaping future demand?
Precision-dosing systems, encapsulated actives, and hybrid oxidizer–non-oxidizer treatment packages are redefining efficiency and compliance in the biocides market.
Page last updated on:


