
Beer Market Analysis by Mordor Intelligence
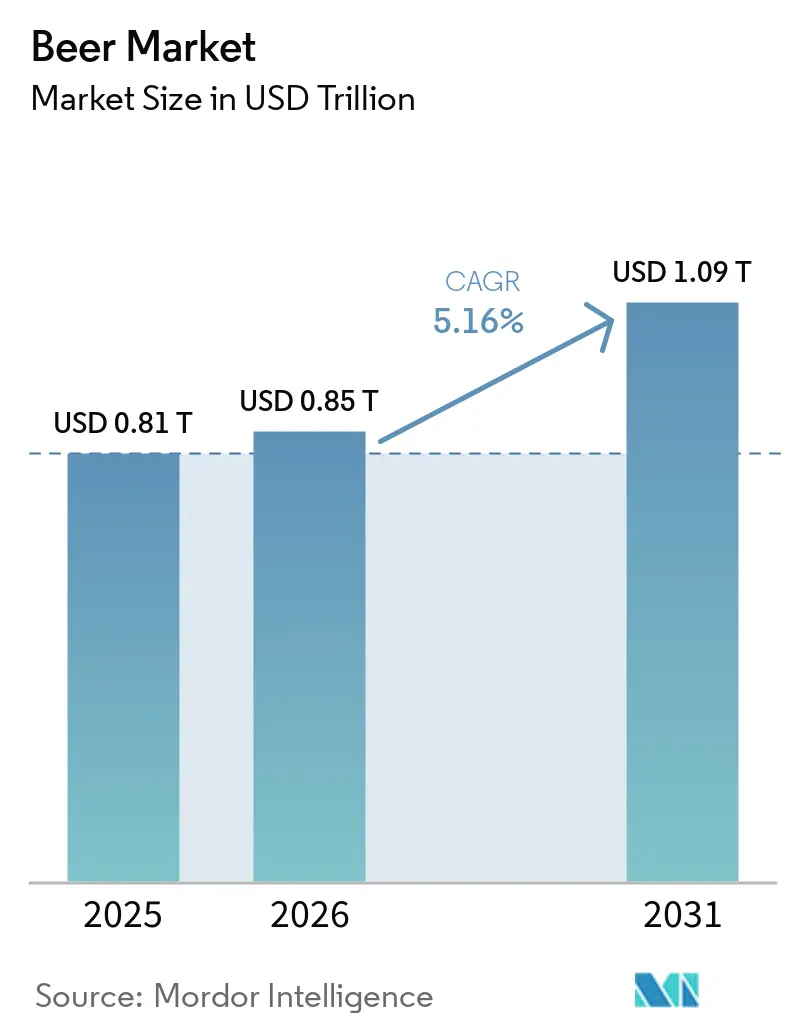
The beer market size is expected to grow from USD 0.85 trillion in 2026 to USD 0.89 trillion in 2027 and is forecast to reach USD 1.13 trillion by 2032 at 4.88% CAGR over 2027-2032.
Growth depends on turning brewing capacity and hospitality activity into beer occasions that fit changing consumption limits. Alcohol-free formulations in the United States and ingredient-specific beers can help brewers retain occasions among consumers who manage alcohol intake and dietary needs. Production efficiency and sourcing coordination can support that wider offer, while input costs and duty charges pressure beer economics. Brazil's household income pressures make affordability a local priority, favoring brewers that can defend accessible core beer while developing alcohol-free and premium offers.
Key Report Takeaways
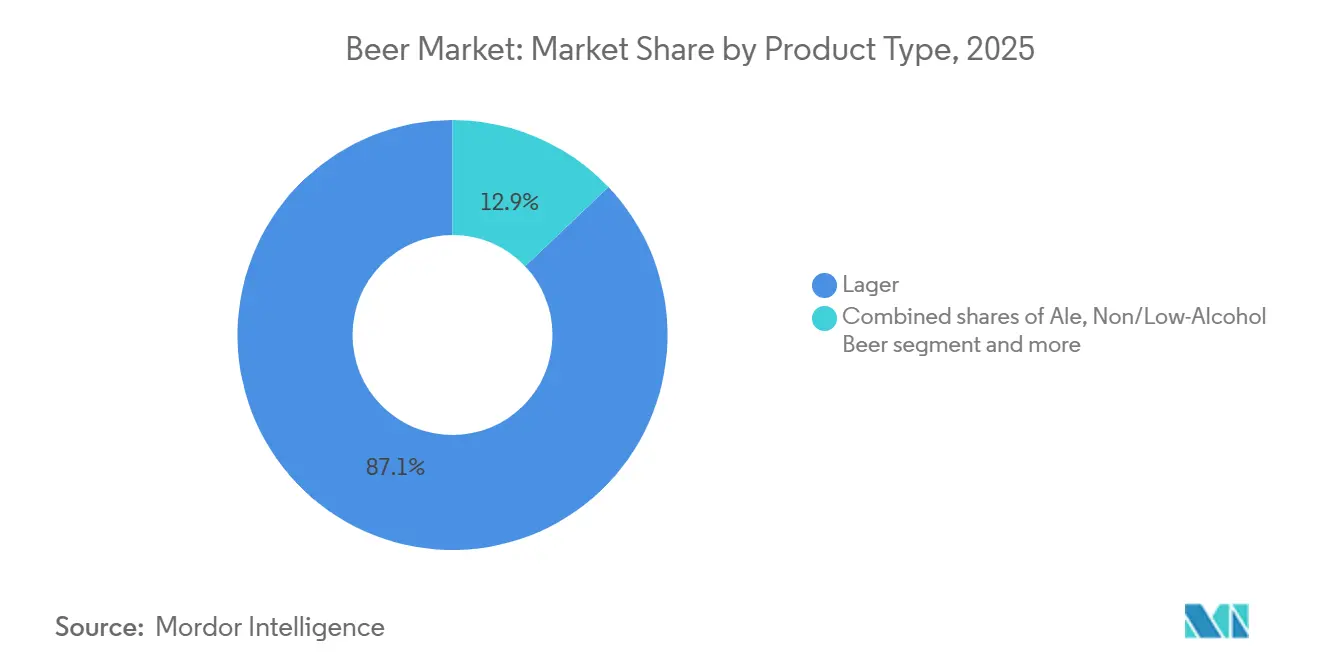
- By product type, lager held an 87.08% beer market share in 2026, and non/low-alcohol beer is forecast to grow fastest at 5.1% CAGR over 2027-2032.
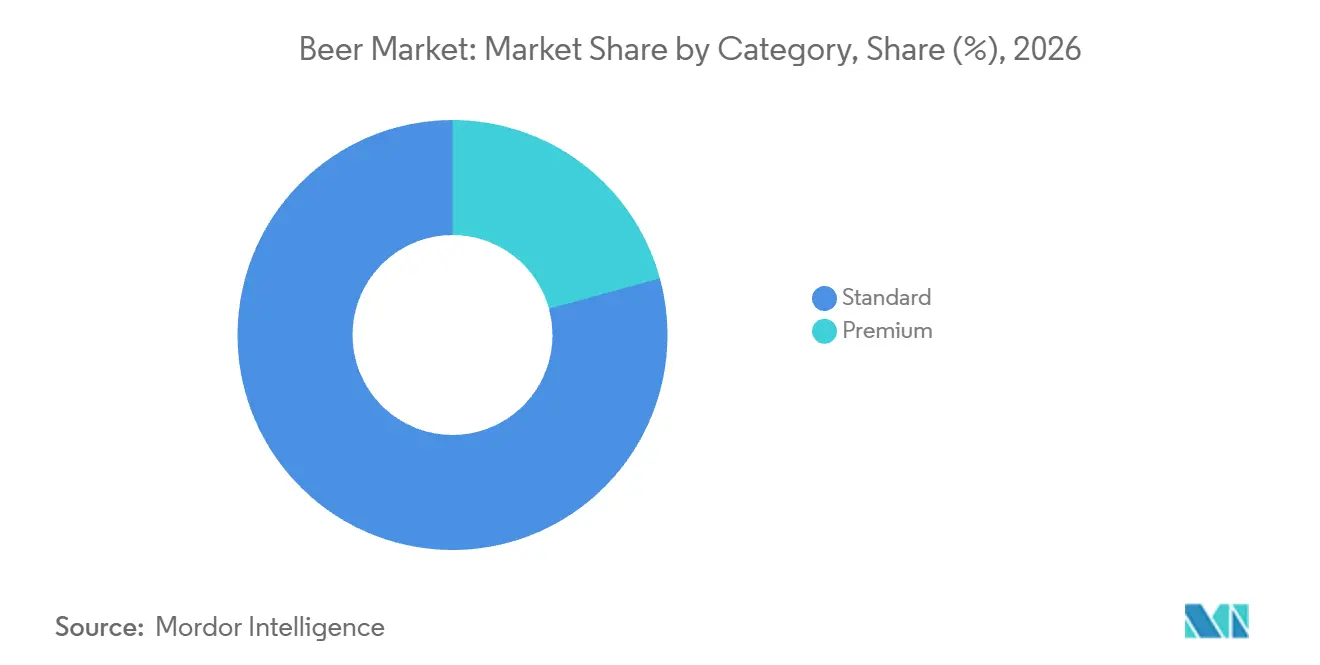
- Within the category breakdown, standard beer accounted for a 79.24% share of the beer market size in 2026, while premium beer is forecast to grow fastest at 5.2% CAGR over 2027-2032.
- Packaging sales were led by bottles with 55.12% of total producer beer sales value in 2026, with cans forecast to grow fastest at 5.35% CAGR over 2027-2032.
- By distribution channel, on-trade held 57.22% of total producer beer sales value in 2026, and off-trade is forecast to grow fastest at 5.45% CAGR over 2027-2032.
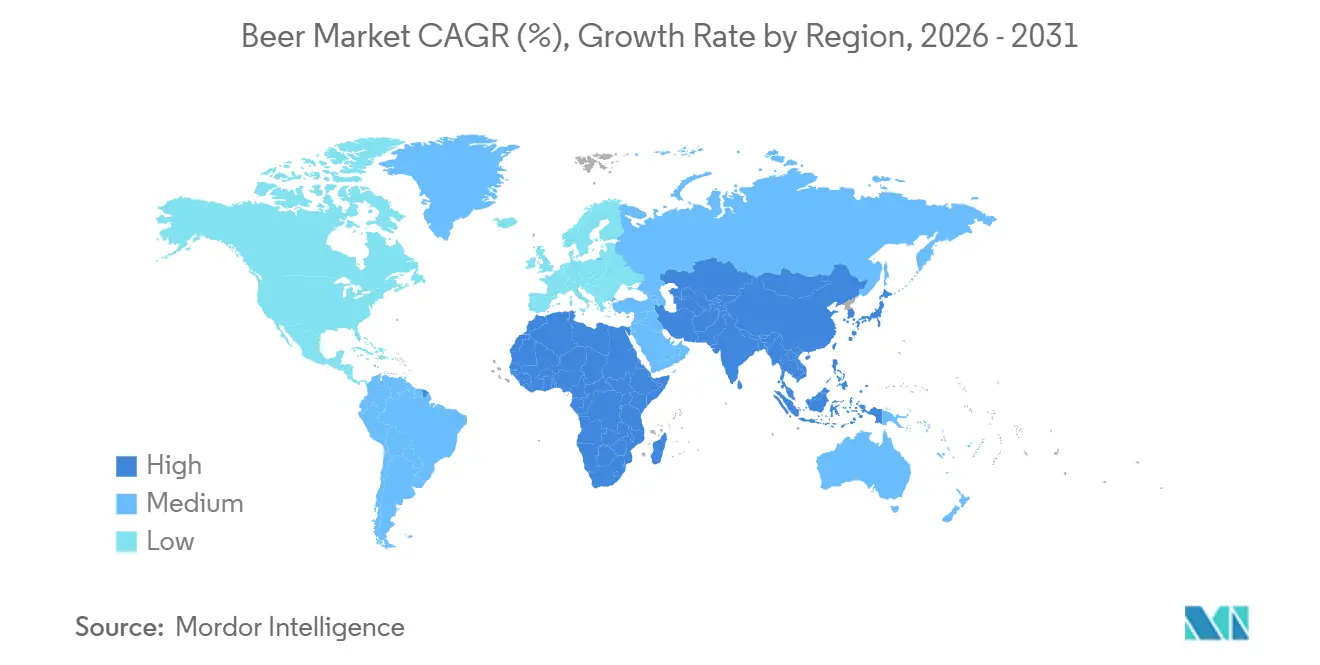
- Geographically, Asia-Pacific led with 30.26% of total producer beer sales value in 2026 and is also forecast to grow fastest at 5.3% CAGR over 2027-2032.
Note: Market numbers in this report are based on Mordor Intelligence's proprietary estimation framework, which combines nine months of actuals with Q4 projections for base year 2026.
Market Trends and Insights
Drivers Impact Analysis of Beer Market*
| Driver | (~) % Impact on CAGR Forecast | Geographic Relevance | Impact Timeline |
|---|---|---|---|
| Growing Number of Breweries Leading to High Prevalence of Craft Beer | +1.1% | Brazil and the United States | Medium term (2-4 years) |
| Growing Tourism and Hospitality Impact Positive Growth | +1.7% | North America, Europe and Asia-Pacific | Short term (≤ 2 years) |
| Product Innovation in Terms of Ingredient and Alcohol Content | +2.2% | United States and Denmark | Short term (≤ 2 years) |
| Health Conscious Consumer Accelerating Demand For Gluten Free Beer | +1% | Across Australia’s brewing regions | Medium term (2-4 years) |
| Rising Focus on Sustainable and Ethical Beer Production | +0.8% | Mexico, Vietnam, Italy and Brazil | Long term (≥ 4 years) |
| Brewing Industry's Technological Evolution | +0.6% | Mexico, Vietnam and Brazil | Medium term (2-4 years) |
| Source: Mordor Intelligence | |||
Growing Number of Breweries Leading to High Prevalence of Craft Beer
A broader brewery base creates more potential points of supply for differentiated beer. Brazil recorded 1,954 registered breweries in 2025, the highest number in its historical series. Within craft beer, Aviator Brewing Company opened a new campus in Fuquay-Varina, North Carolina, in April 2025, with a fully automated 60-barrel, 4-vessel brewhouse. A record registration count in Brazil points to a broad supplier base, while Aviator’s larger campus shows an established craft brewer adding capacity. For buyers seeking differentiated beer, supplier breadth and expanded craft production can support demand through both choice and availability.
Growing Tourism and Hospitality Impact Positive Growth
Expanding travel activity gives beer suppliers more potential hospitality occasions to address. The World Travel & Tourism Council reported that global travel and tourism GDP grew 4.1% to USD 11.6 trillion in 2025. NielsenIQ's June 2026 report, drawing on its US Hotels Beverage Study 2025, found that 37% of consumers expected to drink beer during US hotel stays over the following 12 months. Wine and cocktails drew expectations of 34% and 30%, respectively, in the same measure. For hotel operators, beer's lead among these alcoholic categories identifies a specific guest occasion around which to develop beverage sales as tourism expands.
Product Innovation in Terms of Ingredient and Alcohol Content
Product innovation gives brewers a way to address distinct degrees of moderation within beer. Heineken N.V.’s US subsidiary launched Heineken 0.0 Ultimate in select US states in March 2026, describing it as the country’s first zero-calorie nonalcoholic beer. The brew combines zero alcohol, zero calories, and zero sugar. Carlsberg Nordlyst debuted in Denmark on January 21, 2026, as a 2.5% ABV lager with roughly half the alcohol of a classic pilsner. These offers create different propositions for partial moderation and complete alcohol avoidance, with additional sugar and calorie specifications in the Heineken product. A portfolio designed around those distinct limits can preserve beer occasions for consumers whose requirements extend beyond taste.
Health Conscious Consumer Accelerating Demand For Gluten Free Beer
For consumers who exclude gluten, a gluten-free beer offer can bring a beer occasion within their ingredient requirements. In November 2025, TWØBAYS Brewing Co. brewed and packed 50% more beer than in any previous single month in its 7-year history. The Australian brewer reported growing gluten-free beer demand that had stretched its brewers to capacity. An additional brewer and larger fermentation tanks enabled the team to increase output. Brewer headcount and tank volume set how much additional gluten-free beer the specialist can supply, which places the near-term limit on supply rather than demand.
Restraints Impact Analysis of Beer Market*
| Restraint | (~) % Impact on CAGR Forecast | Geographic Relevance | Impact Timeline |
|---|---|---|---|
| Stringent Government Regulations | -0.9% | Across the United Kingdom | Short term (≤ 2 years) |
| Health-Conscious Consumption Trends Limiting Beer Demand | -0.8% | Across the United States | Medium term (2-4 years) |
| Raw Material Cost Inflation and Supply Chain Challenges Impact Beer Production | -0.5% | Beer-producing regions of Brazil | Short term (≤ 2 years) |
| Religious and Cultural Constraints Affecting Beer Market Growth | -0.3% | Across Saudi Arabia | Long term (≥ 4 years) |
| Source: Mordor Intelligence | |||
Stringent Government Regulations
Statutory charges can constrain beer economics before a brewer changes its production process or commercial offer. From February 1, 2026, the United Kingdom uprated all Alcohol Duty rates by 3.66% in line with Retail Price Index inflation, including rates for non-draught beer and qualifying draught beer.[1] The increase added a tax burden even where a brewer's production process and underlying costs were unchanged. Absorbing that burden reduces the revenue available after duty, while recovering it through price creates a harder affordability proposition for buyers. Including qualifying draught products broadens that pricing trade-off beyond packaged beer, leaving brewers exposed to the statutory increase across both formats.
Health-Conscious Consumption Trends Limiting Beer Demand
Health-related moderation can constrain the number of drinking occasions available to beer suppliers. Among US adult alcohol drinkers in Gallup’s July 2025 survey, 49% of those who viewed moderate drinking as unhealthy reported past-week alcohol use, compared with 69% of those without that view. In the Brewers Association’s 2026 survey, US respondents aged 21-34 were more likely than the overall population to cite calorie reduction as a reason they did not drink more craft beer. These findings place the commercial constraint in participation frequency as well as willingness to add craft servings. Calorie limits can restrict additional craft servings even if a brewer wins younger drinkers' brand preference, weakening the link between share gains and total demand.
*Our forecasts treat driver/restraint impacts as directional, not additive. The impact forecasts reflect baseline growth, mix effects, and variable interactions.
Beer Market Segment Analysis
By Product Type:
Lager Scale Supports a Broad Core OfferLager was the largest product segment, accounting for 87.08% of global producer beer sales value in 2026. In Brazil, lager accounted for 99.57% of declared beer production volume in 2025.[2] Heineken N.V. announced the opening of its Passos brewery in Brazil on November 6, 2025, with initial capacity of up to 5 million hectoliters annually to serve the Heineken and Amstel brands. The investment targeted a premium brand proposition that includes Heineken lager. With lager making up nearly all declared Brazilian production, a premium proposition built on Heineken lager competes inside lager rather than against another beer type.
Non/low-alcohol beer is the fastest-growing product segment, with a forecast 5.1% CAGR over 2027-2032. Anheuser-Busch InBev SA/NV reported 27% organic revenue growth for its no-alcohol beer portfolio in the second quarter of 2026 versus a year earlier. That gives brand owners a commercial basis for developing revenue around alcohol avoidance within beer. Other beer types provide a separate served-occasion opportunity, with UK on-trade stout value sales increasing 24.4% between 2024 and 2025. These distinct propositions let suppliers pursue beer demand through both alcohol specifications and a particular style’s appeal in hospitality settings.

By Category:
Local Mainstream Brands Anchor ScaleStandard beer represented a 79.24% beer market share in 2026, making it the largest category segment. Carlsberg Group’s mainstream core beer accounted for 49% of its total beverage volume in 2025. The company defines core beer as its strong local mainstream brands. Local mainstream brands give a diversified brewer a substantial beer-volume base to defend alongside its soft-drink and other beverage operations.
Premium beer is the fastest-growing category segment, with a forecast 5.2% CAGR over 2027-2032. Carlsberg Group reported 1% organic growth in premium beer volume in the first half of 2026 year on year. China Resources Beer reported over 10% year-on-year volume growth across its combined sub-premium-and-above beer range during the same half. In its 2025 annual report, Carlsberg Breweries Group described premium beer as accretive to revenue per hectoliter and margins. A shift toward that premium portfolio can therefore lift revenue faster than volume, even when its volume growth is modest.
By Packaging Type:
Returnable Bottles Sustain an Established Supply ModelBottles accounted for a 55.12% share of the beer market size in 2026, making them the largest packaging segment. In Austria, 0.5-liter returnable beer bottles accounted for 50.7% of domestic production in 2025. For a brewer serving that type of market, returnable bottles tie the beer offer to a repeated-use container system. The commercial advantage depends on keeping that system useful to the outlet and producer across multiple filling cycles. Container recovery becomes a competitive cost lever for brewers using returnables because missing bottles cannot support another filling cycle.
Cans are the fastest-growing packaging segment, with a forecast 5.35% CAGR over 2027-2032. Across US beer, the Beer Institute estimated aluminum cans at 63.4% of volume in 2025, within a packaging mix that had stabilized over recent years. Cans accounted for 78% of packaged volume in US Brewers Association-defined craft beer in 2025, up 2 percentage points from 2024. Glass held the remaining 22% of that craft packaged volume. Replacing glass within this craft population gives can suppliers an adoption opportunity among existing beer producers, tying expansion to container choice as well as beer demand.
By Distribution Channel:
Served Occasions and Retail Shifts Require Different OffersOn-trade was the largest distribution segment, accounting for 57.22% of global producer beer sales value in 2026. The Beer Institute reported that US draft beer gained 3.8 percentage points of beer volume share from 2020 to 2025 as on-premise gained share. Molson Coors Beverage Company reported on-premise sales at approximately 16% of its total US and Canadian volume and approximately 60% in the United Kingdom, its largest EMEA&APAC region. Draft’s recovery gives suppliers a reason to develop their served-beer proposition around how bars, pubs, and restaurants use the product. The spread shows why a producer needs to align its hospitality strategy with country-level volume exposure rather than apply a single group-wide channel strategy.
Off-trade is the fastest-growing distribution segment, with a forecast 5.45% CAGR over 2027-2032. Heineken N.V. reported a European shift from on-trade to off-trade channels in 2025 as overall beer consumption fell, driven primarily by frequency. That experience shows how a channel can become more relevant even when drinking occasions become less frequent. For brewers, retail participation can capture beer occasions that move away from hospitality venues, while the product must still earn consumer demand.
Geography Analysis
Asia-Pacific Beer Market
Asia-Pacific held a 30.26% beer market share in 2026 and was the largest and fastest-growing region, with a forecast 5.3% CAGR over 2027-2032. Heineken N.V.’s Asia Pacific business recorded 24.3 million hectoliters of beer volume in the first half of 2026, up 6.6% organically from the first half of 2025. Vietnam, India, and Indonesia led its beer-volume growth, giving the company several national contributors within the region. Heineken's regional net revenue grew 10.5% organically and operating profit rose 17.7% organically in the same half, with Vietnam, Myanmar, and Indonesia contributing strongly to profit, extending its growth case from volume to earnings.
In North America, brewery packaging investment can give established beer brands a platform for further commercial development. In March 2025, FIFCO USA unveiled a USD 28 million can line in Rochester, New York, with reported capacity above 15 million cases annually for beer and other beverage brands. After its September 2026 sale to Saothair Capital Partners, the business announced that it would return to the North American Breweries name. In Europe, the European Union’s share of beer consumed in pubs, bars, and restaurants stabilized in 2025 after years of decline. These examples suggest different commercial priorities, with American packaging capability and European venue participation offering distinct ways to earn from established beer demand.
South America’s beer opportunities can depend on household purchasing power, as illustrated by Brazil’s cyclical demand pressures. Heineken N.V. reported weaker Brazilian beer-category momentum in 2025 as real disposable income declined and subsidies to lower-income households were withdrawn, describing the factors as predominantly cyclical. For brewers in that country, a commercially viable offer needs to fit the resources households can devote to beer while demand is under pressure. In the Middle East and Africa, Heineken reported beer-category expansion in Ethiopia and South Africa in 2025, driven by rising penetration, consumption, and premiumization. The contrast makes affordability during cyclical weakness a different commercial task from expanding participation and higher-tier beer consumption in these African operating markets.
Regulatory Framework and Outlook
This comparison covers selected jurisdictions from the perspective of commercial brewers introducing beer formulations. Ratings reflect the scope to bring a beer offer to sale while meeting product, label, and entry conditions. Product eligibility, tax administration, and registration create different commercial tasks across these settings. Scheduled and proposed changes also require different responses because a recommended reference, a proposed label duty, and an enacted tax-basis change carry different obligations.
Regulatory Table of Beer Market
| Decision factor | United States | Germany | China | Brazil | South Africa |
|---|---|---|---|---|---|
| Primary authority | Alcohol and Tobacco Tax and Trade Bureau (TTB) | German customs authorities | State Administration for Market Regulation and local market regulators | Ministry of Agriculture and Livestock (MAPA) | Department of Agriculture, through the Liquor Products Act administering officer |
| Key instruments or direction | 27 CFR parts 7, 16, and 25 where applicable; proposed allergen disclosures with exceptions and compliance 5 years after publication of a final rule | Beer Tax Act; all-ingredient Plato accounting from January 1, 2031 | Mandatory GB 2758-2012; recommended GB/T 4927-2025 from January 1, 2027 | Decree 12.709/2025 and Normative Instruction 65/2019; manufacturing and trade-control rule in progress | Amended Liquor Products Regulations, Regulation 8B and Table 3B |
| Commercial effect | Covered malt-beverage labels and health warnings required; formula approval when applicable | Beer excise by degrees Plato; reduced rates for qualifying independent breweries below 200,000 hectoliters annually | Beer composition and labeling conditions, including a warning on glass beer bottles | Covered establishments and products need prior registration, subject to express regulatory exceptions | Beer-class ingredient, strength, and bitterness conditions; flavored beer uses Table 6 flavorings |
| Current policy attractiveness | Medium | Medium | Medium | Medium | Low |
| Future direction of policy attractiveness | Hardening | Hardening | No change | No change | No change |
| Source: Mordor Intelligence | |||||
US labeling duties and TTB's 2025 allergen-disclosure proposal, with exceptions and compliance proposed 5 years after a final rule's publication, support Medium attractiveness and Hardening, while Brazil's registration gate supports Medium attractiveness and No change because beverage-wide manufacturing and trade-control work is at the agenda stage. Germany’s relief for qualifying independent breweries supports Medium attractiveness, while all-ingredient Plato accounting from January 1, 2031, supports Hardening. China’s mandatory beer food-safety conditions anchor Medium attractiveness, while the recommended quality-standard replacement scheduled for January 1, 2027, supports continuity in mandatory obligations. South Africa’s prescriptive beer-class composition rules make the setting less flexible for new formulations, supporting Low attractiveness and a No change outlook under the 2025 framework.
Value Chain Stages
The value chain compares barley-malt supply, brewing, and wholesale distribution through their different sources of supplier earnings. In 2025, Carlsberg Group’s French business, Brasseries Kronenbourg, signed a contract with Soufflet Malt and Soufflet Agriculture for the 2026 and 2027 barley-malt harvests. The agreement connects production requirements with defined future sourcing periods. For a brewer, that coordination can make input consistency a commercial capability alongside the ability to brew at scale.
Value Chain Analysis Table of Beer Market
| Primary activity | Key participants | Value capture | Bottleneck | Resilience response |
|---|---|---|---|---|
| Barley-malt supply | Grain suppliers such as Soufflet Malt and Soufflet Agriculture | Sales of barley malt to brewers | Meeting contract-specific sourcing requirements | Agree supply across identified harvests |
| Brewing and producer sales | Brewers such as Heineken N.V. and Brasseries Kronenbourg | Producer sales of beer through trade channels and selected direct routes | Coordinating ingredients, production, and serving formats | Align brewing schedules with input and channel commitments |
| Wholesale distribution | Drinks distributors such as C&C Group | Wholesale beer sales | Matching delivery coverage with hospitality orders | Coordinate depot and fleet capacity with delivery routes |
| Source: Mordor Intelligence | ||||
C&C Group distributes beer within a broader drinks operation serving hospitality customers in the United Kingdom and Ireland. Shared distribution can therefore support beer availability through delivery capacity used across several beverage categories. Together with contracts tied to future harvests, this creates scope for competition through coordination from ingredient supply to the outlet, alongside competition between individual beer brands.
Competitive Landscape
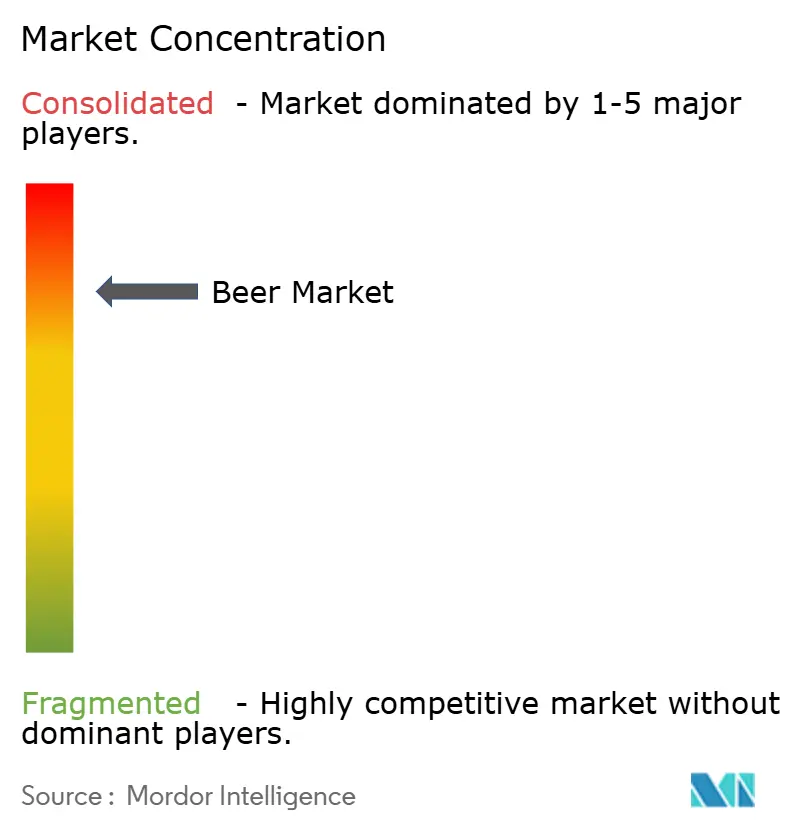
Competition centers on several multinational brewery groups, with brand ownership and operating reach shaping the barriers to a comparable beer offer. Major producers include Heineken N.V., Anheuser-Busch InBev SA/NV, Carlsberg Group, Molson Coors Beverage Company, and Asahi Group Holdings Ltd. On January 30, 2026, Heineken completed its acquisition of FIFCO’s beverage and retail businesses, strengthening its Central American presence.[3] Combining beverage operations with retail assets can link a producer’s regional position to a consumer-facing route for its products. Retail or distribution reach adds to the entry barrier because a challenger must reproduce consumer access alongside a competitive regional beer brand.
Digital commerce adds a separate layer of competition by connecting the brewer’s portfolio to repeated business-customer interactions. Anheuser-Busch InBev’s BEES platform generated more than 76 million e-commerce orders and USD 550 million in platform revenue in fiscal 2025, with revenue up 8% from fiscal 2024. At that scale, the customer interface can become an asset in its own right, giving a supplier another way to present beer within a wider commercial relationship. For challengers, access to business customers' recurring transactions becomes a competitive requirement alongside beer selection when a rival operates the ordering interface.
Future competition also depends on pairing brand rights with local operating capability under the required approvals. On July 6, 2026, Carlsberg Group and Sapporo Breweries agreed to a joint venture covering Carlsberg’s existing operations in Hong Kong, Singapore, Malaysia, Laos, Vietnam, and Cambodia. Carlsberg would retain operational control and Sapporo would hold a 25% stake, with perpetual exclusive Sapporo Premium Beer production and distribution rights applying on completion and under agreed license terms. The announcement made completion subject to regulatory approvals and customary closing conditions. This gives partners a way to combine a differentiated beer with an operating network, while approval-dependent execution determines when the proposed competitive offer can reach buyers.
Beer Industry Leaders
-
Heineken N.V.
-
Anheuser-Busch InBev SA/NV
-
Carlsberg Group
-
Molson Coors Beverage Company
-
Asahi Group Holdings Ltd
- *Disclaimer: Major Players sorted in no particular order
Beer Market Companies Covered in this Report
- Heineken N.V.
- Carlsberg Group
- Asahi Group Holdings Ltd
- Molson Coors Beverage Company
- Kirin Holdings Co. Ltd.
- Constellation Brands Inc.
- China Resources Snow Breweries Ltd
- Diageo Plc
- Boston Beer Company Inc.
- Tsingtao Brewery Co. Ltd.
- Anheuser-Busch InBev SA/NV
- Sapporo Holdings Ltd.
- Sierra Nevada Brewing Co.
- Beijing Yanjing Brewery Co., Ltd.
- D.G. Yuengling & Son Inc.
- Thai Beverage Public Company Limited
- B9 Beverages Limited
- Inbrew Beverages Private Limited
- San Miguel Corporation
Key Opportunities for Market Participants
The opportunities compare retail routes for selling beer that meets different alcohol-moderation requirements. On April 27, 2026, Ocado Retail reported that its mid-strength beer sales on Ocado.com were up 22% month on month. The Brewers Association reported 18.7% year-on-year volume growth for US craft nonalcoholic beer in 2025 in off-premise scan data. Alongside those lower-strength and craft sales signals, Heineken USA offers Heineken 0.0 as an alcohol-free beer in selected US states, establishing a familiar-brand proposition.
Market Opportunities Table of Beer Market
| Opportunity | Why now | Buyer / lead segment | Recommended play | Main barrier | Likely beneficiaries |
|---|---|---|---|---|---|
| Mid-strength beer for online moderation demand | Ocado reported mid-strength beer sales growth in April 2026 | UK online beer shoppers | Present a clearly identified mid-strength beer range | Converting initial trial into repeat demand | Mid-strength brewers and Ocado Retail |
| Specialist alcohol-free craft assortments | US off-premise craft nonalcoholic volume expanded in 2025 | US specialist beer retailers | Build a focused alcohol-free craft offer | Standing out among existing alcohol-free choices | Craft nonalcoholic brewers and specialist retailers |
| Familiar-brand alcohol-free choices | The 2025 craft volume gain accompanies an existing branded alcohol-free offer | US mainstream beer retail buyers | Offer alcohol-free beer beside a familiar parent brand | Differentiating the branded offer from specialist craft alternatives | Heineken USA and branded alcohol-free suppliers |
| Source: Mordor Intelligence | |||||
The central opening is strength-specific retail merchandising that lets brewers address the consumer’s chosen alcohol limit. Retailers can separate reduced-alcohol occasions from alcohol avoidance when deciding which beers to place together. The resulting assortment gives suppliers a route to compete on an explicit consumption requirement as well as brand familiarity.
Recent Industry Developments in Beer Market
- Sep 2026: Saothair Capital Partners completed its acquisition of CCR American Holdings, Inc. (FIFCO USA) from Distribuidora La Florida, S.A., a Heineken N.V. subsidiary. The acquired business announced that it would return to the North American Breweries name.
- Jul 2026: Carlsberg Group agreed with Sapporo Breweries to form a joint venture covering existing Carlsberg operations in Hong Kong, Singapore, Malaysia, Laos, Vietnam, and Cambodia. The agreement provided for perpetual exclusive Sapporo Premium Beer production and distribution rights in these markets, subject to completion, agreed license terms, regulatory approvals, and customary closing conditions.
- May 2026: Diageo opened Littleconnell Brewery in Newbridge, County Kildare, Ireland, to produce ales and lagers including Rockshore, Harp, Smithwick’s, and Kilkenny for Irish and international markets.
Beer Market Report Scope and Research Methodology
Market Definition and Coverage
The global beer market measures annual producer sales value for commercially produced beer sold worldwide through on-trade and off-trade channels. It covers all beer types, standard and premium categories, and bottles, cans, and other packaging forms across North America, Europe, Asia-Pacific, South America, and the Middle East and Africa.
Scope exclusions: Home-brewing kits, cider, hard seltzer, and pure contract-brewing service fees are excluded.
Segments Covered in This Report
- By Product Type
- Ale
- Lager
- Non/Low-Alcohol Beer
- Other Beer Types
- By Category
- Standard
- Premium
- By Packaging Type
- Bottles
- Cans
- Others
- By Distribution Channel
- On-Trade
- Off-Trade
- Specialty/Liquor Stores
- Others Off Trade Channels
- By Geography
- North America
- United States
- Canada
- Mexico
- Rest of North America
- Europe
- Germany
- France
- United Kingdom
- Spain
- Netherlands
- Italy
- Rest of Europe
- Asia-Pacific
- China
- India
- Japan
- Australia
- South Korea
- Rest of Asia-Pacific
- South America
- Brazil
- Argentina
- Rest of South America
- Middle East and Africa
- United Arab Emirates
- South Africa
- Saudi Arabia
- Rest of Middle East and Africa
- North America
Data Sources, Market Sizing, and Validation
Desk Research
Illustrative public evidence comes from sources such as the BarthHaas Report's country and regional production series, Kirin Holdings' Global Beer Consumption Report, Brewers Association sales and production statistics, and the World Health Organization's global alcohol reporting. These sources help compare brewing output, beer consumption, channel activity, and the policy context that may affect demand.
Company annual reports, regulatory filings, investor presentations, and reputable business press can supplement these public series and cross-check brewery sales, portfolio mix, pricing, capacity, and distribution developments. These named sources are not exhaustive, and further sources inform collection, validation, and clarification.
Primary Interviews and Surveys
Primary research would include brewery executives and commercial, finance, category, sales, and supply leaders, together with distributors and on-trade and off-trade channel managers. Interviews or structured surveys would test secondary evidence on realized pricing, product and channel mix, local demand, and capacity utilization, and would clarify gaps where public series use different definitions. Where expert explanations conflict with observed sales, production, or consumption indicators, analysts would keep assumptions separate and triangulate them against company disclosures and other independent records.
Distribution of primary research fieldwork respondents
| Company type | Respondent position | Region |
|---|---|---|
| Top tier: 30% | CXOs: 20% | APAC: 38% |
| Mid tier: 50% | Functional/Unit leaders: 30% | EMEA: 34% |
| Smaller Players: 20% | Managers: 50% | Americas: 28% |
Market-Sizing & Forecasting
The top-down estimate starts with global producer sales for commercially produced beer and assigns value to regions from country-level beer volume and producer-price evidence. Core indicators are beer volume, realized producer prices and product mix, channel mix, population and income, and tourism or regulatory changes that can alter drinking occasions. Where country production records and consumption series use different definitions, analysts reconcile them before interpreting regional demand. Historical product, category, packaging, channel, and regional shares are derived from relevant sales and production evidence, with producer revenue counted once in its eventual channel and other classifications treated as views of that sale. Multivariate regression relates regional beer value to volume, realized price and mix, population and income, while scenario analysis tests material changes in regulation or channel conditions. Selective bottom-up checks use disclosed brewer sales, sampled producer price times volume, and distributor or channel checks to test regional totals. Gaps are reconciled against broader country and production series, and experts would review variable-level forecast direction and commercial plausibility before assumptions are retained.
Data Validation & Update Cycle
Analysts triangulate producer sales against beer production, consumption, and country or regional market signals, while checking that product, package, and channel cuts reconcile to the same sales pool. They investigate unusual movements and large differences between independent sources, trace them to year, unit, price, or scope definitions, and document any adjustment before sign-off. A second analyst reviews source mapping, calculations, and assumptions, and analysts re-contact relevant respondents when a material input changes or an unresolved discrepancy could alter the market path. The model is refreshed annually, updated between cycles for material regulatory, demand, or industry events, and given a fresh source and variance review immediately before delivery.
Mordor Intelligence's Beer Market Estimate Compared With Other Published Estimates
Published estimates can differ in the transactions and products they count and the inputs used to model demand. The global beer market measures annual producer sales value for commercially produced beer sold worldwide through on-trade and off-trade channels.
Key Gap Drivers include the study's defined coverage and market-specific modeling choices. Core indicators are beer volume, realized producer prices and product mix, channel mix, population and income, and tourism or regulatory changes that can alter drinking occasions.
Benchmark comparison
| Source | Market Size | Gaps in Research Methodology |
|---|---|---|
| Mordor Intelligence | USD 0.89 T (2027) | |
| Global Consultancy A | USD 807 B (2025) | At its 2025 base, this estimate is 9.3% below this report's 2027 value of USD 0.89 T, 2 years later. The earlier measurement point places the estimate at an earlier stage of the market's value path. |
| Global Research Publisher B | USD 839.3 B (2024) | At its 2024 base, this estimate is 5.7% below this report's 2027 value of USD 0.89 T, 3 years later. The source's actual-data series ends before the current report year, so its value reflects an earlier market year. |
Mordor Intelligence's analysts triangulate producer sales against beer production, consumption, and country or regional market signals, while checking that product, package, and channel cuts reconcile to the same sales pool.
Key Questions Answered in the Report
What is the beer market size and growth outlook?
The size is forecast at USD 0.89 trillion in 2027 and USD 1.13 trillion in 2032, with 4.88% CAGR over 2027-2032.
What is supporting demand for beer?
Product innovation, hotel-stay drinking expectations, and ingredient-specific offers support demand. Australian gluten-free brewer TWØBAYS reported record monthly brewing and packing output in November 2025.
Which beer product type has the largest sales share?
Lager led with 87.08% of global producer beer sales value in 2026.
Which companies are major beer producers?
Major producers include Heineken N.V., Anheuser-Busch InBev SA/NV, Carlsberg Group, Molson Coors Beverage Company, and Asahi Group Holdings Ltd.
What challenge could limit beer growth?
Health-related moderation can limit drinking occasions. The United Kingdom uprated all Alcohol Duty rates by 3.66% from February 1, 2026, including non-draught and qualifying draught beer.
Which region leads beer sales and forecast growth?
Asia-Pacific held 30.26% of global producer beer sales value in 2026 and is forecast to grow at 5.3% CAGR over 2027-2032.