
Market Overview
| Study Period | 2021 - 2031 |
|---|---|
| Market Size (2026) | USD 142.78 Billion |
| Market Size (2031) | USD 239.61 Billion |
| Growth Rate (2026 - 2031) | 10.91 % |
| Fastest Growing Market | Asia-Pacific |
| Largest Market | North America |
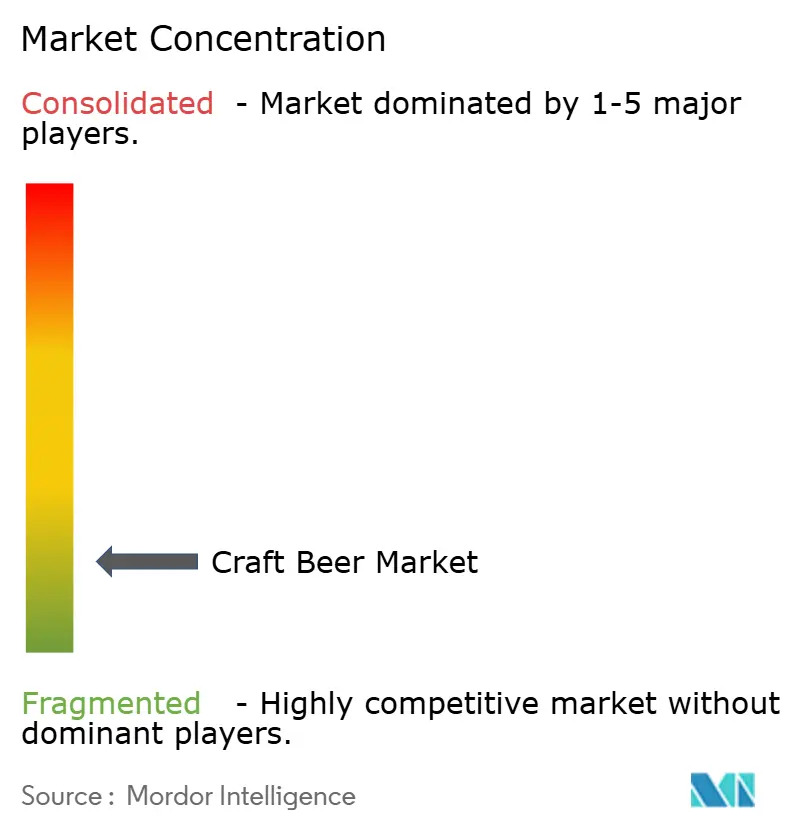
| Market Concentration | Low |
Major Players
*Disclaimer: Major Players sorted in no particular order Image © Mordor Intelligence. Reuse requires attribution under CC BY 4.0. |
|
Craft Beer Market Analysis by Mordor Intelligence
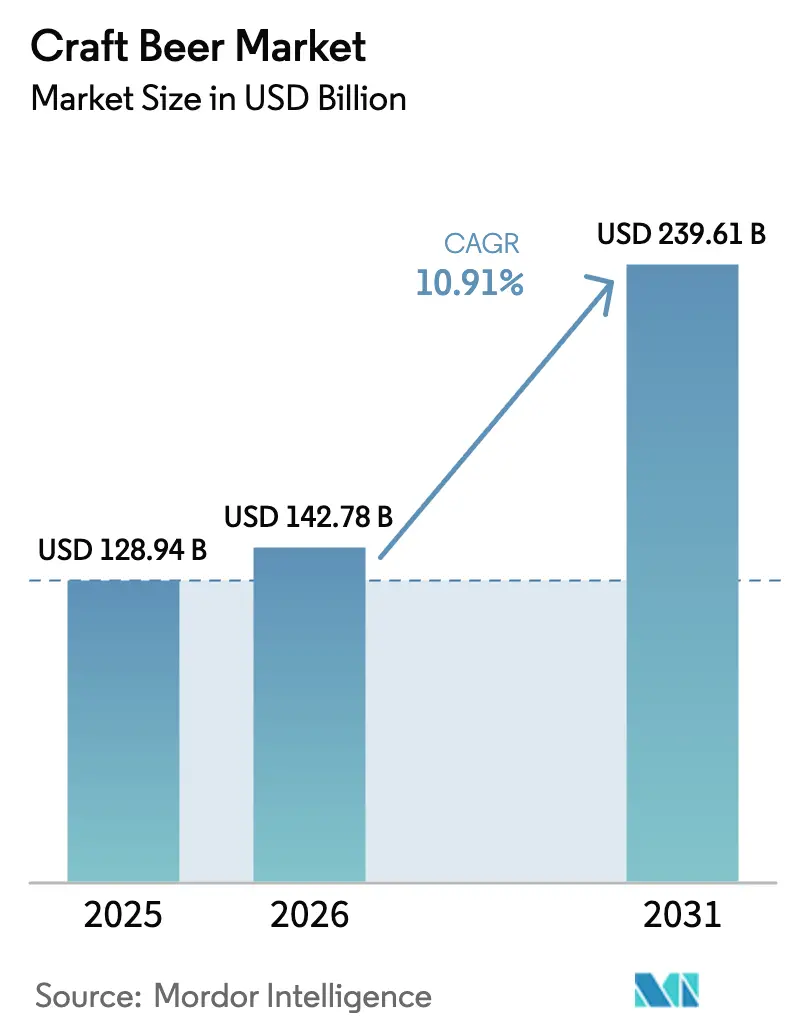
The Craft Beer Market size was valued at USD 128.94 billion in 2025 and estimated to grow from USD 142.78 billion in 2026 to reach USD 239.61 billion by 2031, at a CAGR of 10.91% during the forecast period (2026-2031). Premium positioning, format innovation, and growing female participation continue to offset mid-cycle volume softness in mature regions. North America holds the largest regional share, backed by a strong culture of locally brewed, ingredient-transparent offerings. The Asia-Pacific region shows the fastest regional growth, driven by urbanization and rising disposable income in China and India. Breweries are also capturing demand for low- and no-alcohol variants as health-conscious consumers seek moderation without sacrificing taste.
Key Report Takeaways
- By product type, ale led with 32.49% craft beer market share in 2025; lager is projected to expand at an 11.02% CAGR through 2031.
- By end user, men accounted for a 72.25% share in 2025; women are forecast to grow at an 11.42% CAGR to 2031.
- By packaging, cans captured 54.44% of the craft beer market size in 2025; bottles are anticipated to rise at an 11.56% CAGR through 2031.
- By distribution channel, on-trade venues held a 58.42% revenue share in 2025; online retail is expected to advance at an 11.87% CAGR through 2031.
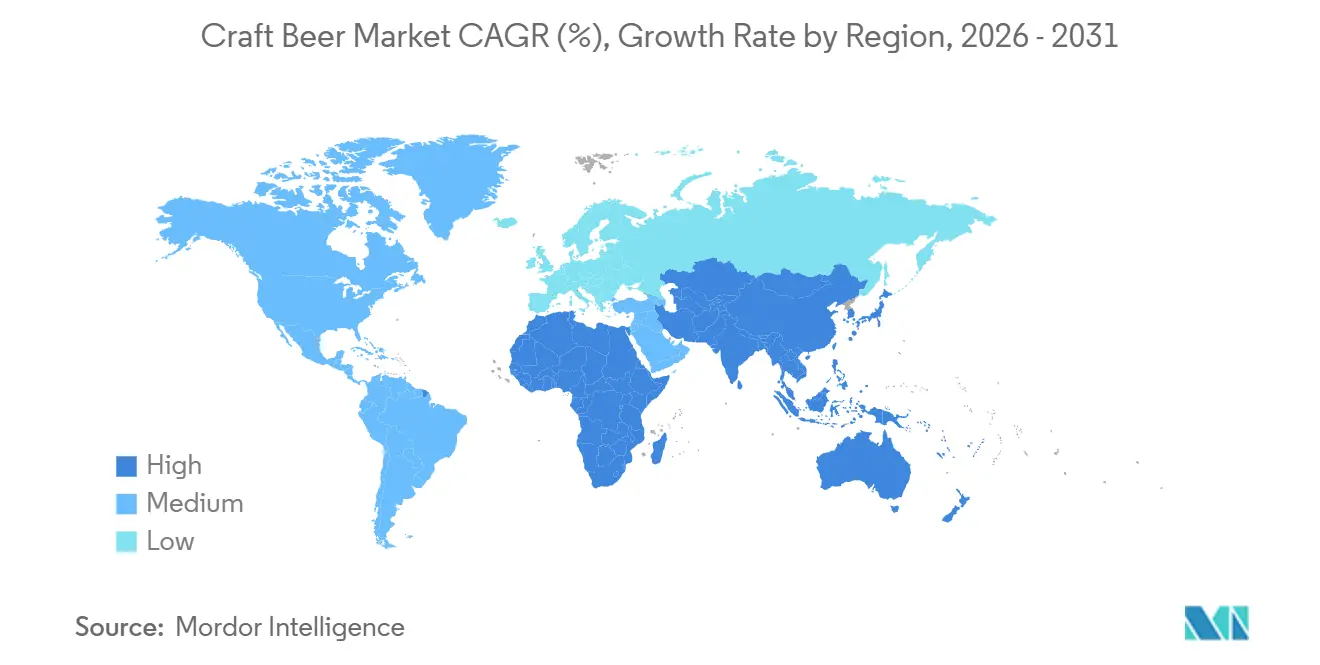
- By geography, North America led the global market with a 49.56% revenue share in 2025; the Asia-Pacific region is forecasted to be the fastest-growing, with a CAGR of 12.09% from 2026 to 2031.
Note: Market size and forecast figures in this report are generated using Mordor Intelligence’s proprietary estimation framework, updated with the latest available data and insights as of January 2026.
Market Trends and Insights
Drivers Impact Analysis of Craft Beer Market*
| Driver | (~) % Impact on CAGR Forecast | Geographic Relevance | Impact Timeline |
|---|---|---|---|
| Rising number of microbreweries due to strong demand | +1.8% | North America, Europe, Asia-Pacific | Medium term (2-4 years) |
| Product differentiation in terms of ingredients, flavors, and alcohol content | +2.1% | Global | Short term (≤ 2 years) |
| Surge in demand for low-alcohol beverages | +1.5% | Europe, North America, Asia-Pacific | Medium term (2-4 years) |
| Strategic expansion by pub and bar chains | +1.2% | North America, Europe, Asia-Pacific | Long term (≥ 4 years) |
| Growing tourism and hospitality sector | +0.9% | North America, Europe, Asia-Pacific | Medium term (2-4 years) |
| Technological advancement in terms of production | +1.0% | Global | Long term (≥ 4 years) |
| Source: Mordor Intelligence | |||
Rising number of microbreweries due to strong demand
The craft beer market has seen substantial growth driven by the rising number of microbreweries, which have become a cornerstone of the industry’s expansion. According to the Brewers Association, the number of craft breweries in the United States grew from 9,092 in 2020 to 9,906 by 2023, reflecting a broader consumer shift toward locally produced, small-batch beers with distinct flavor profiles[1]Brewers Association, "Total number of breweries in the United States from 2012 to 2023", www.brewersassociation.org. This expansion reflects consumer interest in authentic products, traditional brewing methods, and local community connections. Many facilities now include taprooms and host events featuring local food vendors, artists, and musicians, creating community gathering places that strengthen customer relationships and increase market presence. Microbreweries are incorporating technology to improve operations while maintaining their artisanal production methods. They use automated fermentation controls, brewing sensors with IoT capabilities, and predictive maintenance systems to ensure consistent quality and reduce waste. This technological integration enables microbreweries to expand efficiently, improve profitability, and adapt to market changes while maintaining their traditional brewing practices.
Product differentiation in terms of ingredients, flavors, and alcohol content
Craft breweries have strategically adopted product differentiation to gain competitive advantages by developing innovative offerings that extend beyond traditional beer varieties. The market exhibits a significant shift toward experimentation, particularly through the introduction of fruit-flavored and confectionery-flavored beers that resonate with younger consumers seeking distinctive taste experiences. Premium segments have witnessed the integration of functional ingredients, with breweries incorporating adaptogenic compounds and health-focused additives to establish unique market positions. To accommodate diverse consumer preferences, breweries have systematically expanded their portfolio to include both high-ABV specialty beers and lower-alcohol session beers. Local sourcing has become increasingly important, as evidenced by a Penn State Extension study that found that over 51% of Pennsylvania craft brewers were somewhat or extremely likely to purchase locally grown hops, and 65% were considering local purchases of fruits and vegetables for their beer production[2]PennState Extension, "Improving the Agricultural Value Chain in Pennsylvania Craft Beer", www.extension.psu.edu. This comprehensive differentiation approach enables craft breweries to maintain market competitiveness through strategic product iterations and limited-edition releases, effectively generating consumer interest while supporting premium pricing structures that compensate for elevated production costs.
Growing tourism and hospitality sector
Brewery tourism has become a meaningful economic engine, particularly in smaller and secondary markets. In Iowa, it generated USD 195 million in economic output and supported 2,042 jobs in 2024, highlighting how craft breweries can act as anchor attractions for local communities, according to Iowa State University. Across the U.S., the craft beer industry generated an estimated USD 77.1 billion in economic impact in 2024, with a substantial portion attributed to tourism-related spending. Taprooms and brewery tours play a critical role in this cycle, turning visitors into long-term brand advocates who continue purchasing packaged products after their visits, as noted by the Brewers Association. In Europe, the recovery of on-premise consumption has been uneven. Germany produced 7.2 billion liters of beer in 2024; however, sales fell 6.3% in the first half of 2025, indicating that tourism inflows have not fully compensated for weaker domestic demand, according to the Statistisches Bundesamt (Destatis)[3]Source: Destatis, “Beer Production Statistics,” destatis.de. By contrast, Asia-Pacific markets are earlier in their development but are gaining momentum. In China, urban consumers aged 25 to 35 in first- and second-tier cities are driving demand for premium beer, with CR Beer reporting a 60% year-over-year growth in its e-commerce channel in the first half of 2024. Thailand’s craft beer tourism scene is also emerging as a niche attraction, although comprehensive data are still limited. Overall, the close link between hospitality recovery and craft beer volumes suggests that brewers stand to benefit from co-investing in destination marketing alongside local tourism boards, extending reach without a proportional increase in marketing spend.
Technological advancement in terms of production
AB InBev’s Four Peaks brewery in Arizona introduced CIRT QR-code recycling programs in 2024, which helped divert 3.5 million pounds of waste, directly linking consumer participation to measurable sustainability outcomes. Grupo Modelo, in collaboration with WestRock, has replaced traditional plastic six-pack rings with CanCollar Eco paperboard, reducing plastic usage by more than 100 metric tons annually while maintaining durability throughout the supply chain. Stadshaven has taken a different approach, adopting direct-to-can digital printing and sleeveless can formats to reduce material use and support small-batch, limited-edition releases. At the materials level, Ball Corporation’s long-term lightweighting efforts have reduced aluminum can weight by 40% since 1970; however, U.S. recycling rates have stalled at around 54%, indicating that infrastructure gaps, rather than material science, are the primary bottleneck. According to EY’s March 2025 report, the rapid expansion of SKUs has tripled operational complexity for mid-sized brewers, accelerating the shift toward contract brewing and asset-light models that rely on regional co-packers. High automation costs further widen the gap between large brewers, who can spread robotics investments across scale, and smaller independents, who increasingly face consolidation pressures to remain competitive.
Restraints Impact Analysis of Craft Beer Market*
| Restraint | (~) % Impact on CAGR Forecast | Geographic Relevance | Impact Timeline |
|---|---|---|---|
| Stringent government regulations | -1.1% | Global, with heightened enforcement in North America (TTB, FDA), Europe (EU alcohol directives), Asia-Pacific (licensing complexity) | Medium term (2-4 years) |
| Health issues from excessive consumption | -0.8% | North America, Europe, emerging in Asia-Pacific urban centers | Short term (≤ 2 years) |
| Consumers' inclination toward functional beverages | -0.6% | North America, Europe, Asia-Pacific (kombucha, probiotic drinks) | Medium term (2-4 years) |
| Skilled labor shortages in brewing operations | -0.5% | North America, Europe (Germany, Netherlands, UK) | Long term (≥ 4 years) |
| Source: Mordor Intelligence | |||
Consumers inclination towards functional beverages
The U.S. functional-beverage market is being propelled by kombucha, probiotic drinks, and adaptogen-based formulations positioned around gut health, immunity, and stress reduction. These products often share refrigerated shelf space with craft beer in natural-foods retailers, putting them in direct competition for health-oriented consumers who increasingly see alcohol as incompatible with wellness-focused lifestyles. While NoLo beer buyers tend to remain active purchasers of full-strength beer, functional beverages appeal to a different segment that has completely exited alcohol, limiting the crossover potential. Kombucha, in particular, benefits from its fermentation process and probiotic narrative, reinforcing its image as a “better-for-you” option, one that craft beer struggles to counter without moving toward low-calorie or low-ABV formulations that can blur brand identity. The 2025 Dietary Guidelines, with their emphasis on nutrient density, further legitimize functional beverages while indirectly downplaying the role of alcohol. As a result, craft brewers face a strategic choice: attempt to borrow functional cues through the addition of botanicals, probiotics, or vitamins, or accept that part of their former addressable market has permanently shifted to non-alcoholic wellness alternatives.
Stringent Government Regulations
In the United States, the Alcohol and Tobacco Tax and Trade Bureau requires brewers to secure a Brewer’s Notice, post production-linked bonds, and obtain formula approval for beers made with non-traditional ingredients or processes. These requirements weigh most heavily on smaller entrants without in-house legal and compliance resources. The federal excise tax structure adds another constraint, with a reduced rate of USD 3.50 per barrel applying only to the first 60,000 barrels, before jumping to USD 16 per barrel up to 2 million barrels, creating a sharp growth threshold that discourages scaling beyond a regional footprint[4]Source: U.S. Alcohol and Tobacco Tax and Trade Bureau, “Brewer’s Notice Requirements,” ttb.gov. At the state level, California’s Type 23 license caps small brewers at 60,000 barrels per year, pushing growth-oriented operators to either limit output or manage complex, multi-state licensing regimes, each with its own labeling and distribution rules. Regulatory complexity is also increasing internationally. The World Health Organization’s 2024 advisory on low- and no-alcohol beverages highlighted the lack of standardized ABV definitions, with “non-alcoholic” thresholds ranging from 0.0% to 0.5% across markets, which complicates cross-border expansion. In parallel, the U.S. Surgeon General’s December 2024 recommendation to update warning labels to reflect links between alcohol consumption and multiple cancer types raises the likelihood of new legislation, potentially increasing packaging costs and affecting consumer perceptions. Taken together, these overlapping regulatory layers tend to protect established players with dedicated compliance teams, while slowing innovation and growth for smaller, undercapitalized brewers.
*Our forecasts treat driver/restraint impacts as directional, not additive. The impact forecasts reflect baseline growth, mix effects, and variable interactions.
Craft Beer Market Segment Analysis
By Product Type:
Lager Gains Ground on Premium PositioningAle captured 32.49% of the market in 2025, driven primarily by Anglo-American preferences for hoppy IPAs, session bitters, and cask-conditioned beers that dominate UK pub menus. The category skews older and male, with 49% of consumers aged 50-plus and 87% male, and these drinkers exhibit higher experimentation than typical lager consumers. However, ale’s intense flavor profile limits mainstream adoption, restricting growth outside its core enthusiast base. Meanwhile, stouts, porters, sours, and hybrid styles are gradually expanding share, with UK stout volumes rising in early 2025 as younger and female consumers embrace the category, signaling a demographic shift that challenges ale’s historical dominance in premium on-premise channels. Brewers are responding by innovating hybrid styles, such as black IPAs, coffee stouts, and fruited sours, that blur traditional category lines to appeal to variety-seeking drinkers.
Lager, by contrast, is set to grow at an 11.02% CAGR through 2031, driven by European and Asian consumers favoring crisp, lower-hopped profiles. Germany produced 7.2 billion liters in 2024, representing 22.2% of EU output, while China’s premiumization wave pushed mid-to-high-end lagers past 50% of CR Beer’s volume in the first half of 2024. Lager’s versatility across climates and food pairings makes it the preferred entry point for first-time craft consumers, reflected in CR Beer’s e-commerce growth of 60% year-over-year, where larger SKUs dominate. Overall, the market is converging toward a barbell structure, with mass-market lagers at one end, ultra-premium limited editions at the other, and mid-tier ales gradually ceding share to both extremes.




By End User:
Women Drive Growth in Male-Dominated MarketMen accounted for 72.25% of beer consumption by volume in 2025, reflecting longstanding patterns in which beer is the default social beverage for male cohorts across various age groups. Women, by contrast, are projected to grow at an 11.42% CAGR through 2031, a trend reinforced by the UK stout category’s success in attracting female drinkers who historically avoided darker beers due to perceived bitterness and higher caloric content. Brewers are adjusting marketing strategies to appeal to women without relying on overtly gendered messaging, with brands like Samuel Adams American Light and Miller Extra Light emphasizing calorie-consciousness and wellness-oriented positioning. Packaging innovations, including sleeker cans, botanical label art, and smaller serving sizes, further signal inclusivity, although distribution remains concentrated in male-dominated on-premise venues.
The rise of female and health-conscious consumers is also reflected in NoLo and low-ABV formats, with 61% of Gen Z Americans actively reducing alcohol intake, women representing a higher share of this cohort. Taprooms that integrate food pairings, non-alcoholic options, and family-friendly environments are capturing mixed-gender audiences, broadening occasions beyond traditional male-centric sports viewing or after-work drinking. Overall, the end-user segmentation is shifting from a predominantly male market toward a bifurcated model, where men continue to drive volume while women increasingly influence premiumization, format innovation, and diversified consumption occasions.
By Packaging:
Aluminum Tariffs Test Can DominanceCans accounted for 54.44% of craft beer packaging in 2025, driven by aluminum’s infinite recyclability, portability, and innovations such as direct-to-can printing, which support micro-batch customization. Bottles, although a smaller share, are projected to grow at an 11.56% CAGR through 2031, maintaining their premium positioning in specialty retail, where glass conveys craftsmanship and heritage, particularly for abbey ales, barrel-aged stouts, and cork-finished vintages. Other formats, including kegs, growlers, and crowlers, serve on-premise and refill channels, with brewers like AB InBev targeting 100% returnable or recycled-content packaging by 2025 to meet sustainability commitments. Grupo Modelo’s CanCollar Eco paperboard replaced plastic six-pack rings in 2024, eliminating over 100 metric tons of plastic and reinforcing the brand’s appeal to environmentally conscious consumers.
Aluminum tariffs, particularly on Canadian imports which supply roughly 10% of U.S. cans, pose a potential margin risk, threatening the format’s cost advantage over glass. Ball Corporation’s aluminum lightweighting has reduced can weight by 40% since 1970, yet the U.S. recycling rate has plateaued at 54%, signaling that infrastructure investment, not material innovation, is the limiting factor. Glass bottles face breakage and higher shipping costs but preserve hop aromatics and prevent skunking, creating a technical edge that supports premium pricing. Meanwhile, Stadshaven’s sleeveless cans and digital printing reduce material waste while enabling limited-edition SKUs with higher margins. Overall, the packaging landscape is bifurcating: cans dominate volume and convenience occasions, bottles anchor premiumization and gifting, and refillable formats are gaining traction in sustainability-focused niches. Brewers must carefully balance tariffs, recycling infrastructure, and consumer perceptions to optimize both margin and brand equity.

By Distribution Channel:
Online Retail Disrupts Three-Tier LogicOn-trade channels, including bars, pubs, and taprooms, accounted for 58.42% of craft beer distribution in 2025, leveraging experiential differentiation that retail cannot replicate. However, Europe’s on-trade share fell from one-third to one-quarter of total beer consumption between 2019 and 2024, a structural shift accelerated by pandemic-era habit formation, according to Brewers of Europe. Off-trade channels, comprising supermarkets, liquor stores, and convenience outlets, captured the remainder, while online retail is projected to grow at an 11.87% CAGR through 2031, fueled by direct-to-consumer platforms and subscription models that bypass traditional three-tier distribution. CR Beer’s e-commerce channel in China expanded 60% year-over-year in H1 2024, appealing to urban millennials who value convenience and product variety over in-store browsing.
Brewers are testing hybrid strategies to balance on-premise and off-premise exposure. Heineken invested GBP 39 million to reopen 62 UK pubs and refurbish over 600 locations, betting on experiential venues to regain market share from the off-trade. However, BrewDog’s closure of six UK bars in 2024, amid a GBP 60 million loss, highlights the vulnerability of capital-intensive models to demand fluctuations. Online retail growth depends heavily on regulatory frameworks, as U.S. state restrictions on direct-to-consumer alcohol shipments fragment the addressable market and increase compliance costs. Franchised chains like The Brass Tap are expanding in suburban markets with limited on-premise competition, exploiting geographic white space while relying on consumers’ willingness to pay premiums. Overall, distribution is shifting toward a hybrid model: on-premise venues act as brand-building theaters, off-trade serves convenience occasions, and online retail caters to variety-seeking consumers willing to pay for limited-edition SKUs. Brewers that integrate these channels, such as linking taproom experiences to online subscriptions via QR codes, are positioned to capture disproportionate lifetime value from highly engaged customers.
Geography Analysis
North America Craft Beer Market
North America led the craft beer market in 2025, with a 49.56% share, largely driven by the United States, which boasted 9,736 craft breweries generating USD 77.1 billion in economic impact and supporting 460,000 jobs, despite a net loss of 64 units as closures outpaced openings, according to the Brewers Association. Canada and Mexico add incremental volume, with Mexico’s Grupo Modelo implementing sustainability measures, such as the CanCollar Eco paperboard, which eliminates over 100 metric tons of plastic annually. Although craft production experienced a 2% midyear decline in 2024, premiumization trends remain strong, exemplified by Constellation Brands’ Modelo Especial achieving the top U.S. beer brand position by dollar sales in Q2 FY2025. Brewery tourism also contributes significantly, with Iowa generating USD 195 million in output and supporting 2,042 jobs (Iowa State University). Regulatory developments, including the U.S. Surgeon General’s December 2024 advisory linking alcohol to cancer, could influence consumption patterns, making innovation in NoLo formats and experiential on-premise venues critical to offset potential declines among health-conscious consumers.
Europe Craft Beer Market
Europe produced 34.7 billion liters of beer in 2024, with alcoholic volumes increasing slightly by 0.6% year-over-year, while non-alcoholic beer grew 11.1%, reaching 7.5% of total consumption, a 25% rise over five years (Brewers of Europe). Germany led production at 7.2 billion liters but experienced a 6.3% sales decline in H1 2025 (Destatis). Other European markets face structural and regulatory pressures: the Netherlands saw its first brewery contraction since 2010, while Belgium and the Netherlands maintain premium pricing for abbey ales and Trappist beers. Brewers such as Heineken are pursuing dual strategies, investing GBP 39 million to refurbish UK pubs while expanding zero-proof portfolios, reflecting a shift in consumption as Europe’s on-trade share fell from one-third to one-quarter of total beer consumption between 2019 and 2024, favoring off-trade and online channels (Brewers of Europe).
APAC, South America and MEA Craft Beer Market
Asia-Pacific, South America, and Middle East and Africa represent dynamic, rapidly evolving markets. APAC is projected to grow at a 12.09% CAGR through 2031, driven by urbanization, rising disposable incomes, and the emergence of on-premise culture. China’s beer market reached USD 134.1 billion in 2025, with premium lagers exceeding 50% of CR Beer’s volume and e-commerce growing 60% YoY (CR Beer), while India’s craft segment is supported by Bira 91’s USD 60-70 million expansion. Australia and Japan emphasize premiumization and overseas growth despite volume declines, while Southeast Asia, including the Philippines, Thailand, and Vietnam, records steady gains. In South America, Brazil, Argentina, Chile, and Colombia remain core craft markets, with premium brands driving growth amid macroeconomic volatility and regulatory complexity. The Middle East and Africa is fragmented due to cultural norms, licensing restrictions, and infrastructure constraints: South Africa and the UAE host emerging craft scenes, Saudi Arabia bans alcohol entirely, and Nigeria, Egypt, Morocco, and Turkey face distribution and regulatory hurdles. Across these regions, market growth relies on navigating regulatory barriers, investing in infrastructure, educating consumers, and balancing premiumization with accessibility to capture emerging demand.

Regulatory Landscape
Regulation remains a key constraint for craft brewers, particularly around licensing, labeling, formula approvals for non-traditional ingredients, and excise reporting requirements that are difficult to absorb for smaller teams. In the United States, the Alcohol and Tobacco Tax and Trade Bureau (TTB) continues to run its Beer Tax Simplification Pilot Program through Pay.gov. By March 2026, the TTB indicated that more than 200 breweries were participating, pointing to a regulator-led effort to consolidate and streamline excise tax and operational reporting.
Internationally, compliance fragmentation persists around alcohol labeling and product safety standards. In May 2026, the Codex Committee on Food Labelling did not advance new international alcohol labeling work, while the Eurasian Economic Commission postponed enforcement of its technical regulation on the safety of alcoholic products to January 1, 2027. In India, amendments published March 30, 2026 to the Food Safety and Standards (Labeling and Display) Regulations set a compliance date of July 1, 2027, adding another major labeling regime for exporters to manage alongside U.S. and EU requirements.
Competitive Landscape
The craft beer market demonstrates moderate fragmentation, with the top five players, Anheuser-Busch InBev, Heineken, Boston Beer, Molson Coors, and Constellation Brands, dominating innovation pipelines and distribution networks, while regional independents defend share through hyperlocal branding, taproom experiences, and ingredient transparency. Incumbents are pursuing dual strategies: premiumization via NoLo variants, exemplified by Heineken 0.0’s 18.2% growth in H1 2024 and AB InBev’s Beyond Beer segment expanding 12.8% in Q3 2024, alongside experiential on-premise investments, such as Heineken’s GBP 39 million UK pub refurbishment and BrewDog’s franchising pivot.
White-space opportunities exist around female consumers, forecasted to grow at 11.42% CAGR through 2031, and online retail, projected to grow at an 11.87% CAGR, though capital requirements for omnichannel integration and fragmented U.S. state regulations pose execution challenges. Emerging disruptors include Bira 91, investing USD 60–70 million in Indian capacity to capture the early-stage market, and contract-brewing platforms that enable asset-light entrants to scale without owning production facilities. Technology adoption is creating a clear sector bifurcation. AB InBev’s Four Peaks CIRT QR-code recycling program and Grupo Modelo’s CanCollar Eco paperboard demonstrate how sustainability initiatives can double as consumer-engagement tools, while Stadshaven’s digital direct-to-can printing enables micro-batch customization commanding premium pricing.
SKU proliferation, as EY noted in March 2025, has tripled operational complexity, pushing mid-sized brewers toward contract brewing and asset-light models, concentrating production among co-packers with scale efficiencies. Regulatory compliance under the U.S. Alcohol and Tobacco Tax and Trade Bureau, including formula approvals for non-traditional ingredients under 27 CFR Part 25, creates a moat favoring incumbents with dedicated legal teams and limiting innovation for undercapitalized entrants. Private equity activity, including Tilray Brands’ acquisition of eight craft breweries from AB InBev and Sapporo’s purchase of Stone Brewing, signals accelerating consolidation, though regional independents with loyal taproom followings remain insulated due to their experiential differentiation.
Craft Beer Industry Leaders
-
Heineken NV
-
The Boston Beer Company Inc.
-
Molson Coors Beverage Company
-
Constellation Brands, Inc
-
Anheuser-Busch InBev SA/NV
- *Disclaimer: Major Players sorted in no particular order
Craft Beer Market Companies Covered in this Report
- Anheuser-Busch InBev SA/NV
- Heineken N.V.
- Molson Coors Beverage Company
- Boston Beer Company Inc.
- Constellation Brands Inc.
- D.G. Yuengling and Son Inc.
- Kirin Holdings Co.Ltd
- Sierra Nevada Brewing Co.
- BrewDog plc
- Sapporo Holdings Ltd.
- Monster Beverage Corporation (Oskar Blues Brewery)
- Deschutes Brewery
- Artisanal Brewing Ventures
- Tsingtao Brewery Co.,Ltd.
- Thai Beverage Public Limited Company
- Diageo Plc
- Asahi Group Holdings Ltd
- Brooklyn Brewery Corp.
- Victory Brewing Company
- San Miguel Corporation

Market Opportunities and Future Outlook
Asset sharing and consolidation are creating practical scale routes in mature craft markets, where utilization is uneven and fixed costs remain high. In the United States, the Brewers Association reported 2025 craft production of 22,034,000 barrels and an average capacity utilization of 55%, creating whitespace for contract brewing, shared production footprints, and mergers that combine distribution reach with brewing assets. In 2026, Half Acre Beer Company and Maplewood Brewery & Distillery announced a merger aimed at sharing production and distribution infrastructure, while Pollyanna Brewing & Distilling acquired Alarmist Brewing and its 11,000-square-foot Chicago facility, along with stated site upgrades and capacity expansion.
Premiumization is also being pursued through technology-enabled differentiation and sustainability-led product storytelling that supports taproom and specialty retail price points. In March 2026, Aircapture and Almanac Beer Co. launched a craft beer carbonated with atmospheric CO2 captured onsite using a modular direct air capture system in Alameda, California, signaling a pathway to decarbonize a visible process step while supporting consumer-facing storytelling. Brewing science developments are adding another value-creation avenue, including the July 2026 report of a traditionally bred, non-GM yeast strain (ADHorn49) designed to increase ornithine levels in craft beer, aligning with continued experimentation in ingredients and fermentation outcomes.
Recent Industry Developments in Craft Beer Market
- May 2026: The Boston Beer Company launched LYTT Electric Coolers, a 15% ABV ready-to-drink beverage packaged in lightbulb-shaped, glow-in-the-dark, recyclable containers across select US markets. The move extends the companys participation in beyond-beer occasions and tests differentiated packaging as a shelf-disruption tactic in convenience-led channels.
- March 2026: Tilray acquired the BrewDog US brand, including a brewery and three pubs, expanding its US craft footprint through owned production and on-premise assets. The transaction reflects continued portfolio rotation and M&A as operators pursue scale efficiencies and higher-margin hospitality revenue streams.
- September 2024: Mash Gang was acquired by non-alcoholic beverage platform DioniLife, providing additional backing for expansion beyond its home market. The deal strengthened distribution and commercialization capacity for experimental non-alcoholic beer offerings, increasing competitive pressure around moderation-adjacent line extensions in craft portfolios.


Craft Beer Market Report Scope and Research Methodology
Market Definition and Coverage
The craft beer market is defined as the value of beer sales from small-scale and independently owned breweries that sell full-flavored beers made using traditional or innovative brewing methods, across on-trade and off-trade channels.
Scope exclusions: We exclude non-alcoholic beer, cider, flavored malt beverages, and contract-brewed products sold under a large brewery license.
Segments Covered in This Report
-
By Product Type
- Ale
- Lager
- Other Beer Types
-
By End User
- Men
- Women
-
By Packaging
- Bottles
- Cans
- Others
-
By Distribution Channel
- On-Trade
- Off-Trade
-
By Geography
-
North America
- United States
- Canada
- Mexico
- Rest of North America
-
Europe
- Germany
- United Kingdom
- Italy
- France
- Spain
- Netherlands
- Poland
- Belgium
- Sweden
- Rest of Europe
-
Asia-Pacific
- China
- India
- Japan
- Australia
- Indonesia
- South Korea
- Thailand
- Singapore
- Rest of Asia-Pacific
-
South America
- Brazil
- Argentina
- Colombia
- Chile
- Peru
- Rest of South America
-
Middle East and Africa
- South Africa
- Saudi Arabia
- United Arab Emirates
- Nigeria
- Egypt
- Morocco
- Turkey
- Rest of Middle East and Africa
-
North America
Data Sources, Market Sizing, and Validation
Desk Research
Desk research was used to build the basic structure of demand and supply signals that sit behind craft beer value. We reviewed public sources such as Brewers Association releases and annual statistics, Alcohol and Tobacco Tax and Trade Bureau materials for labeling and category rules, USDA and national statistics offices for consumer and income indicators, and UN Comtrade style trade series for beer import and export direction.
In parallel, we used company filings and investor presentations from listed brewers, distributor disclosures, and reputable press coverage to understand packaging shifts, route-to-market changes, and pricing movement at a practical level. Patents and peer-reviewed brewing science publications were checked mainly to confirm product trends, including specialty styles, rather than to directly size revenues. Select paid subscriptions were used only for company financials and for shipment-level trade checks where public data had delays. These sources are illustrative and not exhaustive, and we also drew on other public references for data collection, cross-checking, and clarification.
Primary Interviews and Surveys
Primary work focused on validating the real-world split between on-trade and off-trade, the pricing ladder by pack type, and how the definition of craft is applied across regions. We spoke with a mix of brewers, ingredient and packaging participants, distributors, and retail or bar decision-makers, so the assumptions from desk research could be corrected and the final totals triangulated across the full value chain.
Distribution of primary research fieldwork respondents
| Company type | Respondent position | Region |
|---|---|---|
| Top tier: 38% | CXOs: 16% | APAC: 38% |
| Mid tier: 44% | Functional/Unit leaders: 36% | EMEA: 37% |
| Smaller Players: 18% | Managers: 48% | Americas: 25% |
Market-Sizing & Forecasting
Sizing starts with a top-down build where beer consumption and sales value are reconstructed by geography using a craft share assumption anchored to channel mix and typical craft pricing. From there, the model is shaped using practical inputs such as on-trade versus off-trade split, average selling price movement by packaging (draft, bottles, cans, and multipacks), premiumization rate, number of active craft breweries and brewpubs, and style mix shifts toward specialty beers.
To keep totals from drifting, we use selective bottom-up approximations as checks, such as sampling brewery revenue ranges from public filings, using distributor and retailer channel checks for craft shelf space and turnover, and validating that implied volumes align with reported production direction where available. Where direct data is thin, gaps are handled by using proxy markets with similar channel structures, then scaling by income and the legal drinking-age population, which are reviewed with experts before assumptions are locked.
For forecasting, we rely mainly on scenario analysis supported by a simple multivariate regression view on demand drivers like real disposable income, on-trade recovery, and premium beer price inflation. The forecast path is adjusted when primary respondents describe expected step changes, including tax changes, new taproom rules, or distribution consolidation that can alter sell-through in a specific region.
Data Validation & Update Cycle
Validation happens through triangulation across at least three angles, which typically include channel mix, implied volumes, and price progression. Analysts run variance checks by region and by channel, then investigate outliers such as sudden pricing jumps or share gains that do not match production, trade, or retail signals.
Before sign-off, the model and assumptions go through multi-step internal reviews, and re-contact is triggered if a key input moves beyond a defined tolerance band during review. Reports are refreshed annually, and interim updates are done when major events occur, such as regulatory changes, major channel disruptions, or clear pricing shocks. Right before delivery, analysts scan the newest public releases so the final view reflects the latest market direction.
Mordor Intelligence's Craft Beer Market Size Versus Other Published Estimates
Published craft beer market values often differ because each publisher sets its own definition of craft, chooses a price and channel mix approach, and picks a base year that can sit in a different demand cycle. The differences get larger when parts of the beer universe are added or removed, like adjacent malt beverages or non-alcoholic variants.
The biggest gap drivers usually come from scope and pricing logic. Some published totals appear to be built from a broad "craft-like" premium beer pool, which can pull in products that look similar on the shelf, and then apply a generalized price trend. In Mordor Intelligence, only beer that meets the small-scale and independence criteria is counted, and non-alcoholic beer, cider, flavored malt beverages, and contract-brewed products under a large brewery license are left out so the value stays tied to true craft revenue.
Benchmark comparison
| Source | Market Size | Gaps in Research Methodology |
|---|---|---|
| Mordor Intelligence | USD 128.94 B (2025) | |
| Global Consultancy A | USD 113.58 B (2025) | The estimate appears more conservative on channel pricing and may treat on-trade recovery and premiumization as slower, which lowers the implied average selling price for craft-heavy mixes. |
| Syndicated Insights B | USD 94.16 B (2025) | The scope and conversion approach are not clearly stated, and the value may be derived from volume-led tables with simpler price assumptions, which can understate craft value in markets with high draft and specialty mix. |
Across the three figures, the spread is mainly explained by how craft is defined, how on-trade value is treated, and how price progression is applied across packaging. By keeping inputs tied to observable signals like channel mix, brewery activity, and realistic pricing ladders, the final number remains traceable and can be repeated year to year with the same steps.


Key Questions Answered in the Report
What is the current value of the craft beer market?
The craft beer market size stands at USD 142.78 billion in 2026 and is forecast to reach USD 239.61 billion by 2031.
How fast is the market expected to grow?
It is projected to register a 10.91% CAGR during 2026-2031, led by premiumization and expanding low-alcohol lines.
Which region holds the largest share?
North America commands nearly half of global revenue owing to a dense network of local breweries and strong taproom culture.
What is the fastest-growing region?
Asia-Pacific shows the highest forecast growth, with a 12.09% CAGR through 2031 driven by China and India.
Which product type is expanding the quickest?
Lager is projected to grow at an 11.02% CAGR as crisp, lower-hopped profiles gain favor among new craft consumers.
How are health trends influencing the sector?
Rising awareness of alcohol-related health risks accelerates demand for low- and no-alcohol variants, prompting major brewers to scale zero-proof portfolios.
Page last updated on:


 Your data is secure and never sold or shared.


