Barge Transportation Market Size and Share
Market Overview
| Study Period | 2020 - 2031 |
|---|---|
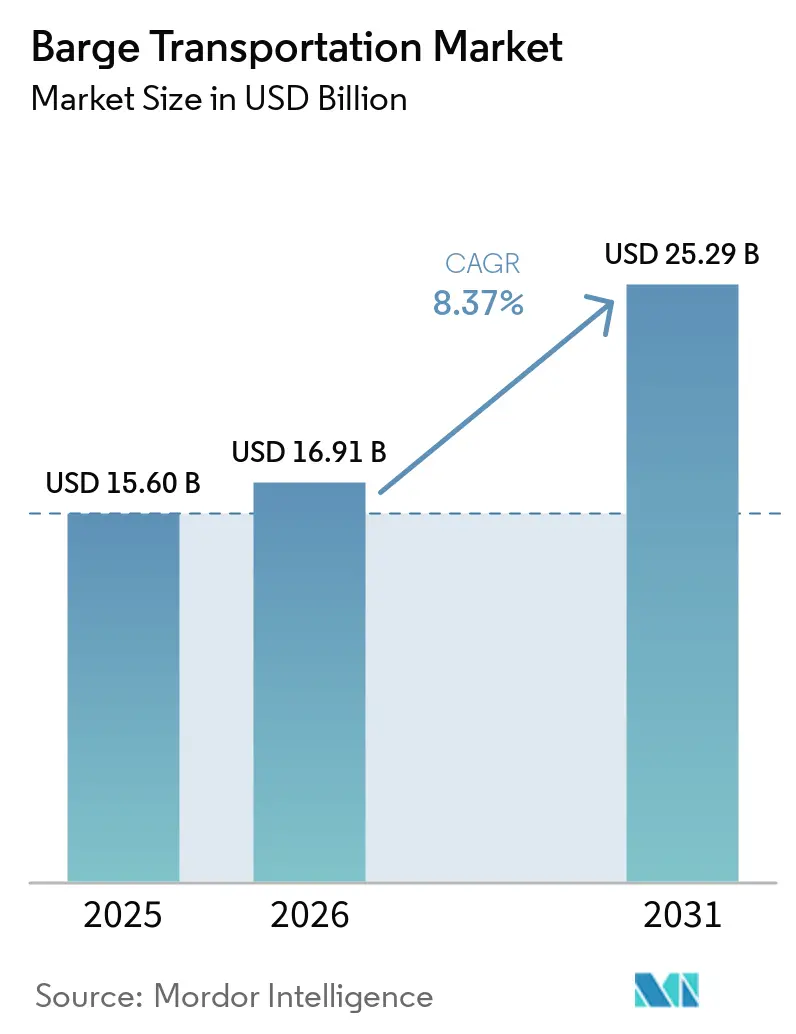
| Market Size (2026) | USD 16.91 Billion |
| Market Size (2031) | USD 25.29 Billion |
| Growth Rate (2026 - 2031) | 8.37% CAGR |
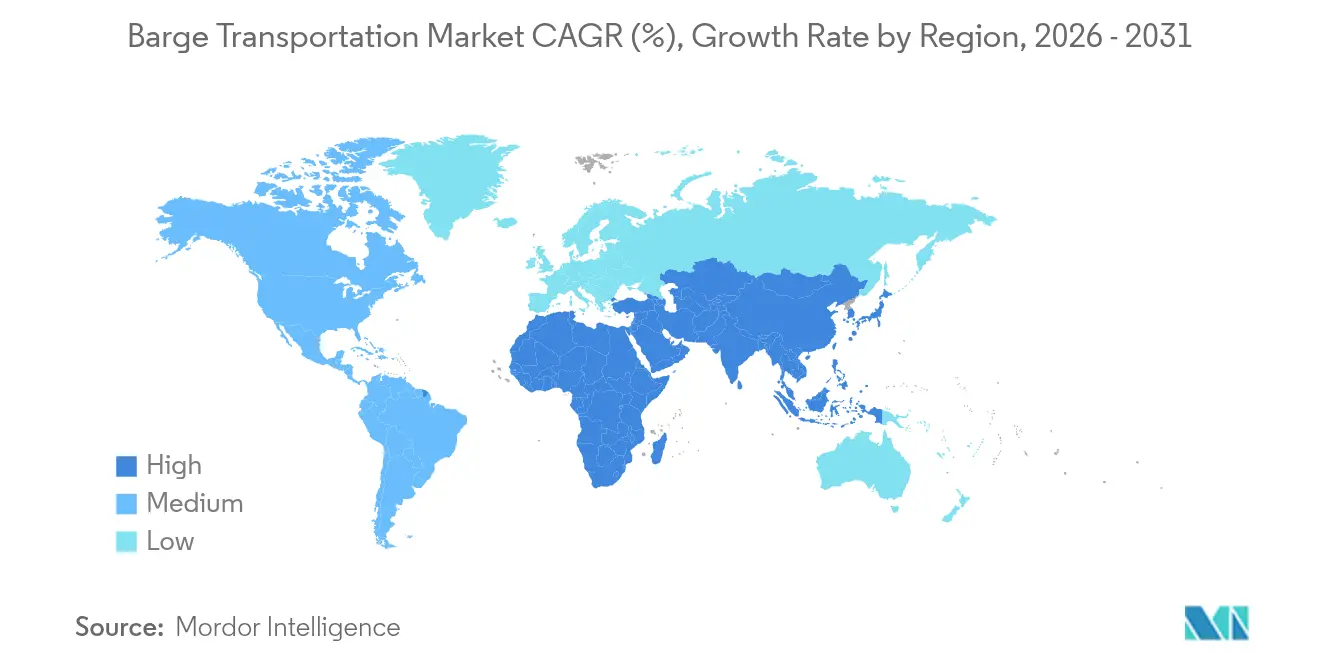
| Fastest Growing Market | Asia Pacific |
| Largest Market | North America |
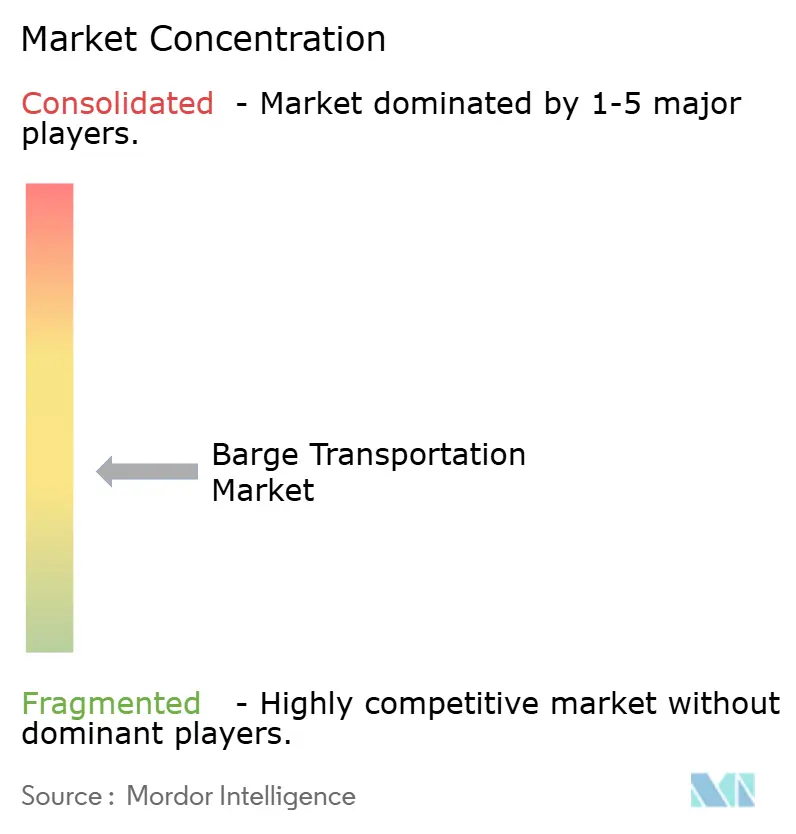
| Market Concentration | Medium |
Major Players *Disclaimer: Major Players sorted in no particular order Image © Mordor Intelligence. Reuse requires attribution under CC BY 4.0. | |
Barge Transportation Market Analysis by Mordor Intelligence
The Barge Transportation Market size is projected to be USD 15.60 billion in 2025, USD 16.91 billion in 2026, and reach USD 25.29 billion by 2031, growing at a CAGR of 8.37% from 2026 to 2031.
Demand in the barge transportation market is rising as shippers divert bulk commodities from congested highways toward inland waterways that cost less and emit fewer greenhouse gases. North America leads the sector on the strength of its extensive river network and federal funding tied to the Infrastructure Investment and Jobs Act, while Asia-Pacific is expanding fastest thanks to China’s waterway upgrades and Southeast Asia’s growing trade lanes. Dry cargo barges continue to dominate volumes, specialty units such as LNG bunkering and accommodation barges are gaining ground, and tank barges for chemicals and biofuels benefit from strict handling standards. Operators are investing in autonomous navigation and digital platforms to counter labor shortages and improve fleet utilization, and mergers—most notably Ingram Barge Company’s purchase of SEACOR’s inland fleet—are reshaping competitive positions. Even so, decades-old locks, climate-driven low-water events, and the high up-front cost of low-emission newbuilds constrain growth by increasing downtime and capital pressure.
Key Report Takeaways
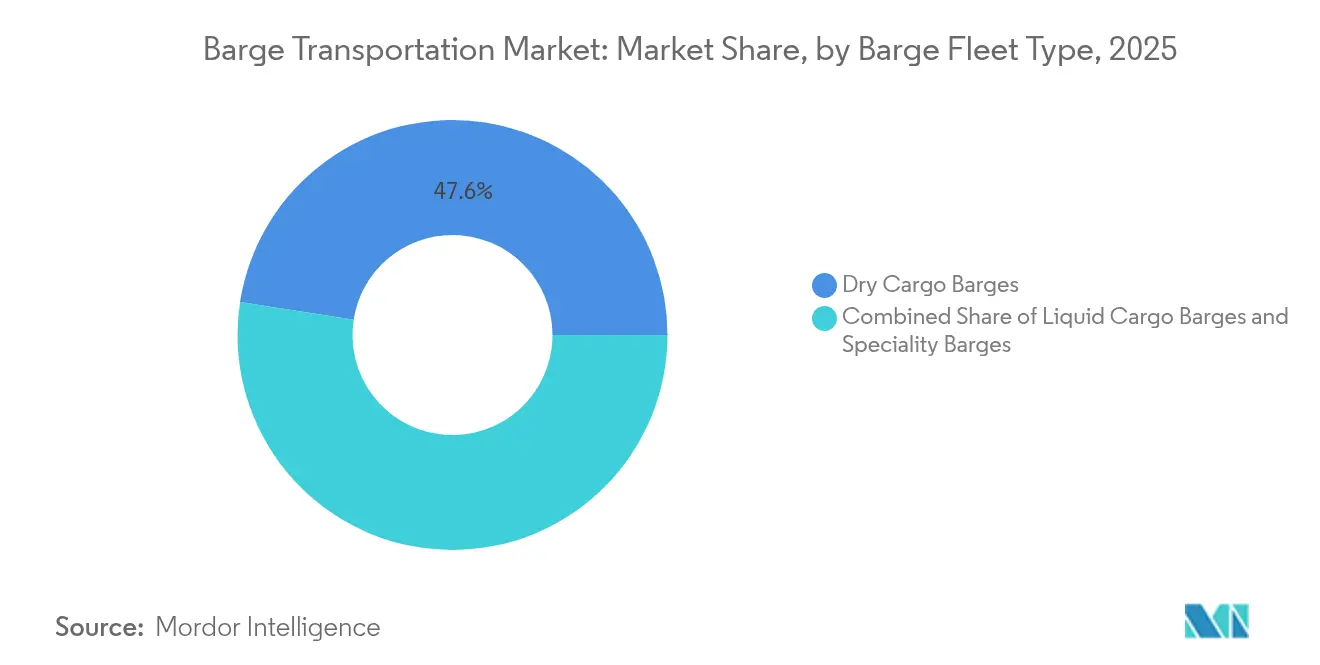
- By barge type, dry cargo vessels maintained 47.55% of barge transportation market share in 2025; specialty barges are set to grow at a 8.92% CAGR through 2031.
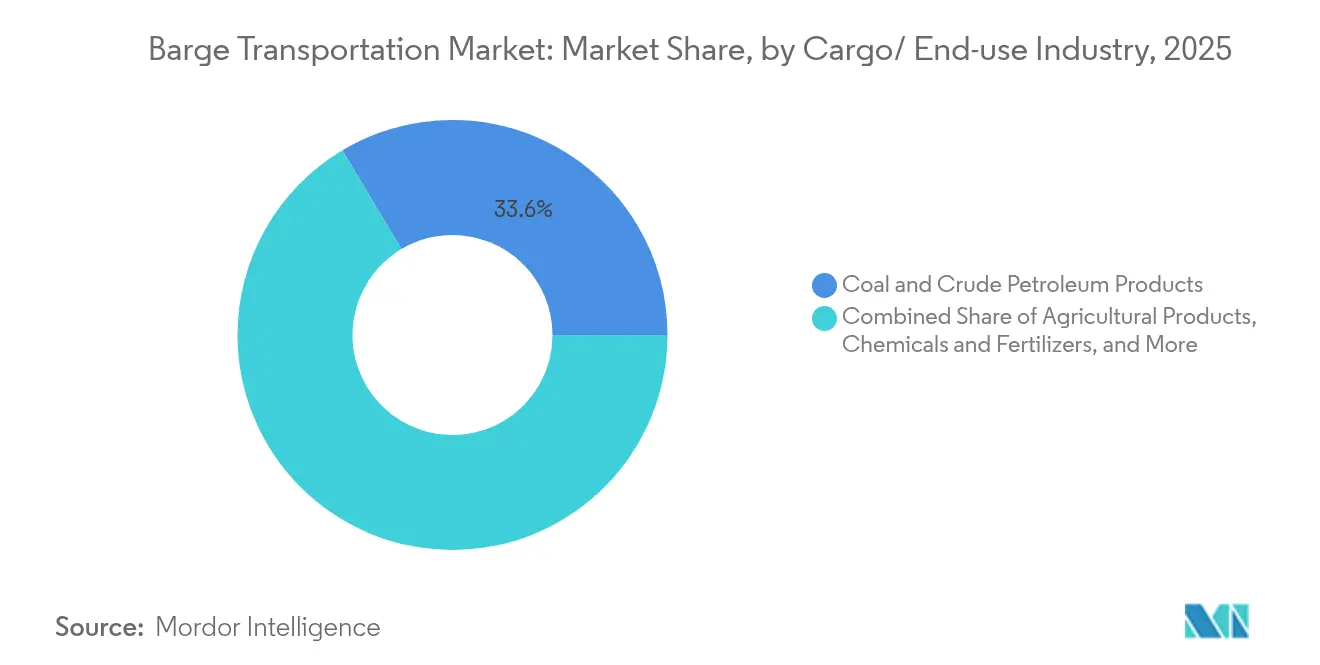
- By cargo, coal and crude petroleum accounted for 33.55% of the barge transportation market size in 2025, while chemicals and fertilizers are forecast to expand at a 9.45% CAGR.
- By geography, North America led with 41.60% revenue share in 2025; Asia-Pacific is projected to register the fastest 7.18% CAGR during 2026-2031.
- By activity, inland/domestic moves made up 67.05% of the barge transportation market size in 2025, whereas coastal/ocean-going operations are expected to advance at an 7.35% CAGR.
Note: Market size and forecast figures in this report are generated using Mordor Intelligence’s proprietary estimation framework, updated with the latest available data and insights as of 2026.
Global Barge Transportation Market Trends and Insights
Drivers Impact Analysis*
| Driver | (~) % Impact on CAGR Forecast | Geographic Relevance | Impact Timeline |
|---|---|---|---|
| Expansion of global seaborne trade | +2.1% | North America, Europe, Asia-Pacific corridors | Medium term (2-4 years) |
| Cost advantage over rail and trucking | +1.8% | Regions with mature waterway networks | Short term (≤2 years) |
| Growth in biofuel and chemical traffic | +1.5% | North America, Europe, emerging Asia | Medium term (2-4 years) |
| Digitalization and autonomous navigation | +1.2% | Rhine corridor, Mississippi system, advanced Asian hubs | Medium term (2-4 years) |
| International climate policies favoring low-emission waterborne freight | +0.9% | Europe (strongest), North America, developed Asian markets | Long term (≥ 4 years) |
| Rising global investment in dredging and lock modernization projects | +1.3% | North America, Europe, emerging in South America and Asia | Medium term (2-4 years) |
| Source: Mordor Intelligence | |||
Expansion of global seaborne trade driving inland waterway utilization
Cargo volumes handled at coastal ports continue to climb, propelling first- and last-mile demand for inland barge moves. Barges generate 89% lower greenhouse-gas emissions per ton-mile than trucks[1]U.S. Department of Transportation, “Inland Waterways and Emissions,” U.S. Department of Transportation, transportation.gov, which aligns with shipper sustainability targets. At DP World Antwerp, management reports that 35% of containers already depart by barge, reducing terminal congestion. Similar initiatives are expanding in the Gulf of Mexico and the Yangtze River Delta as ports look to preserve throughput by shifting hinterland flows onto water. Governments reinforce the shift by prioritizing dredging and lock upgrades in long-range infrastructure plans. Continuous integration of port community systems with inland terminals underpins reliable scheduling and quicker turnarounds, giving the barge transportation market further momentum.
Cost advantage amplifying appeal amid fuel price volatility
Inland barges achieve 514 ton-miles per gallon, far outperforming rail and truck alternatives. A single 15-barge tow displaces roughly 1,050 trucks, which lowers freight bills at a time when diesel prices are trending higher. Princeton TMX analysis shows the total landed cost for bulk shippers can fall by 20% when loads migrate from highway to waterways. As energy markets remain volatile, contract shippers lock in multiyear barge capacity to secure predictability. These savings cascade through supply chains, encouraging commodity producers to reconfigure distribution footprints around river ports that offer efficient multimodal interchange.
Growing biofuel and chemical movements requiring specialized tank barges
Chemical and fertilizer cargoes necessitate coated tanks, vapor-control gear and strict temperature management, leading operators to commission purpose-built equipment. Kirby Corporation reported inland marine revenue of USD 1.9 billion in 2024, an 11% uptick credited to stronger contract pricing and high tank-barge utilization. Campbell Transportation reinforced this theme by purchasing 13 towboats and 23 tank barges to enter higher-margin chemical service. The spread of bioethanol and renewable diesel production adds volume because waterborne transit protects product integrity and minimizes carbon footprints. As refineries and chemical plants cluster near navigable rivers, specialty barges will underpin the barge transportation market through 2030.
Digitalization and autonomous-navigation technologies boosting fleet productivity
Remote operations centers such as SEAFAR’s Antwerp facility now guide unmanned barges along regulated European corridors. The Central Commission for Navigation of the Rhine coordinates pilot projects that couple sensor suites with shore-based control stations to cut crew requirements without compromising safety. In the United States, Mythos AI’s autonomous boat pilot at the Port of Monroe showcases 3D-lidar channel mapping that shortens laytime and improves routing. Operators also deploy digital marketplaces like OpenTug’s BargeOS platform for instant quoting and cargo matching, trimming empty return voyages. Collectively, these innovations lift utilization, reduce human-error incidents and enhance visibility for shippers.
Restraints Impact Analysis*
| Restraint | (~) % Impact on CAGR Forecast | Geographic Relevance | Impact Timeline |
|---|---|---|---|
| Aging inland waterway infrastructure | –1.2% | North America, Europe, parts of South America | Medium term (2-4 years) |
| Climate-driven water-level variability | –0.9% | Mississippi, Rhine, Danube | Long term (≥4 years) |
| High capital cost of low-emission barge newbuilds and retrofits | –0.7% | Europe (immediate), North America, developed Asian markets | Medium term (2-4 years) |
| Intensifying competition from upgraded rail freight corridors | –0.5% | North America, Europe, emerging Asia-Pacific | Medium term (2-4 years) |
| Source: Mordor Intelligence | |||
Aging infrastructure creating operational bottlenecks
More than 80% of United States locks have exceeded the original 50-year design horizon, triggering frequent closures that delay voyages and raise costs[2]Inland Waterways Users Board, “36th Annual Report,” Inland Waterways Users Board, iwub.gov. A study on the Mississippi’s Lock 25 warned that a 30-day outage could trim national GDP by USD 3.1 billion. Although the Infrastructure Investment and Jobs Act channels USD 2.9 billion into inland construction, the maintenance backlog remains large. Europe faces a comparable challenge on the Danube where aging structures restrict draft during peak demand. Unplanned downtime erodes schedule reliability and encourages some shippers to hedge with rail contracts, dampening the barge transportation market.
Climate variability disrupting navigation and service reliability
In October 2022, the Mississippi River gauge at Memphis hit -10.5 feet, forcing operators to short-load barges and raise freight rates[3]Waterways Council, “Low Water 2022 Impact Summary,” Waterways Council, waterwayscouncil.org. Rhine River droughts have produced similar curbs, demonstrating how low-water events hamper capacity during harvest season. Meanwhile, rapid meltwater and storm surges periodically close locks because of flooding, underscoring the two-sided risk. Coast Guard teams reposition aids to navigation and coordinate dredging, yet those reactive measures add cost. Persistent volatility compels fleet managers to retain safety-driven deadweight buffers, limiting throughput and restraining growth prospects for the barge transportation market.
*Our forecasts treat driver/restraint impacts as directional, not additive. The impact forecasts reflect baseline growth, mix effects, and variable interactions.
Segment Analysis
By Barge Fleet Type: specialty barges accelerate growth while dry cargo retains scale
Dry cargo barges moved the largest share of bulk goods in 2025 and held 47.55% of barge transportation market share. Grain, coal and metal ores dominate their manifests because these vessels optimize cubic capacity and incur low unit operating cost. Fleet demand tracks harvest and energy cycles, and operators stretch asset lives through standard maintenance. Specialty barges are rising quickly, posting a forecast 8.92% CAGR as shipyards deliver LNG bunkering, accommodation and carbon-capture hulls that serve new niches. The first LNG bunkering hub on the Texas City Ship Channel, approved in May 2025, will invest at least USD 300 million in vessels and shore facilities. Regulatory certainty on alternative fuels, plus higher charter rates for purpose-built units, underpins long-term equipment orders that lift the barge transportation market.
Tank barges dedicated to chemicals and petroleum remain profitable because safety compliance differentiates service. The American Bureau of Shipping issued strict guidelines on LNG and methanol fueling systems, enabling owners to qualify for premium contracts. Carbon-capture demonstration programs envision liquefied CO₂ barges operating on the Gulf Intracoastal Waterway, hinting at fresh demand pools. Continuous investment in coatings, vapor-control consoles and real-time monitoring keeps barriers to entry high, preserving utilization and margins within this slice of the barge transportation industry.


By Cargo / End-use Industry: chemicals outpace energy commodities
Coal and crude petroleum accounted for 33.55% of 2025 loadings in the barge transportation market, reflecting legacy power-generation and refining flows across the Ohio and Lower Mississippi rivers. These commodities underpin baseline tonnage but face long-term headwinds from energy-transition policies. Conversely, chemicals and fertilizers should expand at 9.45% a year as industrial output climbs and farms seek nutrient inputs. Campbell Transportation’s USD 111.65 million acquisition of 13 towboats and 25 tank barges targets precisely this higher-growth segment. The uptick is mirrored in monthly Department of Agriculture reports that show barged grain volumes reached 428,300 tons in January 2025, up 28% year on year.
Project cargo such as wind-turbine blades also travels by barge given dimensional limits on road bridges. In Brazil, a PALFINGER MARINE contract to equip 400 new iron-ore barges with deck cranes illustrates how mining logistics drive vessel production. As infrastructure investment accelerates worldwide, specialized barges carrying heavy modules will further diversify revenue and strengthen the barge transportation market size.
By Barging Activity: inland services dominate but coastal routes log faster gains
Inland/domestic operations captured 67.05% of the barge transportation market size during 2025 because North American and European river networks provide reliable corridors for bulk moves. Towboats push up to 25,000 short-tons of grain per trip in the Upper Mississippi, ensuring scale economies. Digital charting projects such as Mythos AI’s lidar-enabled mapping at Monroe shorten transits and heighten safety. Investments like these sustain competitive cost structures and reinforce modal advantages over rail.
Coastal and ocean-going barges, while smaller in absolute numbers, are expected to expand at an 7.35% CAGR through 2031 as shippers piece together all-water routes that circumvent truck restrictions. Great Lakes East, formed after Great Lakes Towing acquired the Barge CRIMSON CLOVER, plans break-bulk and RORO links from Florida to the Caribbean. Maritime regulators also encourage short-sea shipping to relieve congested highways, channeling grant funding toward low-emission towboats. The resulting network effects lift volumes on feeder services and inject fresh demand into the barge transportation market.
Geography Analysis
North America generated 41.60% of 2025 revenue, anchored by the Mississippi, Ohio and Illinois rivers. Federal allocations of USD 2.9 billion for inland upgrades improve lock reliability and draft availability, and 2022 cargo throughput surpassed 257 million tons despite historic low water. Ingram Barge Company’s addition of more than 1,000 barges from SEACOR scales its network to meet durable demand. Autonomous pilots, as tested by Mythos AI, could unlock further efficiency once United States Coast Guard rules on remote operations mature.
Asia-Pacific holds the strongest near-term growth outlook in the barge transportation market with an 7.18% CAGR. China pours resources into deepening the Yangtze, and local authorities streamline barge-truck transfers at inland ports to remove bottlenecks. The Regional Comprehensive Economic Partnership encourages regional production shifts that move more intermediate goods on waterways. In Southeast Asia, maritime freight already accounts for 61% of trade value, and new intermodal corridors extend barge reach into land-locked provinces.
Europe remains pivotal in the barge transportation market, underpinned by Rotterdam and Antwerp-Bruges which together add EUR 50 billion of value annually. The NAIADES programme seeks a 25% jump in inland volumes by 2030, requiring zero-emission vessels and smart traffic management. Yet climate-related low Rhine levels periodically divert freight to rail, showing the vulnerability of river transport. Investment in lock deepening and automated water-level forecasting is therefore a policy priority that safeguards the barge transportation market.
South America emerges as an agricultural export powerhouse with soy and corn flows shifting steadily toward barges. Corn exports that used barges rose from 3% to 16% between 2010 and 2023, reflecting freight savings on the Tapajós and Madeira rivers. PALFINGER MARINE’s Brazilian iron-ore program demonstrates how mining drives additional barge demand. Debate over wetland protection along the Paraguay-Paraná waterway shows environmental scrutiny is intensifying, which could shape permitting timelines for future projects.
Note: Segments share of all individual segments available upon report purchase

Competitive Landscape
The barge transportation market shows moderate concentration. In tank barges, Kirby Corporation controls 27% of United States capacity across 1,094 units rated at 24.2 million barrels. Ingram Barge Company’s 2024 fleet acquisition strengthened its bulk presence and illustrated continued consolidation that blends regional positions into national footprints. American Commercial Barge Line, Canal Barge and Marquette Transportation round out the top tier, while niche operators focus on specialty cargo or geography.
Technology investment defines current strategy. OpenTug’s BargeOS software supports instant quoting, booking and real-time tracking, and carriers adopting it report shorter sales cycles. Fleet owners test hybrid-electric propulsion and fit selective catalytic reduction systems to comply with emission rules. Tidewater Barge Lines secured MARAD funding for low-emission towboats, aligning cost savings with regulatory credits.
White-space opportunities include LNG bunkering services on the Gulf Coast and future liquefied-CO₂ shuttles that may underpin carbon-capture logistics. Early movers benefit from specialized engineering know-how and can command premium charters once environmental policies internalize carbon costs. Autonomous navigation also remains an opening; SEAFAR’s remote operations center is already handling live barge traffic in Belgium, suggesting a scalable model for labor-constrained routes.
Barge Transportation Industry Leaders
Kirby Corporation
American Commercial Barge Line (ACBL)
Ingram Marine Group
SEACOR Holdings
Campbell Transportation
- *Disclaimer: Major Players sorted in no particular order

Recent Industry Developments
- March 2025: Ingram Marine Group launched Ingram Infrastructure Group to broaden integrated logistics across 4,500 miles of inland waterways.
- July 2024: Turn Services agreed to acquire Marine Fueling Service Inc., including eight motor vessels rated 1,000-2,000 hp, strengthening its Gulf Coast footprint in fleeting, towing, and fueling services.
- March 2024: Ingram Marine Group, via Inland River Transport Holdings LLC, completed the acquisition of SEACOR Holdings Inc.’s U.S. inland river transportation and logistics platform, adding 1,000-plus covered dry-cargo hopper barges and an extensive Mississippi River network.
- January 2024: Campbell Transportation repowered the M/V Louise S towboat with Tier 3 Mitsubishi engines, demonstrating its commitment to regulatory compliance, fuel efficiency, and emissions reduction.


Research Methodology Framework and Report Scope
Market Definitions and Key Coverage
Our analysis defines the global barge transportation market as operator revenue earned from towing or pushing dry, liquid, and specialty barges along inland rivers, canals, and protected coastal routes, expressed in constant 2024 US dollars.
Scope Exclusions. We exclude oceangoing freight vessels, barge new-build sales, and the cargo's intrinsic value.
Segmentation Overview
- By Barge Fleet Type
- Dry Cargo Barges
- Liquid Cargo Barges
- Specialty Barges
- By Cargo / End-use Industry
- Agricultural Products
- Coal & Crude Petroleum Products
- Chemicals & Fertilizers
- Metal Ores & Alloys
- Project & Oversized Cargo
- Others
- By Barging Activity
- Inland / Domestic
- Coastal / Ocean-going
- By Geography
- North America
- United States
- Canada
- Mexico
- South America
- Brazil
- Peru
- Chile
- Argentina
- Rest of South America
- Asia Pacific
- India
- China
- Japan
- Australia
- South Korea
- South East Asia (Singapore, Malaysia, Thailand, Indonesia, Vietnam, and Philippines)
- Rest of Asia-Pacific
- Europe
- United Kingdom
- Germany
- France
- Spain
- Italy
- BENELUX (Belgium, Netherlands, and Luxembourg)
- NORDICS (Denmark, Finland, Iceland, Norway, and Sweden)
- Rest of Europe
- Middle East And Africa
- United Arab of Emirates
- Saudi Arabia
- South Africa
- Nigeria
- Rest of Middle East And Africa
- North America
Detailed Research Methodology and Data Validation
Primary Research
We supplemented desk work through structured interviews with barge owners, port engineers, commodity shippers, and regulators across North America, Europe, and the Yangtze corridor, which clarified utilization swings, lock delays, and fuel cost pass-throughs.
Desk Research
Our analysts first assembled ton-mile and traffic baselines from tier-1 public sources such as the US Army Corps of Engineers Waterborne Commerce series, Eurostat inland waterway freight tables, the Central Commission for Navigation on the Rhine, and UNCTAD maritime reviews. These datasets anchor regional throughput and seasonality, and we enriched them with operator filings accessed through Dow Jones Factiva and D&B Hoovers to capture prevailing day-rates.
This is where Mordor Intelligence differentiates, as our team also screens trade journals, port authority releases, customs data, and national transport ministry bulletins to flag commodity shifts that move rates. The sources listed are illustrative; many additional open records were consulted during verification.
Market-Sizing & Forecasting
We start with a top-down model that converts reported regional ton-miles into revenue using corridor-specific freight averages and currency-adjusted rate histories. Select bottom-up tests, fleet capacity × utilization × sampled day rates, guard against mis-estimation. Key drivers in the model include grain export volumes, coal and crude shipment shares, lock throughput hours, bunker fuel trends, and dredging budgets. A multivariate regression blends these series to project 2026-2030 demand, while scenario analysis stress-tests high-water and drought years. Data gaps are filled by conservative ranges validated in interviews.
Data Validation & Update Cycle
Every draft runs through variance scans against customs receipts and port-call databases; anomalies trigger re-contacts before sign-off. Mordor Intelligence refreshes the model annually and issues interim updates whenever floods, strikes, or major policy moves reshape traffic.
Why Mordor's Barge Transportation Baseline Commands Trust
Published estimates differ because firms mix cargo value, shipyard income, or coastal shipping with inland towage, and many freeze rate assumptions for years. By sticking to verifiable freight charges, corridor-level rates, and an annual refresh, we avoid the inflation caused when other studies pool ocean barges, layer cargo value, or reuse stale utilization factors.
Benchmark comparison
| Market Size | Anonymized source | Primary gap driver |
|---|---|---|
| USD 15.60 B (2025) | Mordor Intelligence | |
| USD 136.10 B (2024) | Global Consultancy A | Includes cargo value and coastal shipping; single global average rate assumption |
| USD 141.30 B (2025) | Industry Journal B | Adds shipyard revenue and tankers; five-year refresh cycle |
| USD 133.10 B (2024) | Research Firm C | Combines inland and ocean barges; limited primary validation |
The comparison confirms that the disciplined scope, corridor-specific variables, and yearly recalibration used by Mordor Intelligence provide decision-makers with a transparent, auditable baseline.


Key Questions Answered in the Report
What is the current value of the barge transportation market?
The market is valued at USD 16.91 billion in 2026 and is forecast to reach USD 25.29 billion by 2031.
Which region holds the largest barge transportation market share?
North America leads with 41.60% revenue share thanks to its expansive river network and substantial infrastructure investment.
Which barge segment is growing fastest?
Specialty barges, including LNG bunkering and accommodation vessels, are projected to grow at a 8.92% CAGR during 2026-2031.
How do barges compare to trucks in emissions performance?
Barge transport produces 89% lower greenhouse-gas emissions per ton-mile than trucking, making it the most environmentally efficient major freight mode.
What are the main restraints on market growth?
Aging locks and dams that trigger unscheduled closures and increased climate-driven water-level variability are the most significant constraints on service reliability.
Which companies dominate the United States inland tank barge fleet?
Kirby Corporation, Ingram Barge Company, American Commercial Barge Line, Canal Barge and Marquette Transportation together hold significant capacity.
Page last updated on:


